
Stock Trading Alert originally sent to subscribers on August 14, 2014, 6:33 AM.
Briefly: In our opinion, speculative short positions are favored (with stop-loss at 1,970 and a profit target at 1,850, S&P 500 index)
Our intraday outlook is bearish, and our short-term outlook remains bearish:
Intraday
(next 24 hours) outlook: bearish
Short-term (next 1-2 weeks) outlook: bearish
Medium-term (next 1-3 months) outlook: neutral
Long-term outlook (next year): bullish
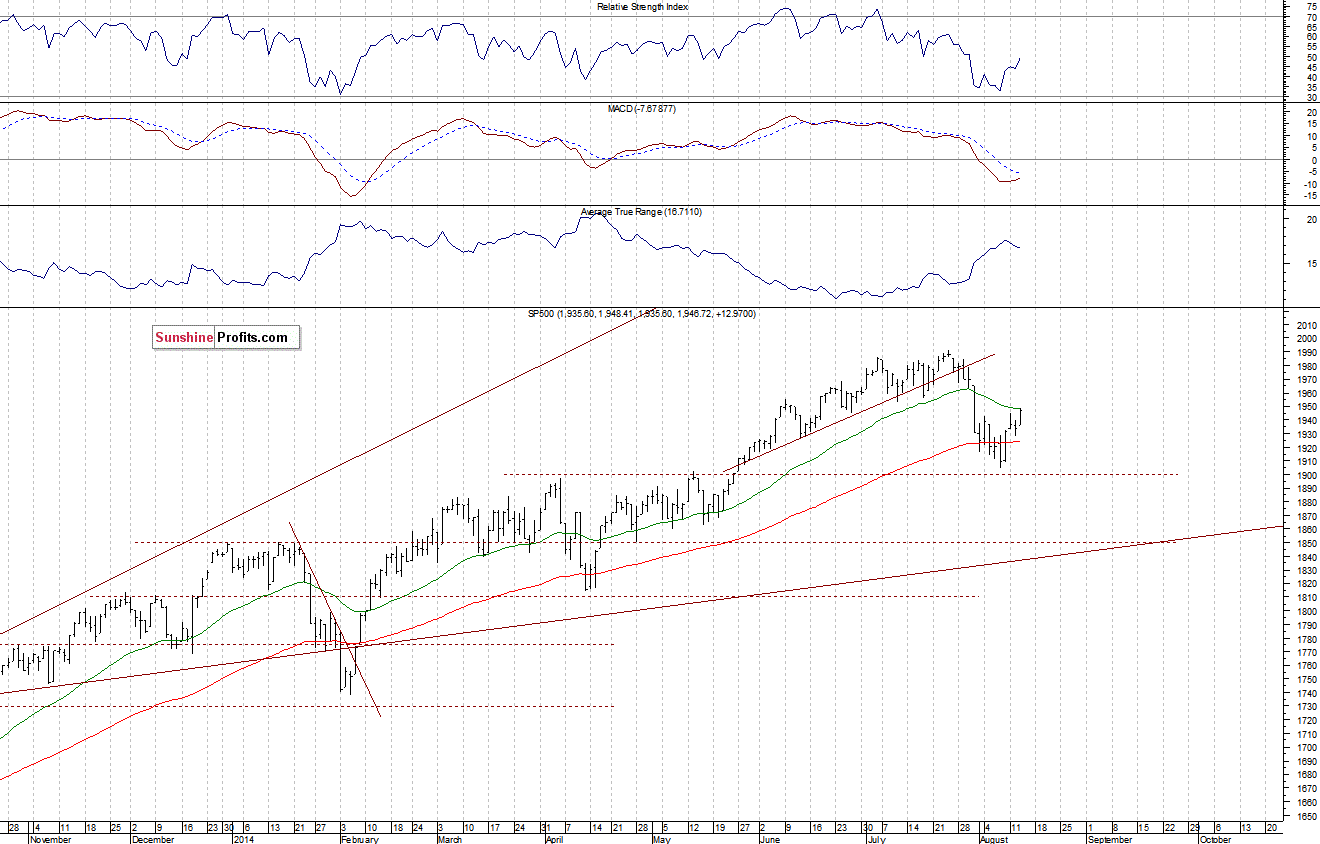
The U.S. stock market indexes gained between 0.6% and 1.1% on Wednesday, extending their recent move up, as investors bet that stocks would resume their long-term uptrend following a downward correction. The S&P 500 index reached 50% retracement level of the downtrend at 1,948.1. Retracement is a temporary price movement in the opposite direction of the previous trend. The last important retracement level is Fibonacci’s golden ratio of 61.8%. In this case the 61.8% retracement of the recent sell-off is at the level of 1,958.3. The nearest important resistance level is at around 1,950, and the next level of resistance is at 1,970-1,990, marked by the July 24 all-time high of 1,991.39, among others. On the other hand, the support is at 1,930-1,940, marked by recent local highs. It is still a correction within short-term downtrend, however, a bullish scenario cannot be excluded here, as the market may resume its long-term uptrend:
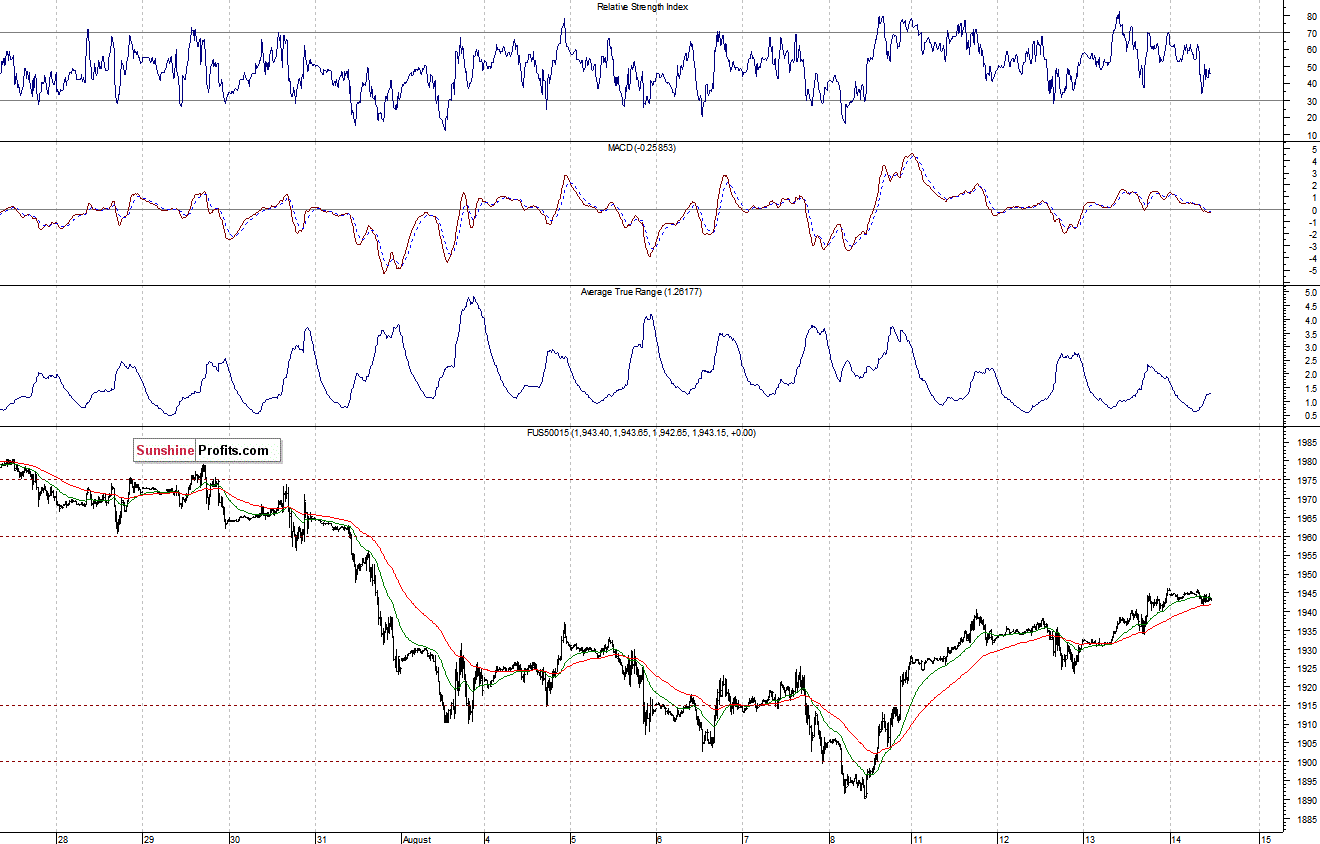
Expectations before the opening of today’s session are virtually flat. The main European stock market indexes have been mixed so far. Investors will now wait for the Initial Claims data release at 8:30 a.m. The S&P 500 futures contract (CFD) is in a relatively narrow intraday trading range, as it fluctuates slightly below the level of 1,950. The support level is at around 1,940, marked by recent local high. For now, it looks like a correction following late July – early August sell-off, as we can see on the 15-minute chart:
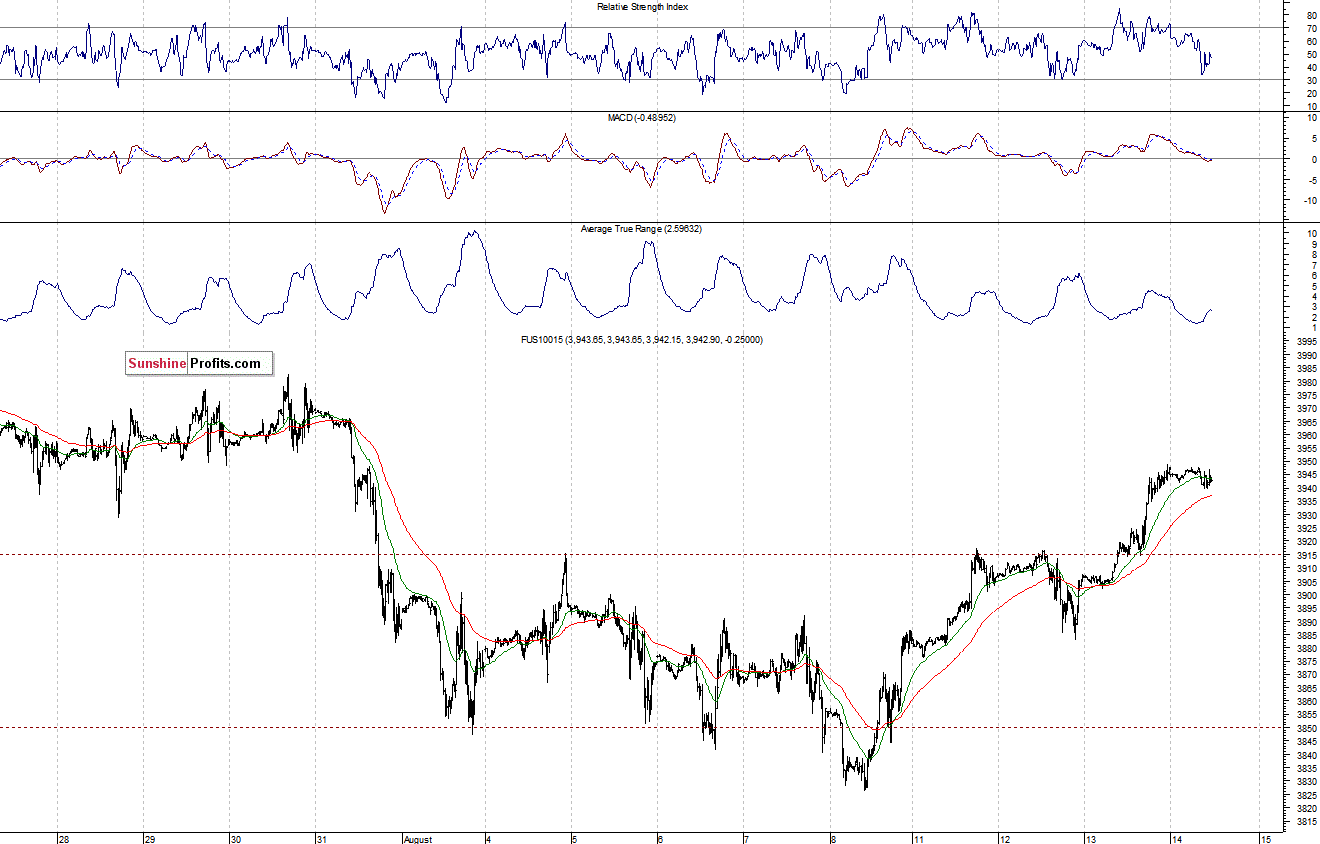
The technology Nasdaq 100 futures contract (CFD) is relatively stronger, as it trades just below its July consolidation. The resistance level is at around 3,950, and the next level of resistance is at 3,980-4,000. On the other hand, the level of support is at 3,915, marked by previous resistance, as the 15-minute chart shows:
Concluding, the broad stock market extends its recent move up. However, it continues to look like a correction within a short-term downtrend, as the S&P 500 index tests the resistance marked by 50% retracement of the move down. We remain cautiously pessimistic, maintaining our speculative short position. The stop-loss remains at 1,970, and a profit target at 1,850 (S&P 500 index). It is important to set an exit price level in case some events cause the price to move in the unlikely direction. Nobody can be correct about any market 100% of the time, and having safety measures in place helps to limit potential losses while letting the gains grow.
There will be no Stock Trading Alert tomorrow, Friday, August 15. We apologize for inconvenience.
Thank you.
Paul Rejczak
Stock Trading Strategist
Stock Trading Alerts
