
Stock Trading Alert originally sent to subscribers on August 7, 2014, 6:57 AM.
Briefly: In our opinion, speculative short positions are favored (with stop-loss at 1,970 and a profit target at 1,850, S&P 500 index)
Our intraday outlook is bearish, and our short-term outlook is bearish, following a breakout below recent consolidation:
Intraday
(next 24 hours) outlook: bearish
Short-term (next 1-2 weeks) outlook: bearish
Medium-term (next 1-3 months) outlook: neutral
Long-term outlook (next year): bullish
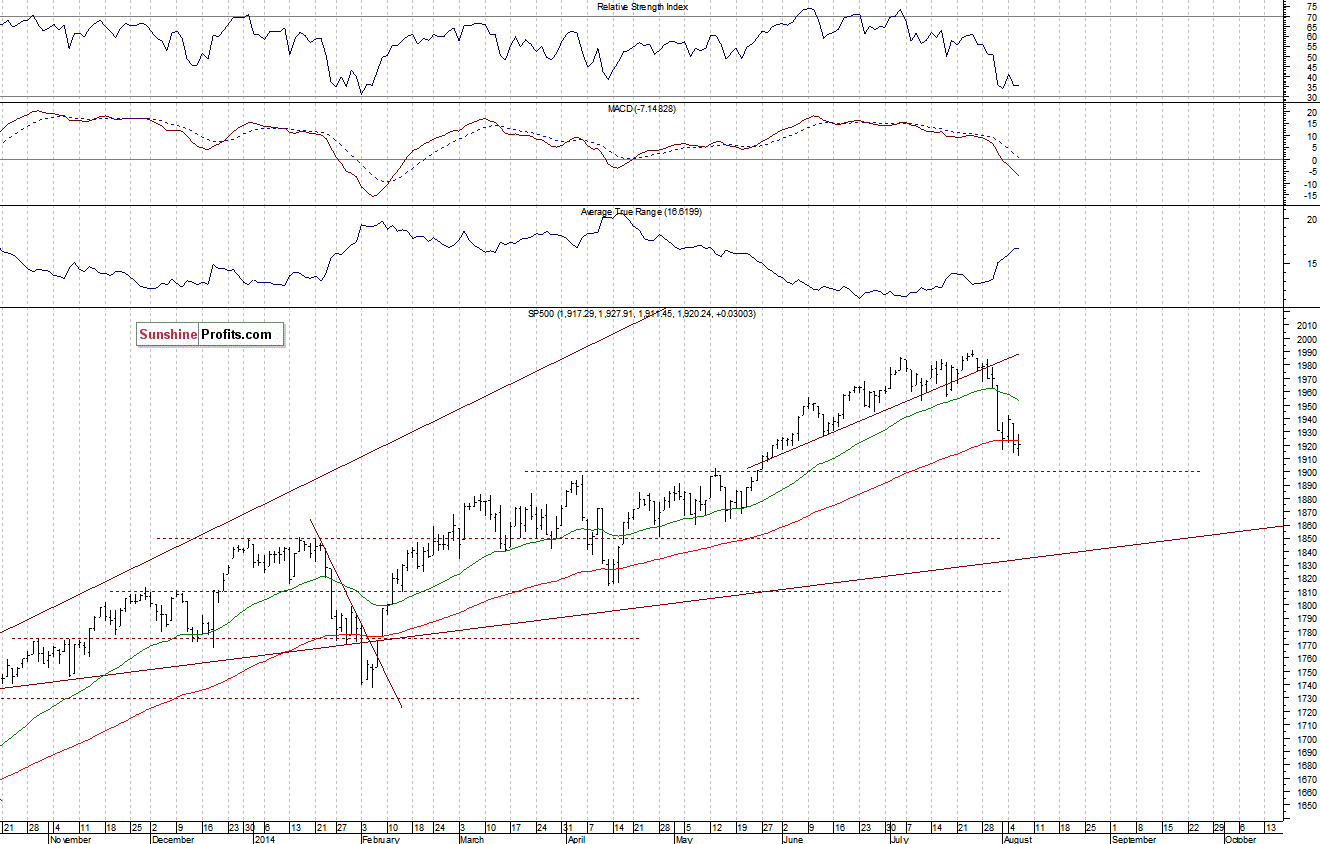
The U.S. stock market indexes were virtually flat on Wednesday, after a quite volatile trading session, as investors continued to hesitate following recent move down. The S&P 500 index reached new short-term downtrend low at the level of 1,911.45. The nearest important support level is at around 1,900-1,910. On the other hand, the level of resistance is at 1,940, marked by recent local highs. There have been no confirmed positive signals. For now, it looks like a flat correction within short-term downtrend:
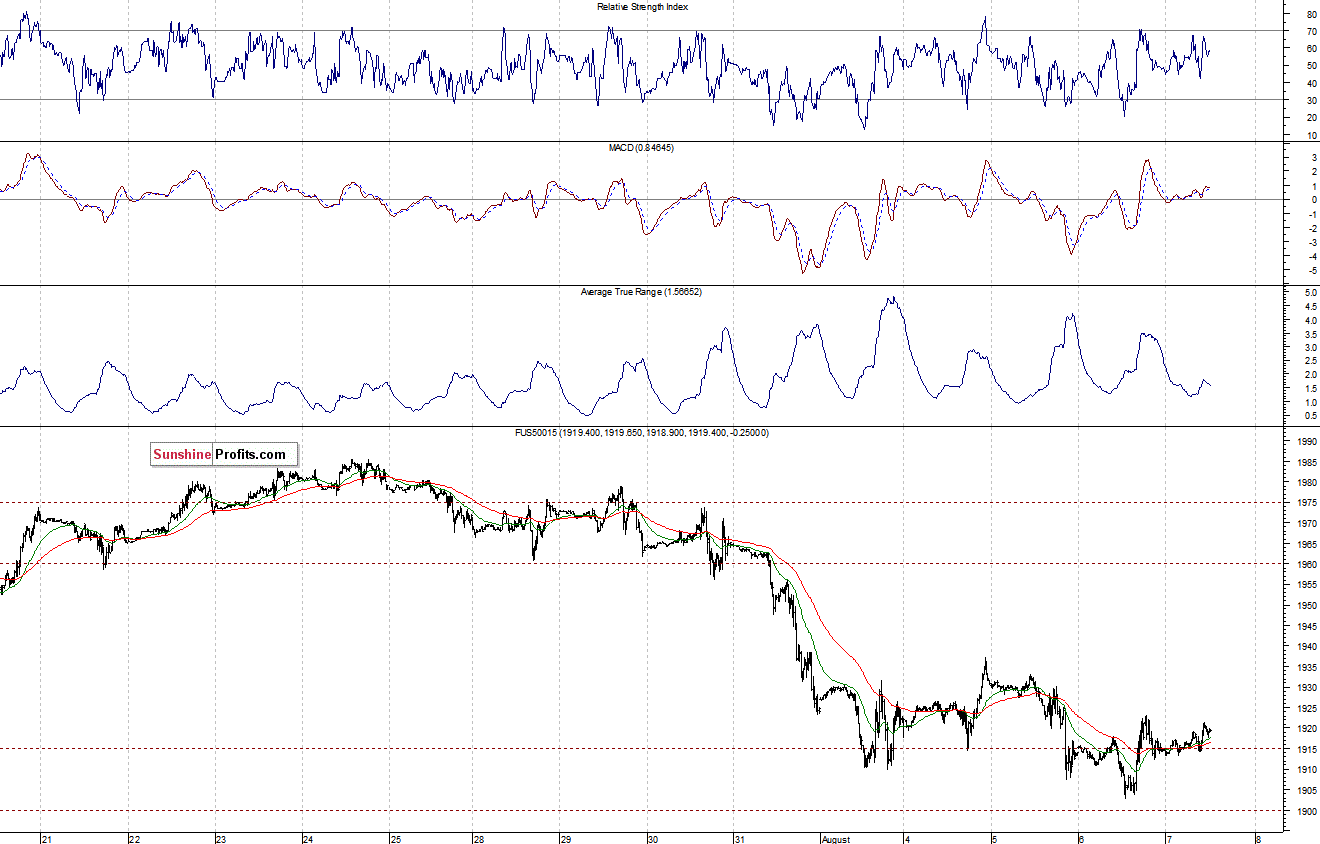
Expectations before the opening of today’s session are slightly positive, with index futures currently up 0.2-0.3%. The main European stock market indexes have been mixed between -0.3% and 0.0% so far. Investors will now wait for some economic data announcements: European Central Banks policy decisions, and Initial Claims at 8:30 a.m. The Initial Claims is a measure of the number of jobless claims filled by individuals seeking to receive state jobless benefits. Higher initial claims may show weakening economy, however, week-to-week numbers tend to be volatile around this time of the year. The S&P 500 futures contract (CFD) is in a relatively tight intraday trading range. The nearest important support level is at around 1,900-1,905. On the other hand, the resistance level is at 1,930-1,935, marked by recent local highs, as we can see on the 15-minute chart:
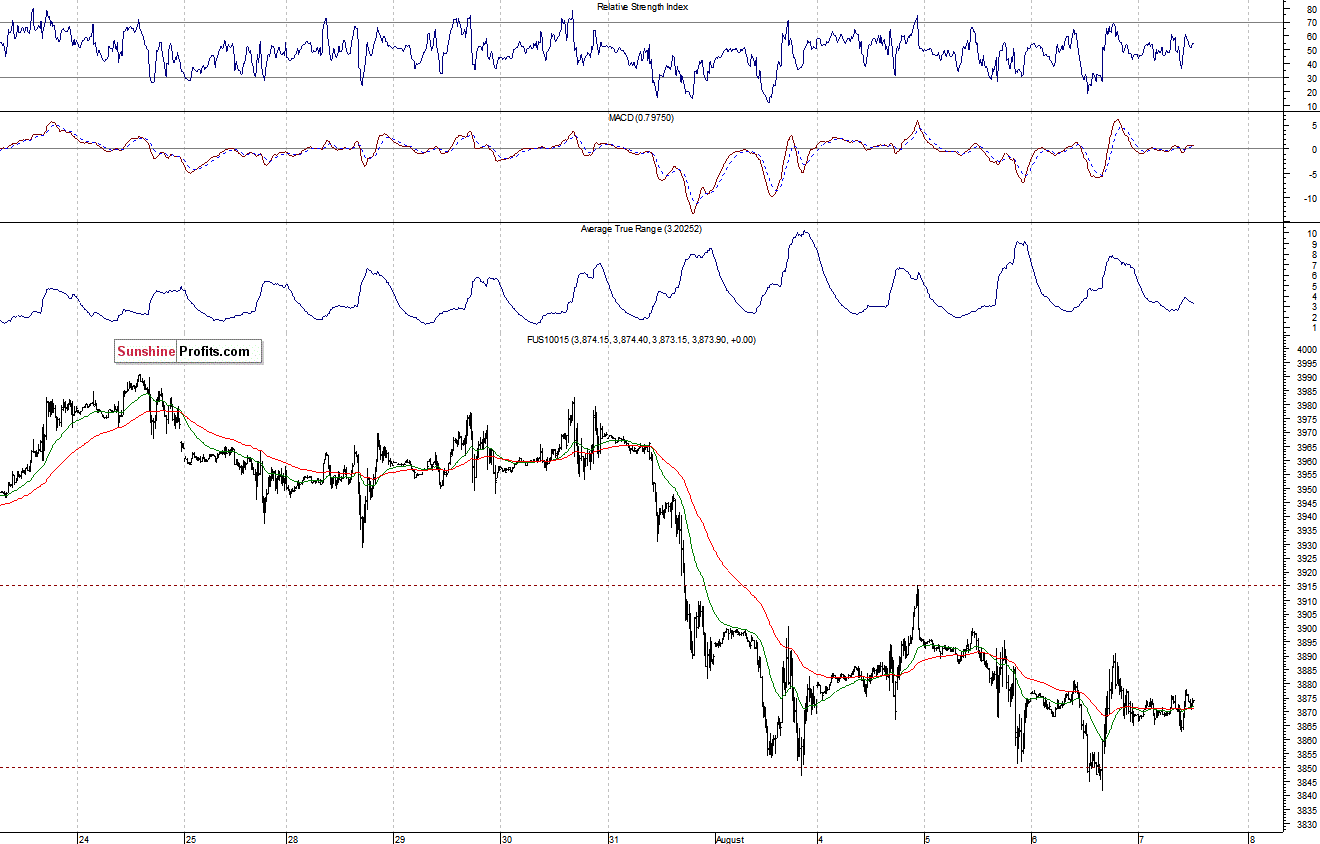
The technology Nasdaq 100 futures contract (CFD) is in a similar consolidation, following last week’s move down. The resistance level remains at around 3,900, and the nearest important level of support is at 3,850, marked by recent lows, as the 15-minute chart shows:
Concluding, the broad stock market is in a consolidation following recent decline. We expect some more downside. Therefore, we continue to maintain our already profitable speculative short position (with stop-loss at 1,970, and a profit target at 1,850 – S&P 500 index). It is always important to set some exit price level in case your opinion is wrong or your trading method fails at some point in time.
Thank you.
Paul Rejczak
Stock Trading Strategist
Stock Trading Alerts
