
Stock Trading Alert originally sent to subscribers on August 4, 2014, 6:28 AM.
Briefly: In our opinion, speculative short positions are favored (with stop-loss at 1,970 and a potential profit target at 1,850, S&P 500 index)
Our intraday outlook is bearish, and our short-term outlook is bearish, following a breakout below recent consolidation:
Intraday
(next 24 hours) outlook: bearish
Short-term (next 1-2 weeks) outlook: bearish
Medium-term (next 1-3 months) outlook: neutral
Long-term outlook (next year): bullish
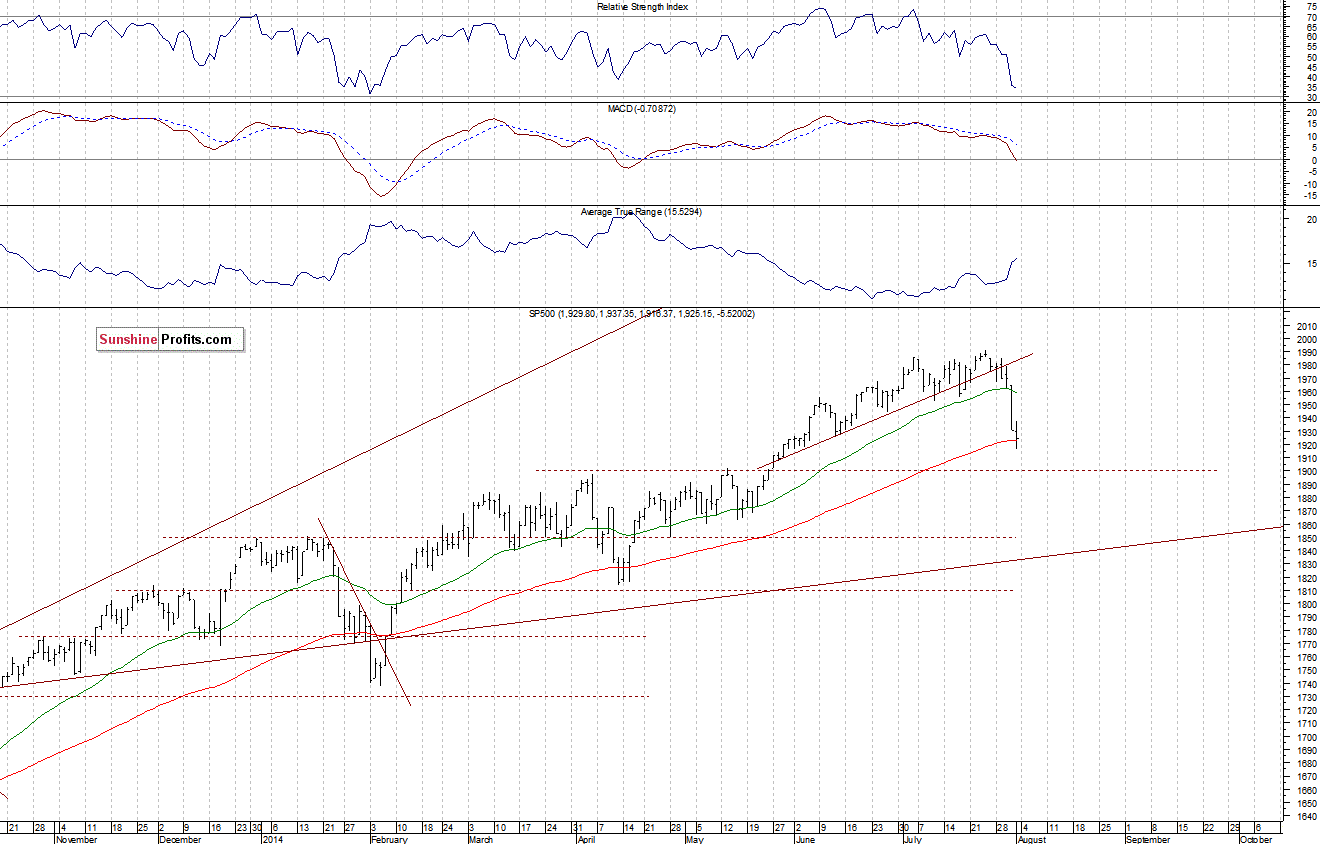
The U.S. stock market indexes lost 0.3-0.4% on Friday, extending their recent selloff, as investors reacted to some key economic data announcements - monthly jobs report, the ISM index, among others. Investors begin to expect rising interest rates, which is putting downward pressure on stock prices. The S&P 500 index got closer to the level of 1,900, as it reached the daily low at 1,916.37, which is the lowest since early June. The market remains in a short-term downtrend, following a breakout below upward trend line. The nearest important support level is at around 1,900-1,920. On the other hand, the level of resistance is at 1,940-1,950, marked by previous local lows. There have been no confirmed positive signals so far, as we can see on the daily chart:
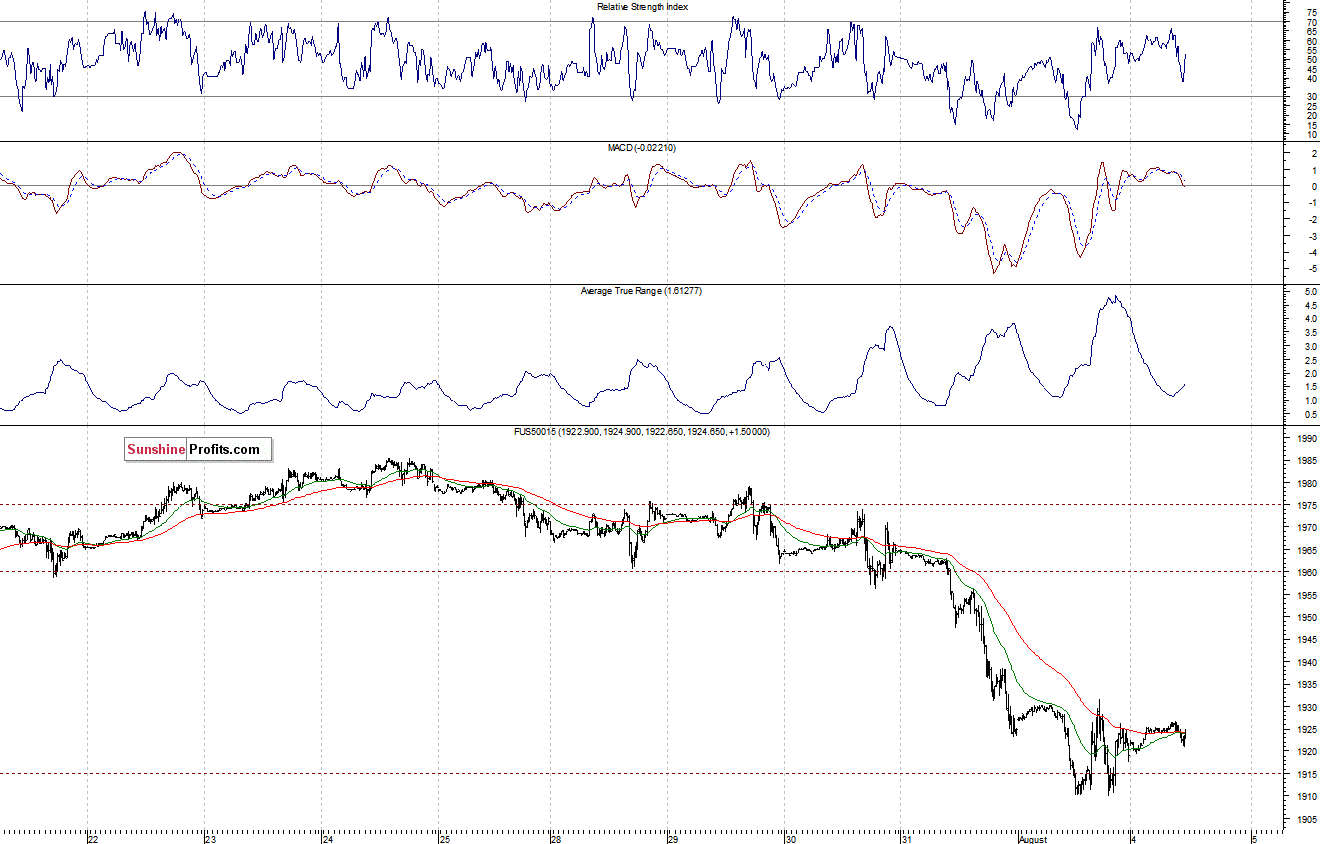
Expectations before the opening of today’s session are positive, with index futures currently up 0.3%. The main European stock market indexes have been mixed between -0.2% and +0.3% so far. The S&P 500 futures contract (CFD) is in an intraday consolidation, following last week’s decline. The nearest important level of support is at 1,910-1,915, and the nearest resistance level is at around 1,930, marked by Friday’s local highs, as the 15-minute chart shows:
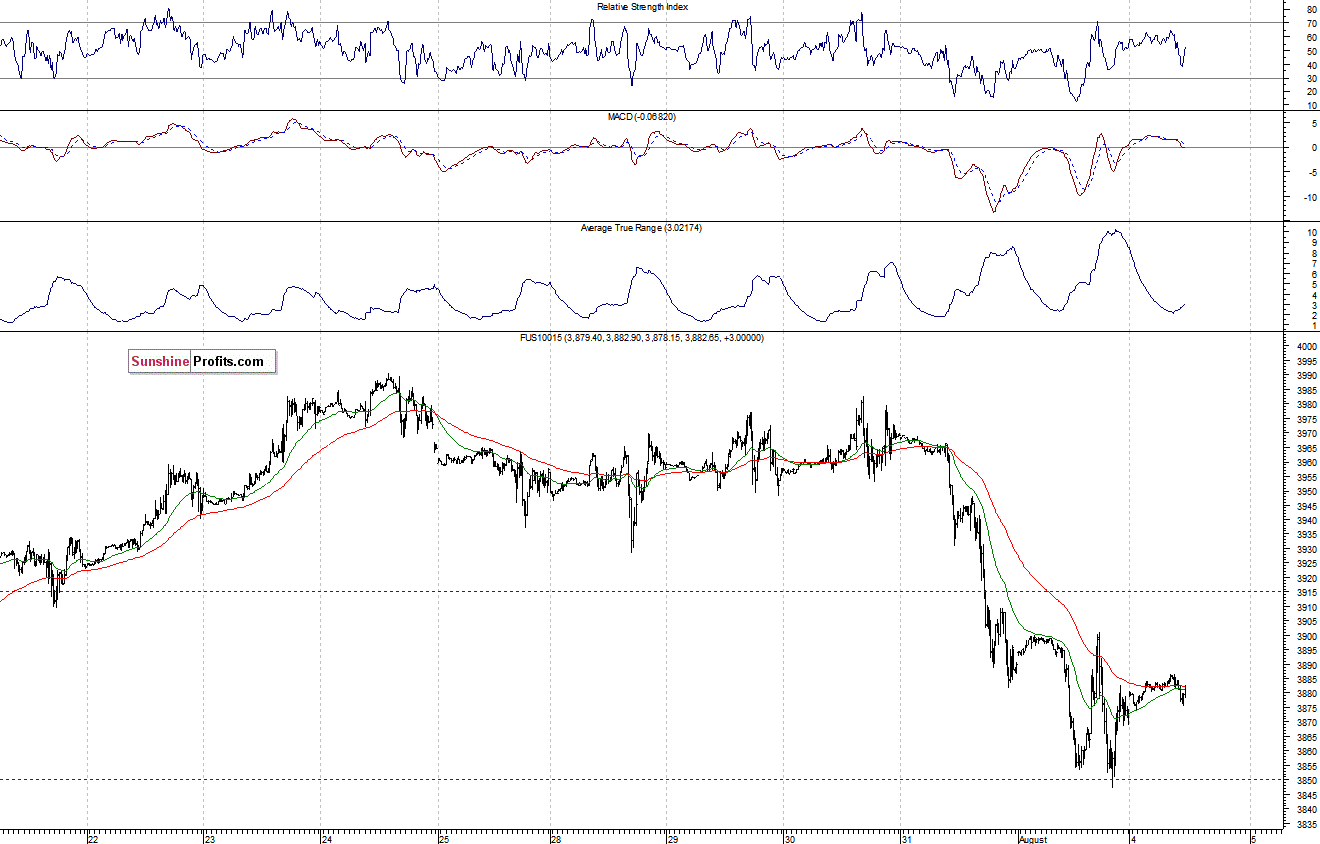
The technology Nasdaq 100 futures contract (CFD) is in a similar consolidation, following recent move down. The resistance level is at around 3,900, and the level of support remains at around 3,850. For now, it looks like a flat correction within a short-term downtrend:
Concluding, the broad stock market is in a short-term downtrend, following last week’s breakout below two-month long upward trend line. In our opinion, speculative short positions with a stop-loss at 1,970 and a potential profit target at 1,850 (S&P 500 index) seem justified at this moment.
Thank you.
Paul Rejczak
Stock Trading Strategist
Stock Trading Alerts
