
Stock Trading Alert originally sent to subscribers on June 30, 2014, 7:28 AM.
Briefly: In our opinion, no speculative positions are justified.
Our intraday outlook remains neutral, and our short-term outlook is neutral, following last Tuesday’s intraday reversal:
Intraday
(next 24 hours) outlook: neutral
Short-term (next 1-2 weeks) outlook: neutral
Medium-term (next 1-3 months) outlook: neutral
Long-term outlook (next year): bullish
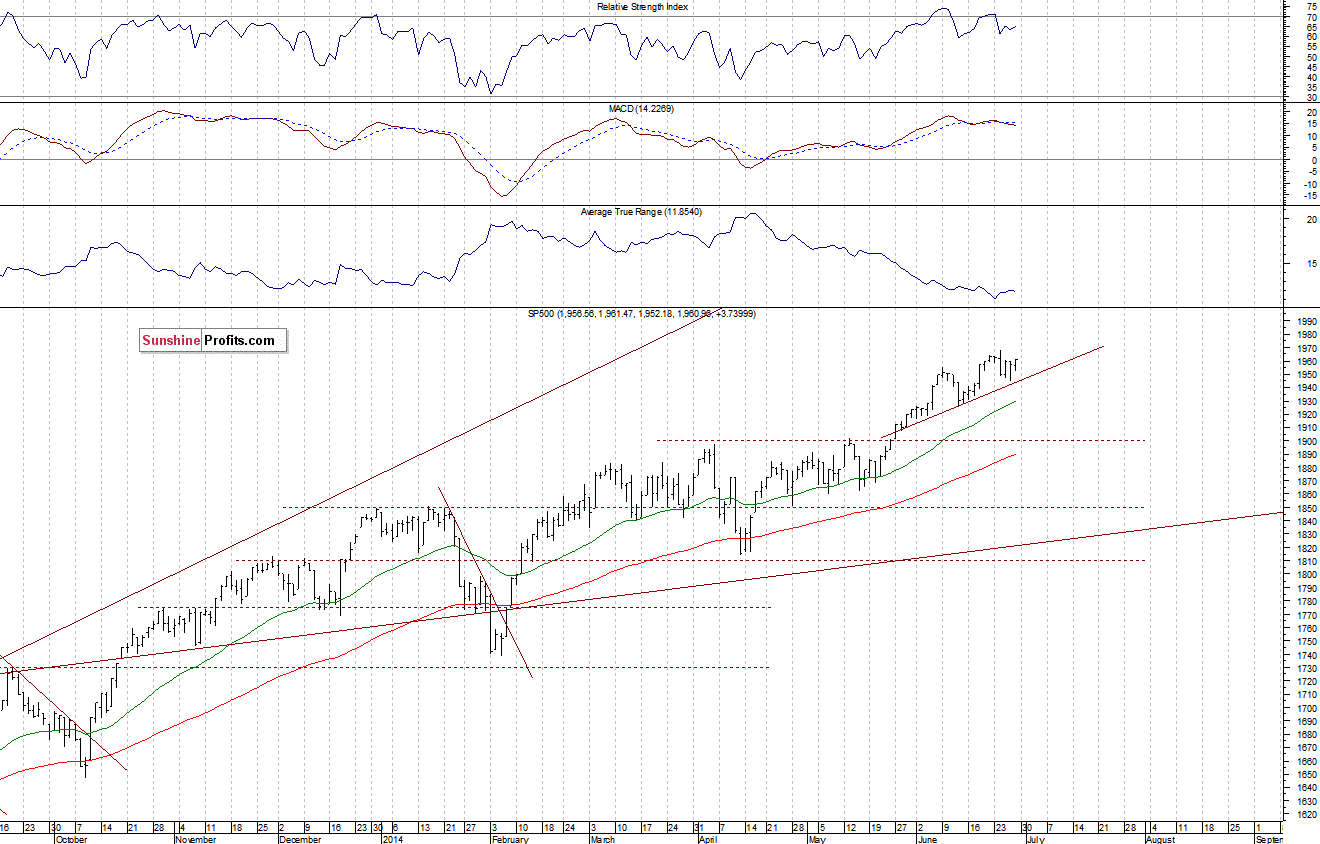
The main U.S. stock market indexes were mixed between 0.0% and +0.5% on Friday, as investors continued to hesitate following recent move up. Our Friday’s neutral intraday outlook has proved to be quite accurate. The S&P 500 index extends its short-term consolidation, as it moves along the level of 1,950. The level of resistance is at 1,960-1,970, marked by the June 24 all-time high of 1,968.17, among others. On the other hand, the support level is at around 1,940, marked by some of the local extremes. The next support level is at 1,915-1,925. The broad market remains above month-long upward trend line, which is positive. There have been no confirmed sell signals, however, a correction scenario cannot be excluded:
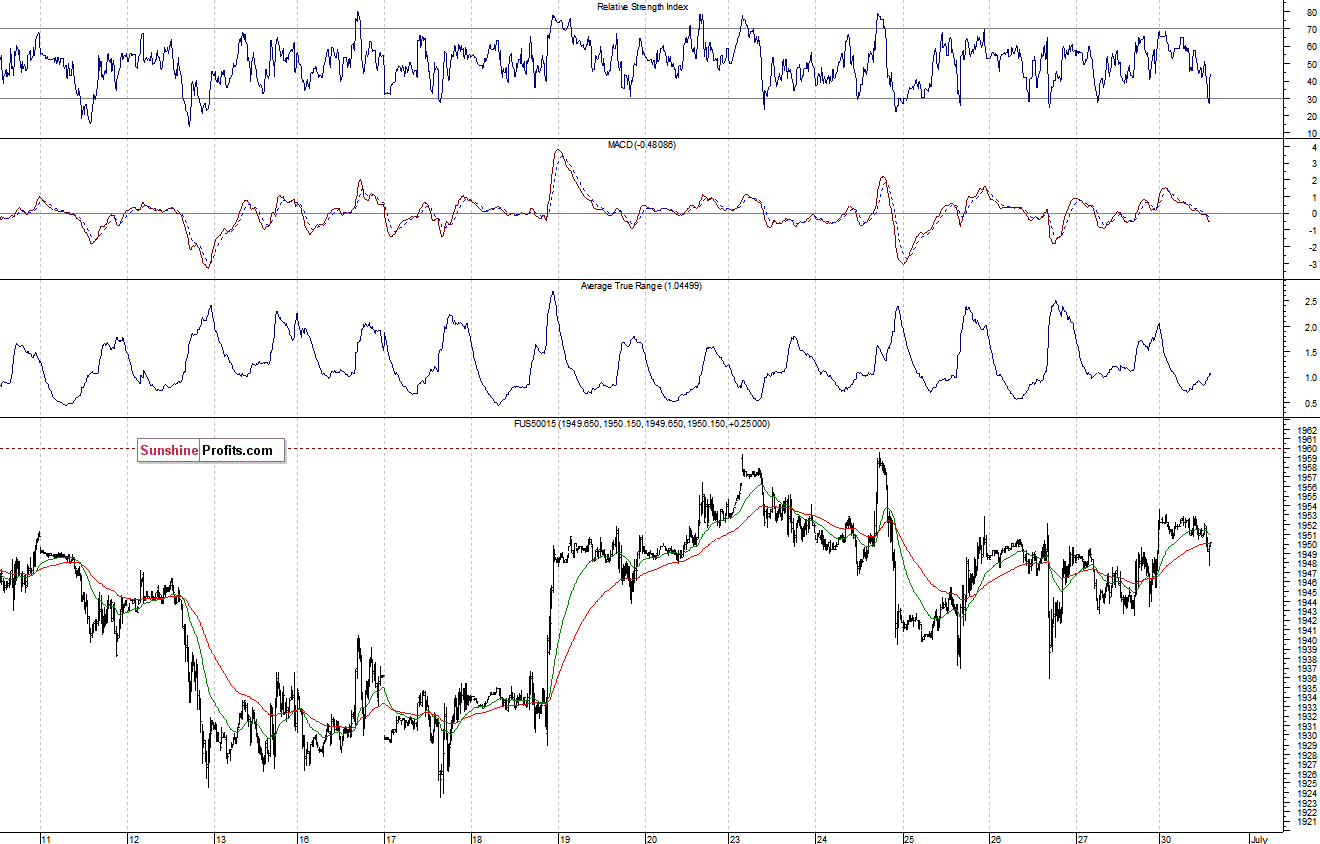
Expectations before the opening of today’s session are virtually flat. The European stock market indexes have been mixed between 0.0% and +0.3% so far. Investors will now wait for some economic data announcements: Chicago PMI at 9:45 a.m., Pending Home Sales at 10:00 a.m. The S&P 500 futures contract (CFD) extends its short-term consolidation, fluctuating below the level of resistance at around 1,960. The nearest important support level is at 1,935-1,940, marked by recent local lows, as we can see on the 15-minute chart:
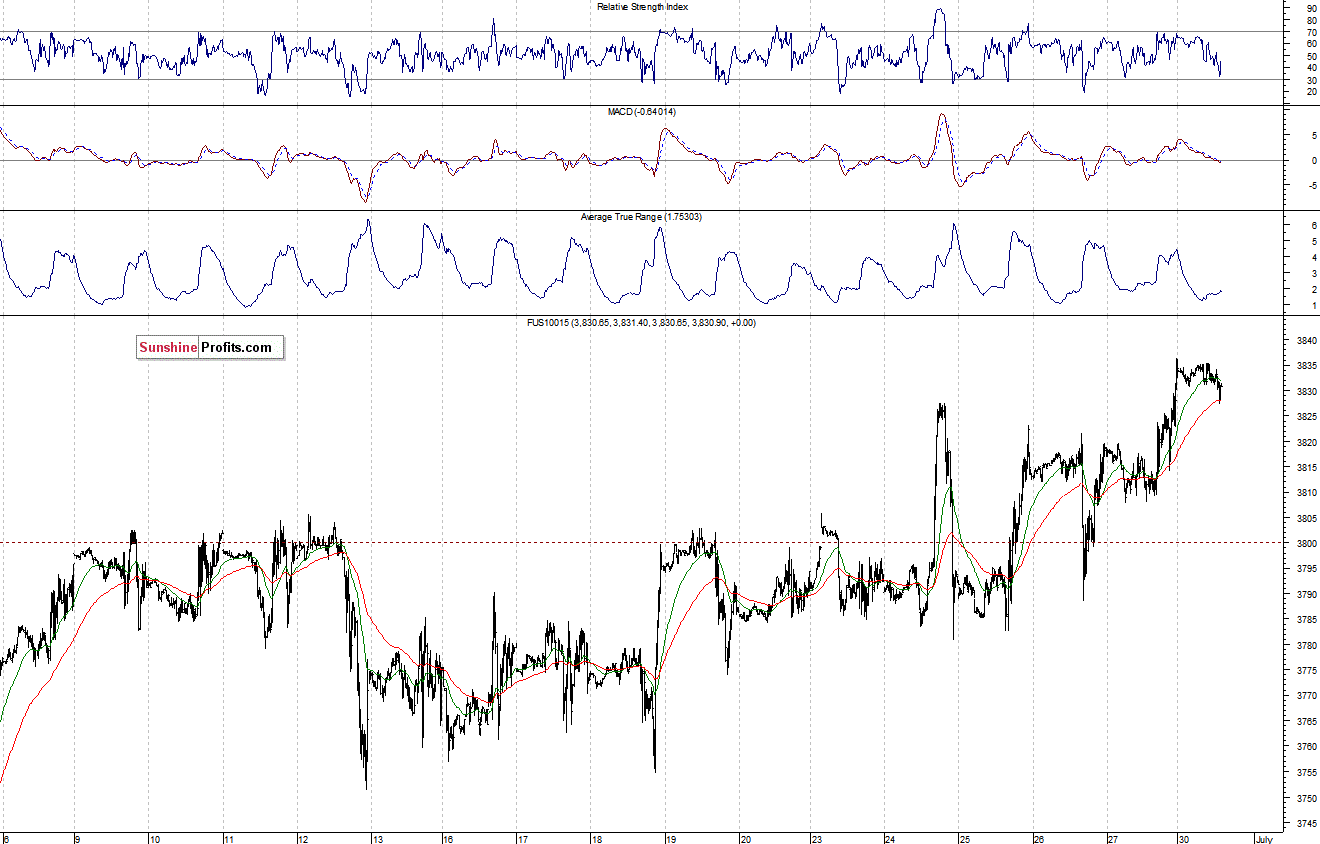
The technology Nasdaq 100 futures contract (CFD) is relatively stronger, as it trades close to long-term high. The level of support remains at the psychological 3,800, and the resistance level is at around 3,835-3,840, as the 15-minute chart shows:
Concluding, the broad stock market is in a short-term consolidation, following month-long uptrend. Will this uptrend continue? There is some risk of a downward correction, however, there have been no confirmed negative signals so far. We think that it is better to stay out of the stock market at this moment.
Thank you.
Paul Rejczak
Stock Trading Strategist
Stock Trading Alerts
