
Free Stock Trading Alert originally sent to subscribers on January 23, 2014, 5:39 AM.
Our intraday outlook is now bearish, and our short-term outlook remains neutral:
Intraday (next 24 hours) outlook: bearish
Short-term (next 1-2 weeks) outlook: neutral
Medium-term (next 1-3 months) outlook: neutral
Long-term outlook (next year): bullish
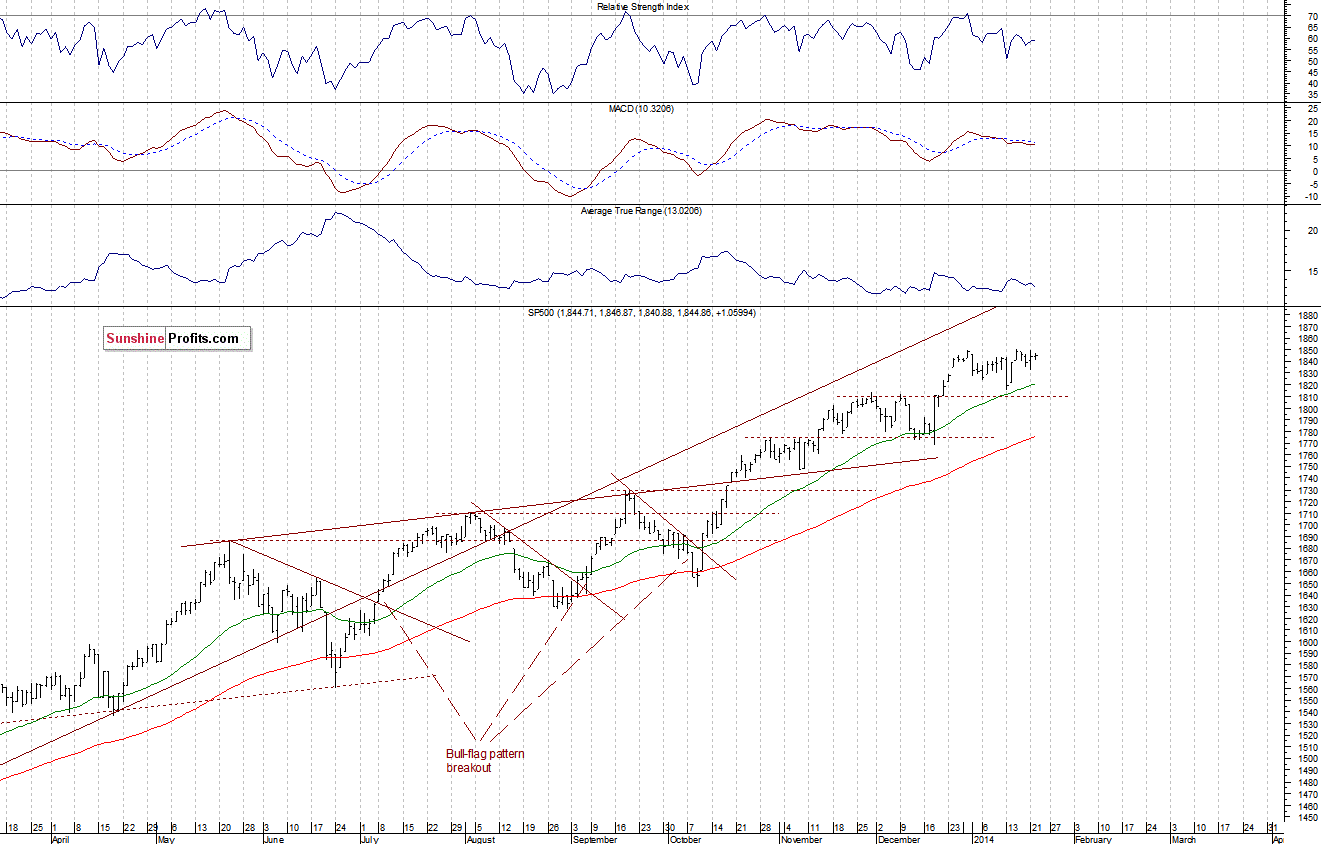
The major U.S. stock market indexes were mixed between -0.3% and +0.3% on Wednesday, extending their short-term consolidation. Investors continue to digest quarterly earnings releases. There is some uncertainty following recent move up. The S&P 500 index remains near Wednesday’s all-time high of 1,850.84. Thus, the nearest important resistance is at around 1,850. On the other hand, the support is at 1,810-1,815, marked by some of the local lows and the November-December consolidation. For now, it still looks like a flat correction within a long-term uptrend, as we can see on the daily chart:
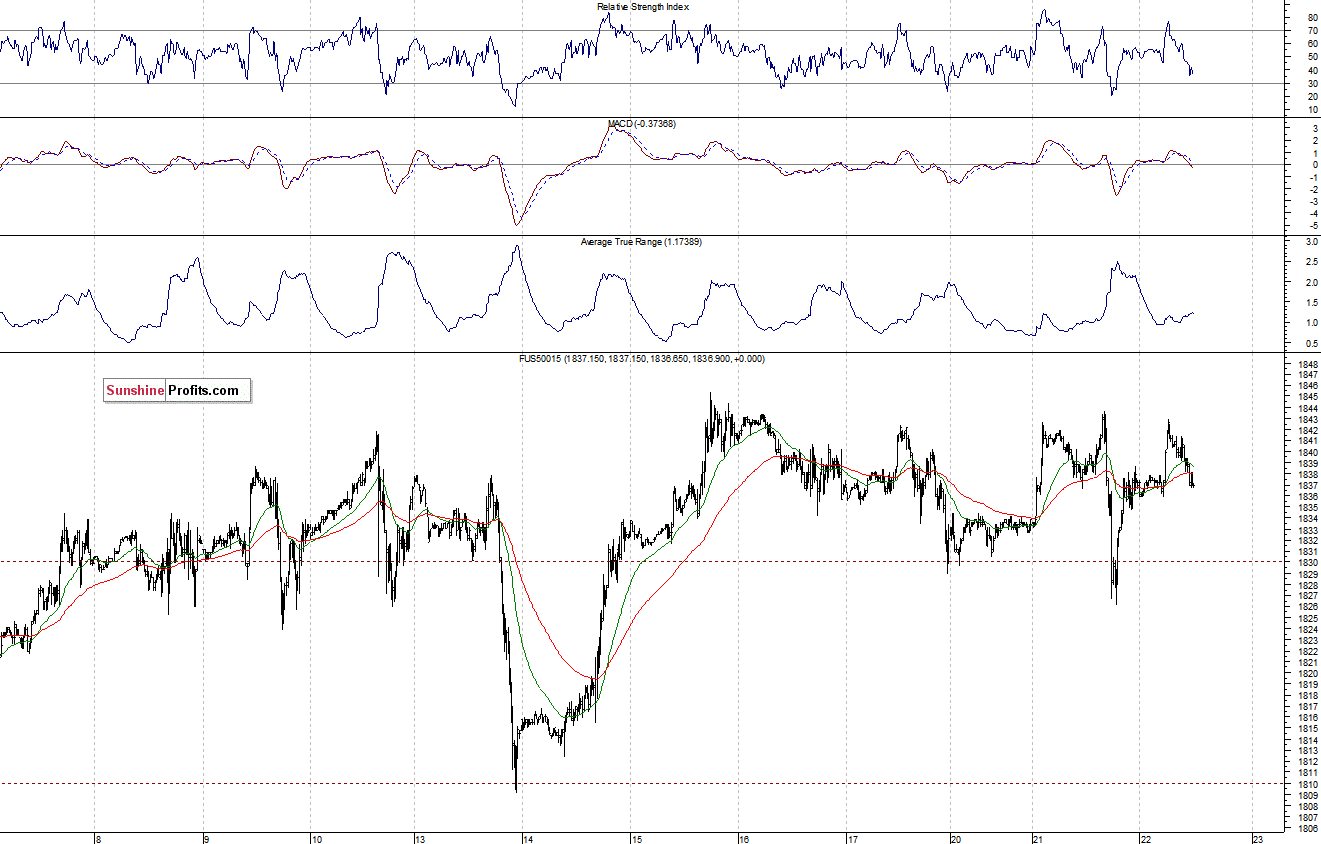
Expectations before the opening of today’s session are slightly negative, with index futures mixed between -0.3% and +0.1%. The main European stock market indexes have been mixed between -0.2% and +0.1% so far. Investors will now wait for some economic data announcements: Initial Claims at 8:30 a.m., FHFA Housing Price Index at 9:00 a.m., Existing Homes Prices and the Leading Indicators at 10:00 a.m. The S&P 500 futures contract (CFD) remains in a recent trading range, with the resistance at 1,840-1,845, and the nearest support at around 1,830. There is no clear short-term trend, as the 15-minute chart shows:
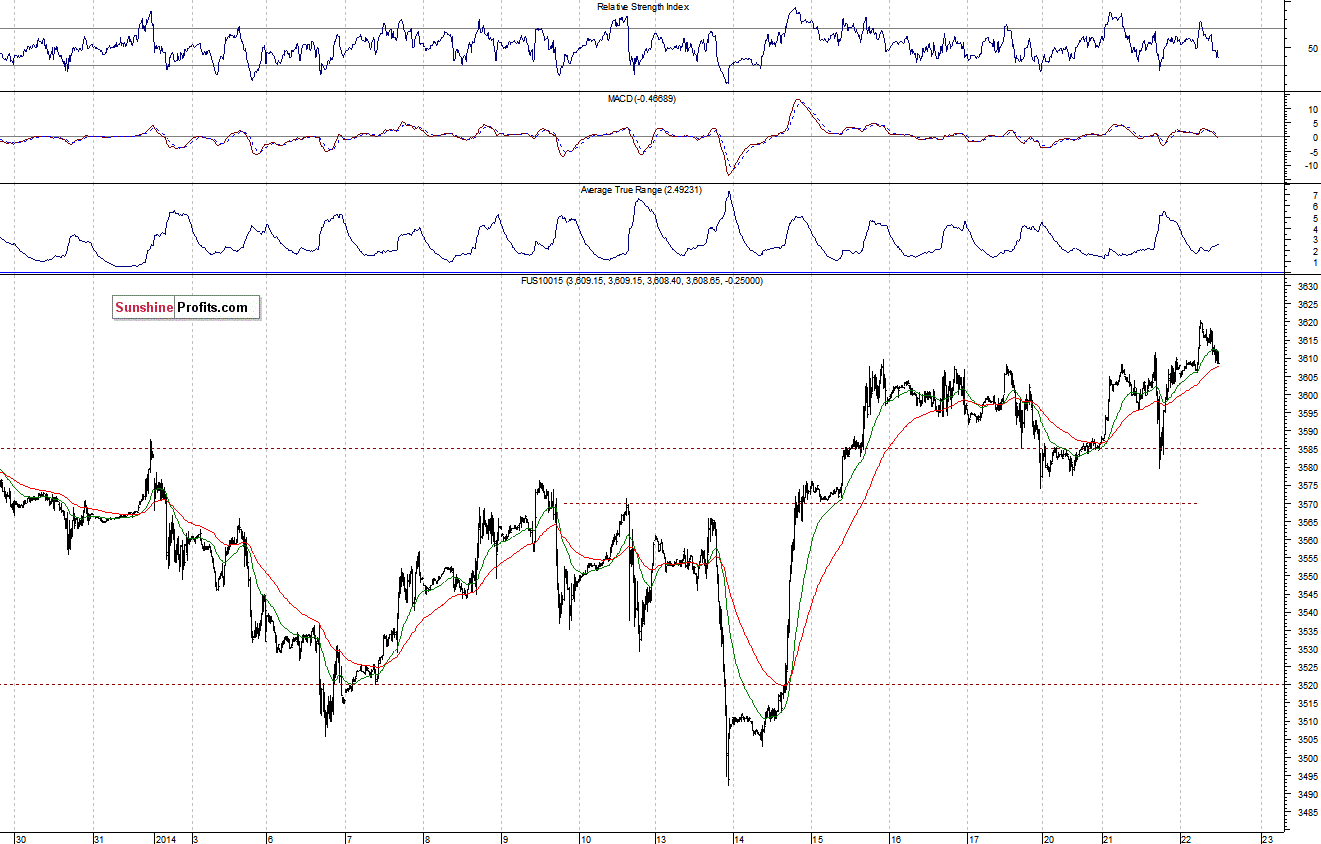
The technology stocks Nasdaq 100 futures contract (CFD) is relatively stronger than the broad market, as it continues its long-term uptrend. The nearest intraday resistance is at around 3,630-3,635. On the other hand, the support is at 3,600-3,610, marked by the recent consolidation:
Thank you.
Paul Rejczak
Stock Trading Strategist
Stock Trading Alerts
