
Yesterday, the price of crude oil edged up as investors worried about whether diplomatic efforts to eliminate Syria's chemical weapons would avert military action that could disrupt oil supplies from the Middle East. These diplomatic efforts intensified as Russia warned that a U.S. strike could unleash extremist attacks and carry the country's bitter civil war beyond Syria's borders.
According to Reuters, Russia's parliament urged the United States not to strike Syria, saying in a unanimous declaration that military action could be a "crime against the Syrian people." The Duma expressed support for Russia's proposal to place Syria's chemical arsenal under international control, which Putin said on Tuesday would only succeed if the United States and its allies abandoned plans for possible military action. U.S. lawmakers said the Senate could start voting as soon as next week on a resolution to authorize military force if efforts to find a diplomatic solution fail.
At this moment, it seems that this small bounce up in crude oil prices ended a two-day slide that came as diplomatic efforts quelled fears of a military strike against Syria.
What’s next? Will crude oil reach higher levels? Or maybe it will drop further? Let’s take a look at the charts and check what the current outlook for light crude is (charts courtesy by http://stockcharts.com).
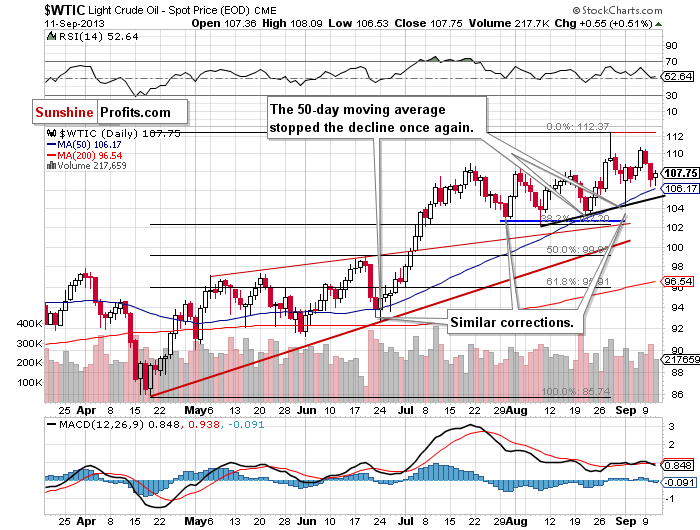
On the above chart we see that the situation has deteriorated since our last Oil Update was published. Since the beginning of the week the price of light crude has dropped and reached below $107 per barrel on Tuesday. Yesterday, oil bears tried to push the price below the Tuesday low, but this attempt failed and crude oil rebounded above $107.
As you see on the daily chart, slightly below the Tuesday and Wednesday lows there is the 50-day moving average, which stopped the decline in June and, again, at the end of August (the moving average was not even reached). In both previous cases this moving average encouraged buyers to act, which resulted in sharp rallies in the following days. We also saw similar price action at the beginning of the previous week. If history repeats itself, we will likely see an upward move in the coming days.
At this point it’s worth mentioning that the current correction is still shallow and smaller than the previous one (from the August 28 top to the September 3 low), which is a bullish factor. What’s interesting, even if the price of crude oil drops below the last Tuesday’s low (to about $103), both corrections will be similar and the uptrend will not be threatened.
Where are the nearest support levels?
The first is the 50-day moving average (currently at $106.17). The second one is the rising line based on the August lows (slightly above $105). The third one is the last Tuesday’s low at $104.21. The next one is a zone (between $102.22 and $103.50) based on the bottom of the previous corrective move (the August 21 low) and the August low. There is also the 38.2% Fibonacci retracement level, which reinforces this support zone.
Once we know the current situation from the daily chart, let’s zoom in on our picture of the oil market and see the 4-hour chart.
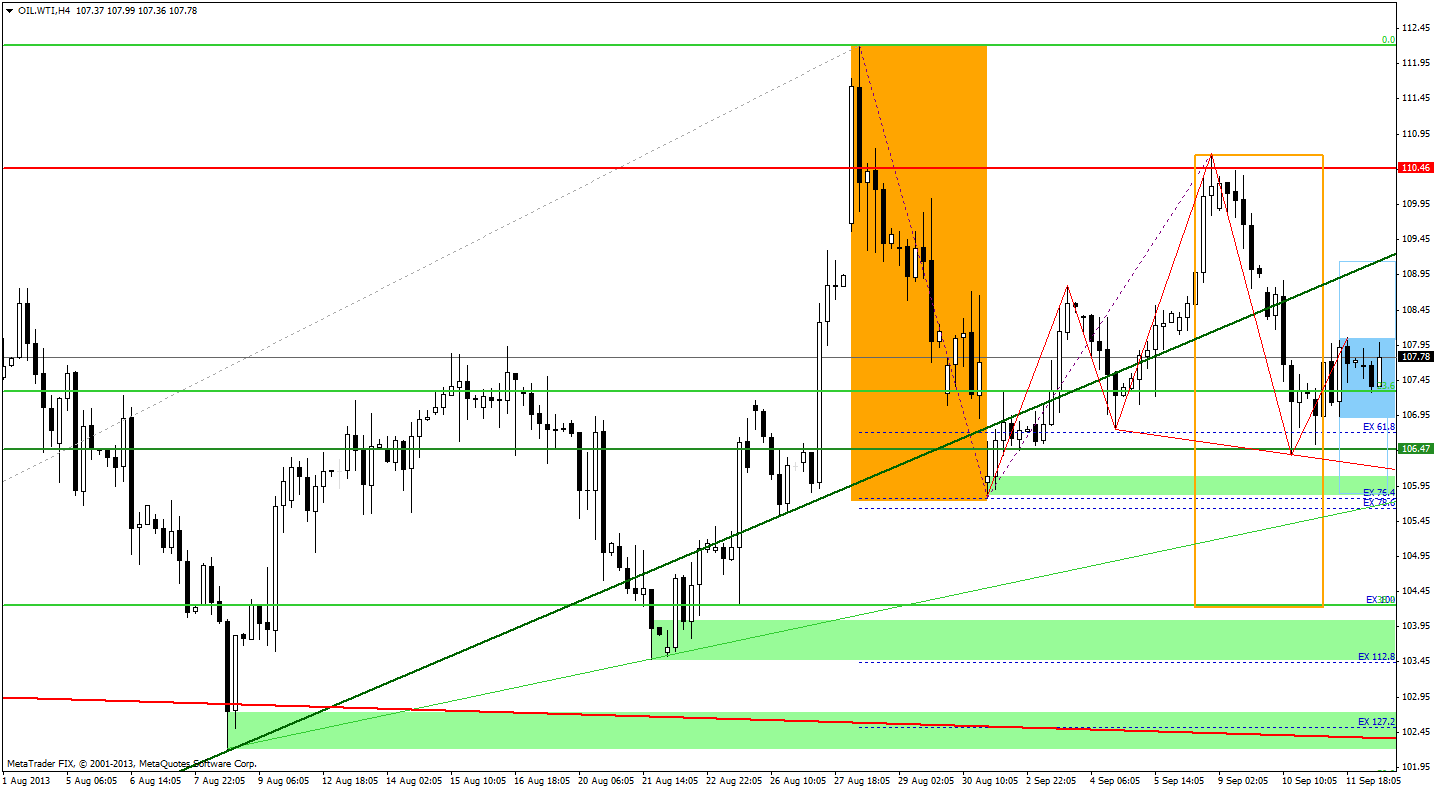
On the above chart we see that that recent decline took the price of light crude slightly below the September 4 low. In this way, the price of light crude dropped below the rising support line based on the June 24 and August 8 lows, which serves as resistance now.
When we take a closer look at the chart, we see the Fibonacci price projections (marked in purple) based on the August 28 top, the September low and the September peak. The recent downward move reached the 61.8 ratio, which means that the current correction is still much smaller than the previous one. Even if the price of light crude drops from here to the next ratio it will only reach the September low. This support level may stop further declines, however, if it is broken, the next price target for sellers will be around the 100 ratio. Please note that this ratio intersects with the 38.2% Fibonacci retracement level, which together form a strong support zone.
Taking the above into account, we see that even if oil bears show their claws and trigger further declines, the short-term outlook will still remain bullish, because the current correction and the previous one will still be similar.
At this point, it’s worth noting that a consolidation has formed in the recent hours. That’s why we should consider two scenarios. If the buyers do not give up and push the price above the yesterday’s high, crude oil will likely climb to at least the previously-broken rising support line based on the June 24 and August 8 lows. However, if they fail and the price of light crude drops below the bottom of the consolidation, we will likely see a decline to the September low.
Summing up, although there was a downward move, which took the price of light crude below $107, technically, the short-term outlook is still bullish. The uptrend is not threatened at the moment, because the recent decline was shallow and smaller than the previous one.
Thank you,
Nadia Simmons
