
Trading position (short-term): No significant improvement and no positions.
On Friday, crude oil lost 0.07% after mixed U.S. economic data. Despite this fact, light crude climbed 1.29% in the previous week and this was the first weekly gain in three weeks.
On Friday, better-than-expected data on U.S. housing starts pushed the price of light crude higher as oil investors viewed the numbers as another indication of a more robust U.S. economy.
U.S. housing starts dropped 9.8% and fell to 999,000 units last month from an upwardly revised 1.11 million in November, however, better than expectations for a decline to 990,000 units. Meanwhile, separately official data showed that U.S. building permits declined 3% to 986,000 million units in December from 1.017 million units the previous month (while analysts had expected building permits to slip to 1.015 million units last month), but held close to November’s five year highs of 1.01 million units.
Although these better- than-expected numbers fueled expectations that the U.S. economy will demand more fuel and energy, crude oil gave up earlier gains after the preliminary Thomson Reuters/University of Michigan consumer sentiment index fell to 80.4 in January from 82.5 in December (missing expectations for a rise to 83.5).
Having discussed the above, let’s move on to the technical changes in the crude oil market (charts courtesy of http://stockcharts.com.)
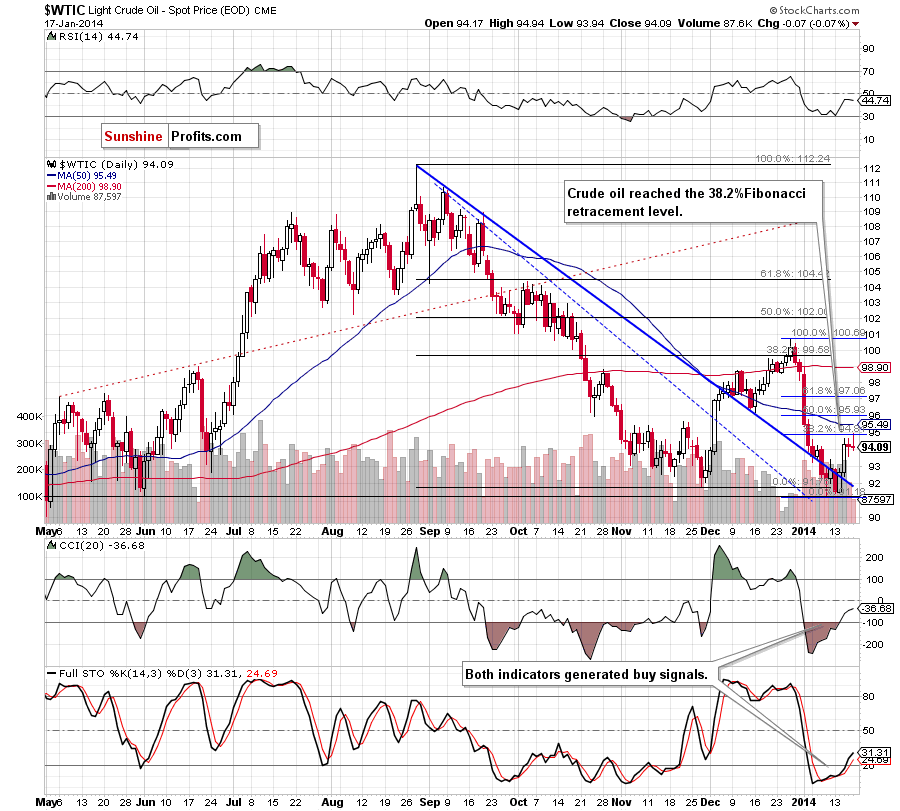
In our last Oil Trading Alert, we wrote: another attempt to move above the nearest resistance level (38.2% Fibonacci retracement) should not surprise us.
Looking at the above chart, we see that there was such price action on Friday. After the market open, oil bulls pushed the price higher and reached the 38.2% Fibonacci retracement level. However, as it turned out, this improvement was only temporary and light crude gave up the gains in the following hours, closing day slightly above $94.
As you can see on the daily chart, Friday’s drop (similarly to Thursday’s decrease) materialized on tiny volume, so this downswing also seems to be insignificant. Additionally, buy signals generated by the indicators remain in place, supporting oil bulls.
From today’s point of view, the situation hasn’t changed much and the short-term outlook remains mixed. On one hand, if the buyers successfully push the price above this level, we will likely see further improvement and the first upside target will be the previously-broken 50-day moving average. On the other hand, this resistance may encourage sellers to act and result in another attempt to move lower in the coming day (or days).
We should keep in mind that despite Friday’s increase, crude oil still remains below the previously-broken medium-term support/resistance line. From this perspective, it seems justified to wait for an invalidation of the breakdown before opening long positions.
Having discussed the current situation in light crude, let’s take a look at WTI Crude Oil (the CFD).
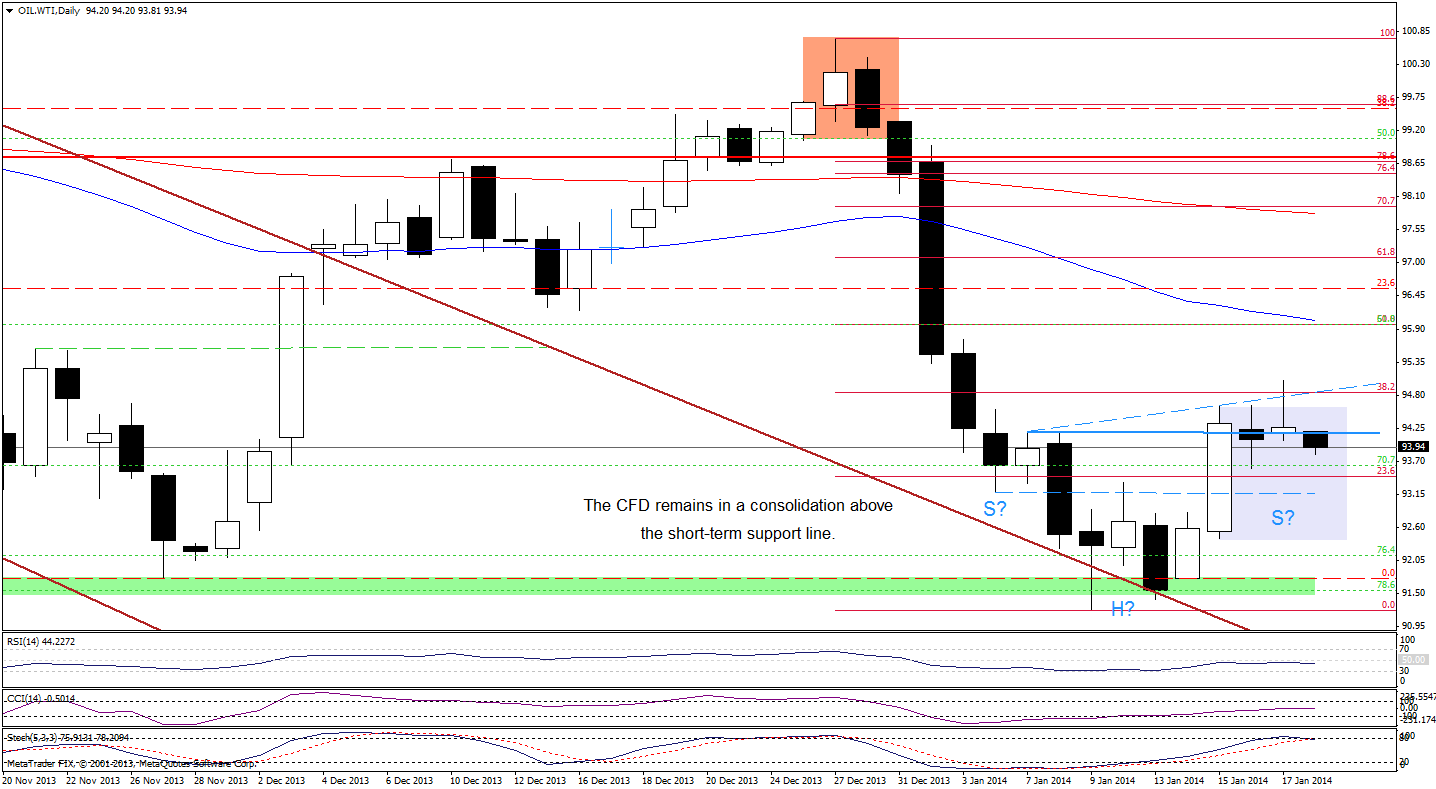
On the above chart, we see that although the CFD broke above Wednesday’s high and the blue dashed line, oil bulls only managed to push WTI Crude Oil slightly above the 38.2% Fibonacci retracement level. This strong resistance encouraged sellers to act and triggered a decline, which took the price below the previously-broken resistance level (marked with the blue line) earlier today. This is not a positive signal – especially when we factor in a sell signal generated by the Stochastic Oscillator. However, as long as the CFD remains slightly below the upper line of a consolidation range, another attempt to move higher should not surprise us.
Once we know the above, let’s take a look at the NYSE Arca Oil Index (XOI) chart.
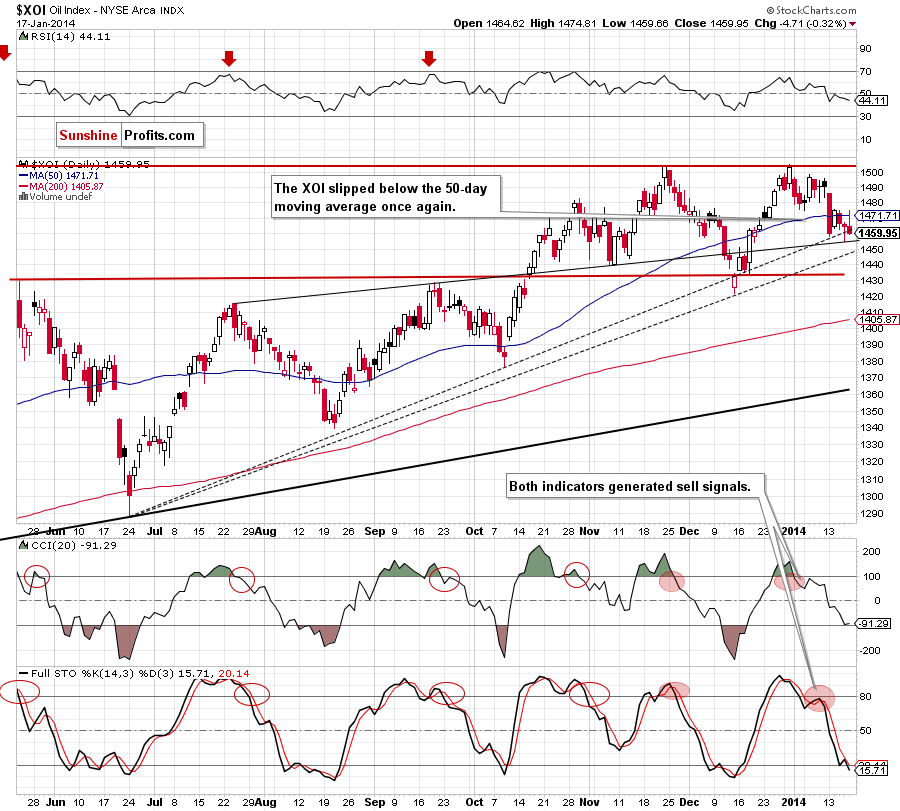
In our previous Oil Trading Alert, we wrote the following:
(…) the 61.8% Fibonacci retracement level (…) intersects with the upper line of the rising wedge, which is also the medium-term support line. Therefore, such strong support could encourage buyers to act. In this case, the first upside target will be the previously-broken 50-day moving average and Tuesday’s high at 1,475.
On the above chart, we see that the oil stock index moved higher on Friday and reached its first upside target. Despite this increase, the XOI quickly gave up the gains and declined below the 50-day moving average once again. This is not a positive signal – especially when we take into account the fact that sell signals generated by the indicators remain in place. Therefore, another move lower should not surprise us. Please note that the nearest support is Thursday’s low, which intersects with the 61.8% Fibonacci retracement level and the upper line of the rising wedge (the medium-term support line). If it holds, we may see another rebound, but if this strong support is broken, the next downside target will be the medium-term rising support line based on the June and December lows (currently around 1,445).
Summing up, although crude oil reached the 38.2% Fibonacci retracement level and hit a fresh two-week high, it still remains below the previously-broken medium-term support/resistance line. Taking this important fact into account, it seems justified to wait for an invalidation of the breakdown before opening long positions. Nevertheless, we should keep in mind that the current corrective move is quite shallow and buy signals generated by the indicators remain in place, which may encourage oil bulls to push the price higher once again.
Very short-term outlook: mixed
Short-term outlook: mixed
MT outlook: mixed
LT outlook: mixed
Trading position (short-term): We do not suggest opening any positions at the moment. We will keep you informed should anything change, or should we see a confirmation/invalidation of the above.
Thank you.
Nadia Simmons
Forex & Oil Trading Strategist
Forex Trading Alerts
Oil Investment Updates
Oil Trading Alerts
