

Oil Trading Alert originally sent to subscribers on August 22, 2016, 9:50 AM.
Trading position (short-term; our opinion): No positions are justified from the risk/reward perspective.
Although U.S. dollar moved higher on Friday, crude oil extended gains and closed the day above $49 for the first time since the beginning of Jul. Thanks to this increase light crude gained 0.45% and approached a resistance zone. Will it encourage oil bears o act in the coming week?
Let’s take a look at the charts and find out what we can infer from them (charts courtesy of http://stockcharts.com).
On Friday, we wrote the following:
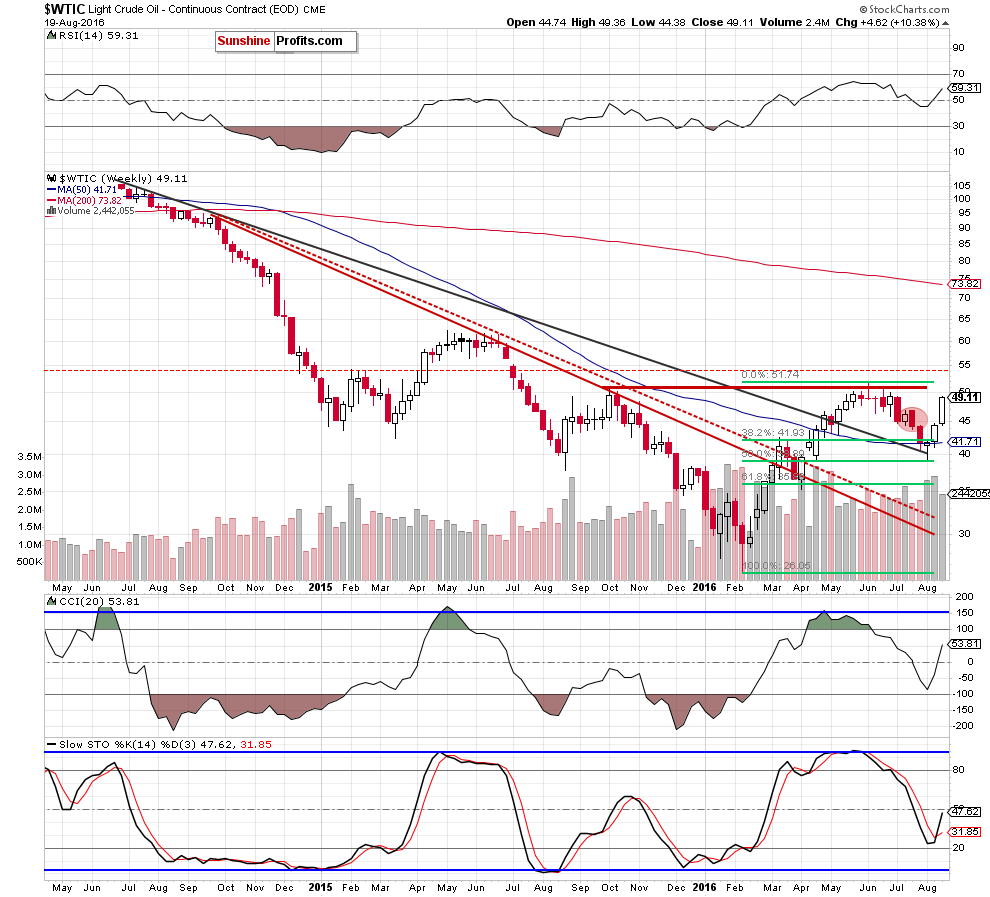
(…) this week’s rebound took crude oil above $46.84, which means that the bearish engulfing pattern (marked with red) was invalidated, which is a positive signal (especially if we see a weekly closure above this level, which is very likely, looking at the current price of the commodity). Additionally the CCI reversed and the Stochastic Oscillator generated buy signal, which increases the probability of further improvement.
From today’s point of view, we see that the situation developed in line with the above scenario and crude oil closed the week above $49, invalidating the bearish engulfing pattern. Taking this positive event into account and combining it with buy signals generated by the indicators, it sees that the commodity will extend gains in the coming week. Nevertheless, when we take a closer look at the size of volume that accompanied last week’s increase we’ll see that the move materialized on smaller volume than earlier upswings, which suggests that oil bulls may begin to lose their strength.
Are there any other technical factors that could encourage oil bears to act? Let’s examine the very short-term chart and find out.
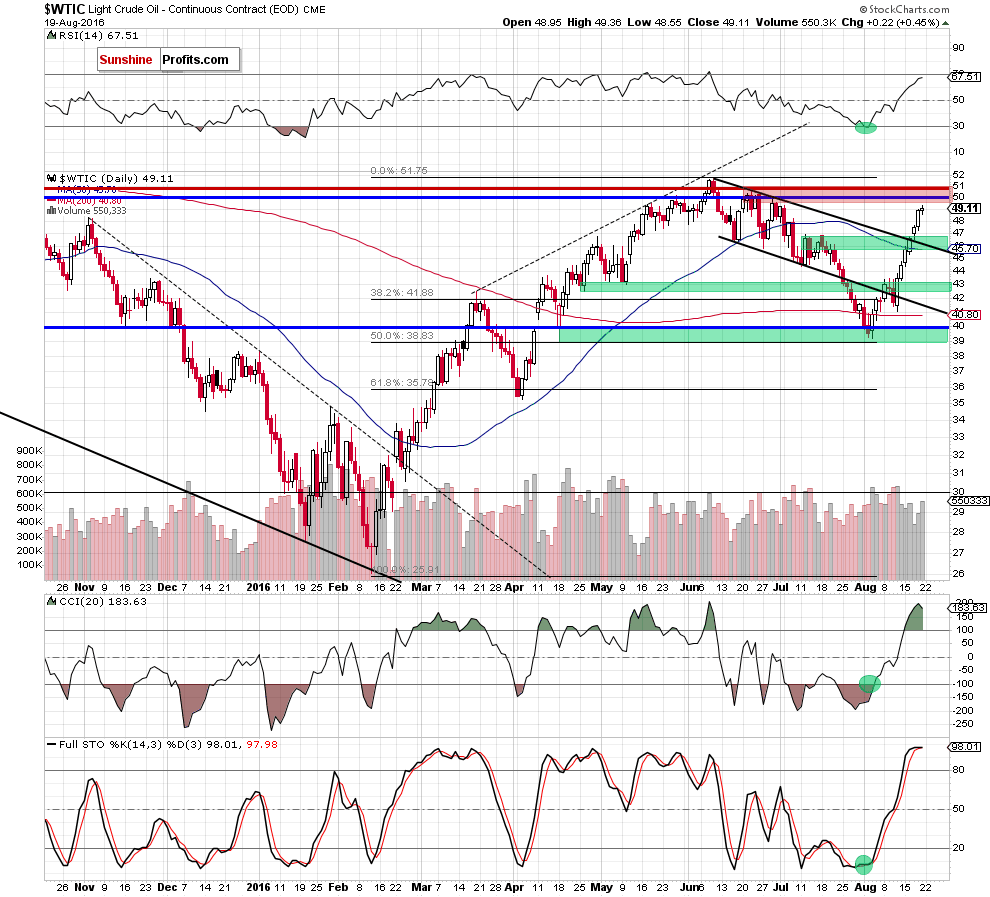
On Friday, crude oil moved slightly higher, which approached the commodity to the red resistance zone created by the Jun highs and reinforced by the barrier of $50. Additionally, the RSI approached the level of 70, the CCI moved little lower, while the Stochastic Oscillator is not only significantly overbought, but also very close to generating a sell signal, which increases the probability of a pullback in the coming week.
If this is the case, and light crude declines from current levels, we may see a correction to around $46.84 or even to the previously-broken upper border of the black declining trend channel (currently at $46.24) in the following days.
Nevertheless, to have a more complete picture of crude oil, we decided to take a look at the oil-to-gold ratio.
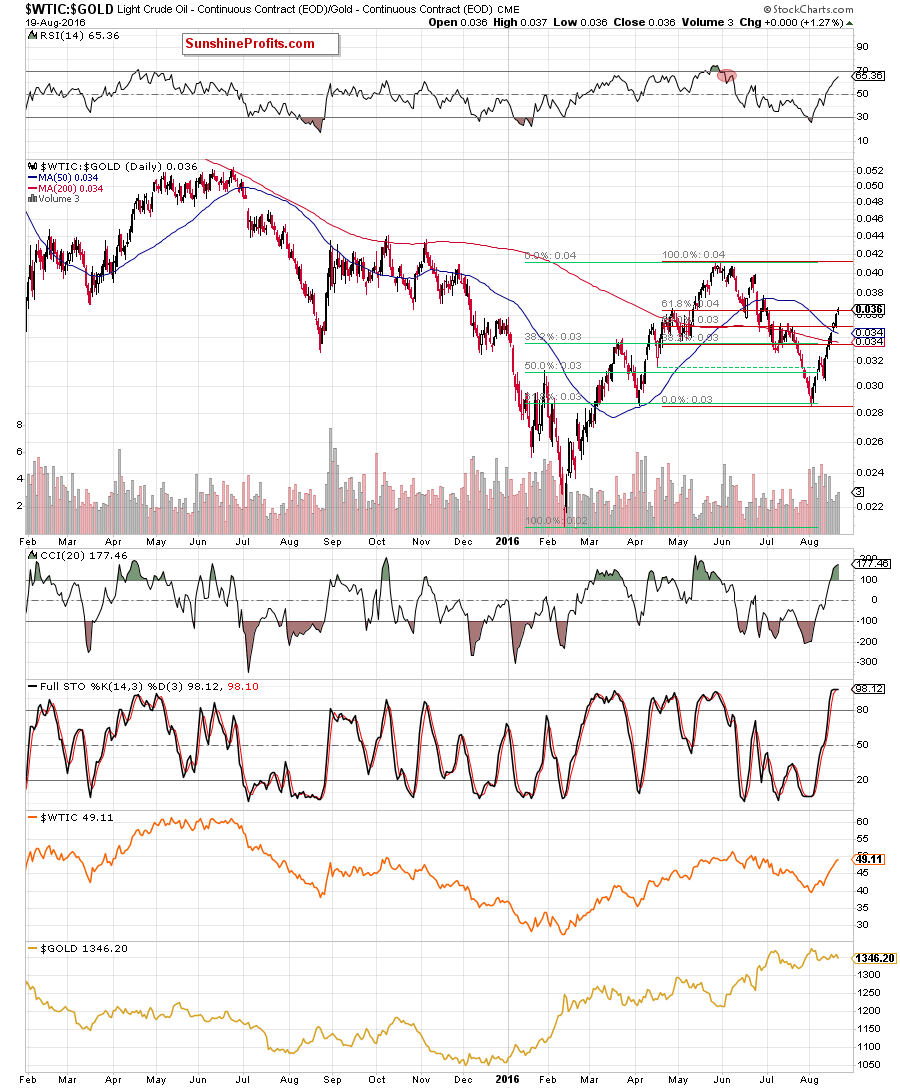
From this perspective, we see that the ratio moved higher in the previous week, which resulted in a climb to the 61.8% Fibonacci retracement based on the Jun-Aug downward move. Although the ratio increased above this resistance level on Friday, we saw a daily closure below it, which means an invalidation of earlier small breakout. On top of that, the CCI increased to the highest levels since May, while the Stochastic Oscillator almost generated a sell signal. Connecting the dots, we think that reversal and lower values of the ratio are just around the corner. If this is the case, such price action will likely translate into a pullback in crude oil in the coming days.
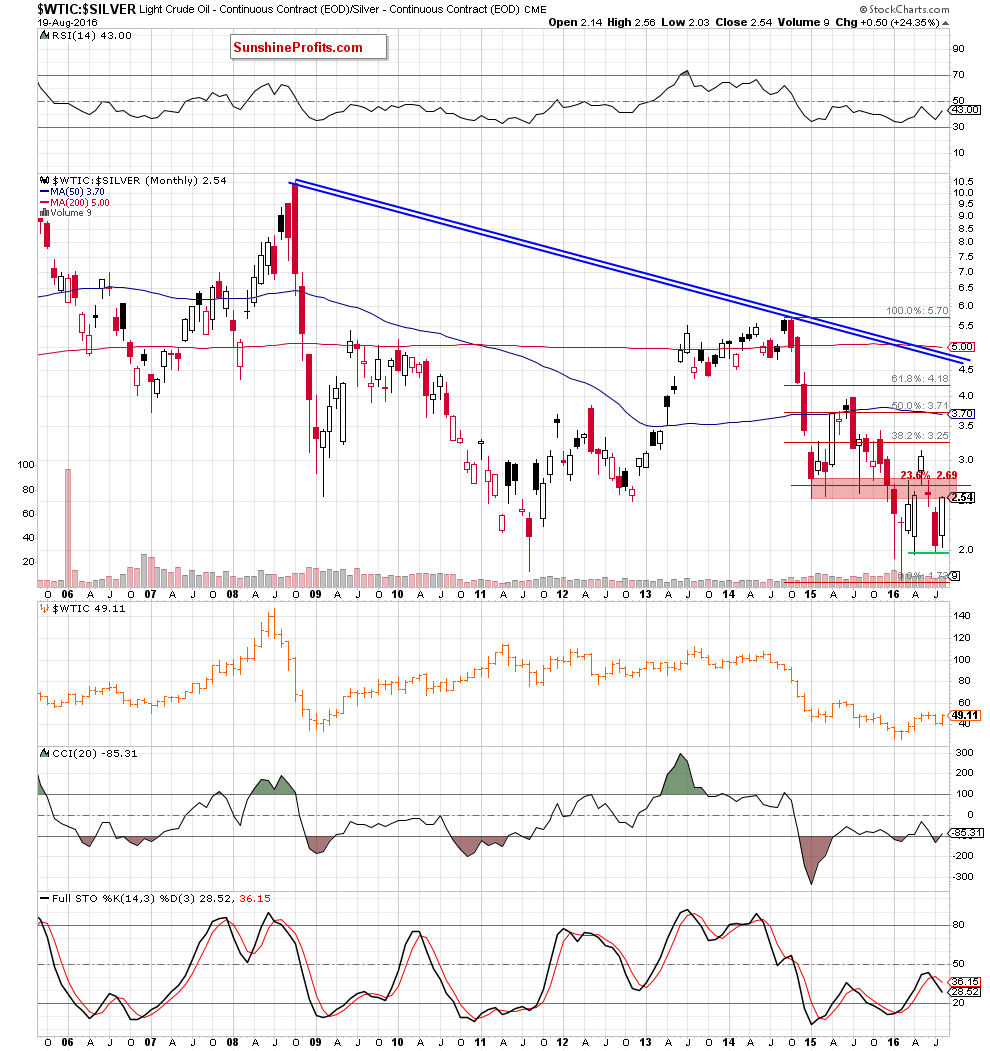
Having said the above, let’s examine the relation between crude oil and silver.
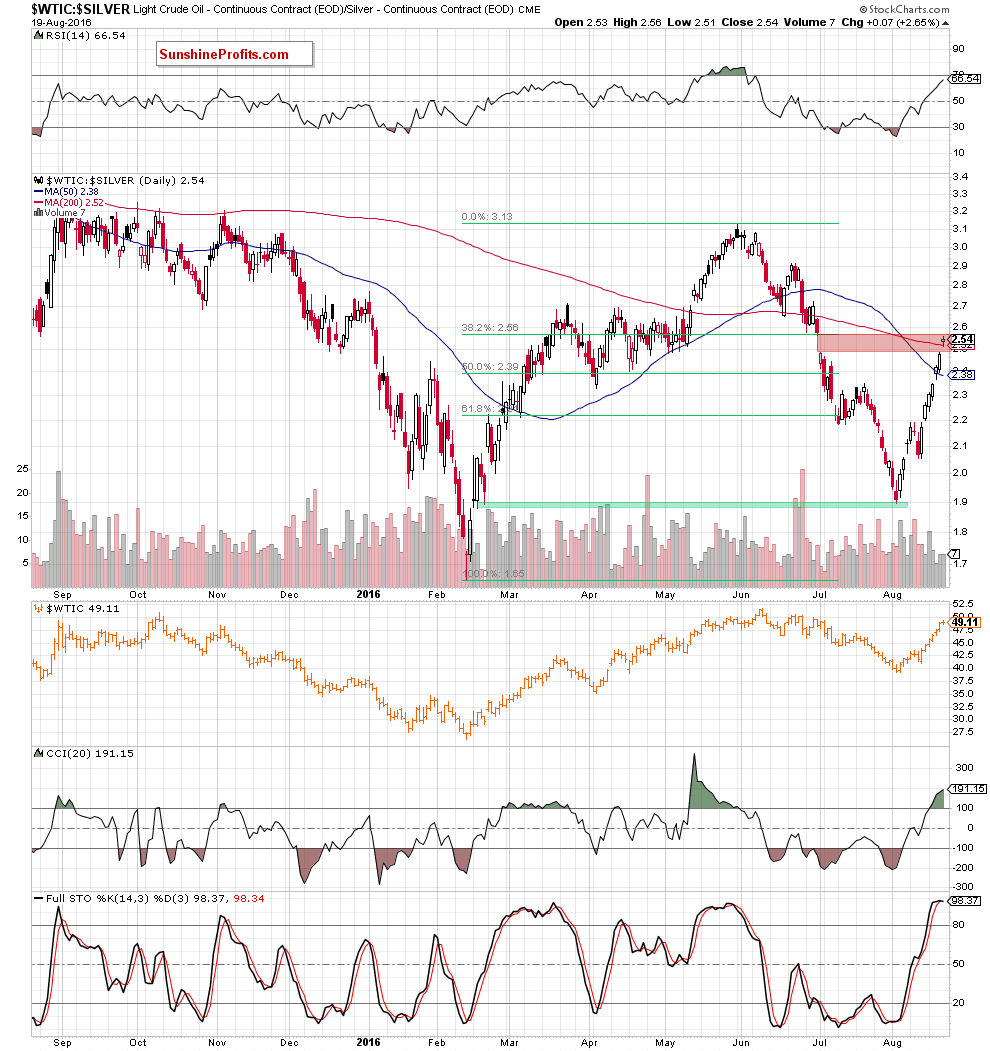
Looking at the daily chart, we see that the ratio reached the red resistance gap, which n combination with the current position of the indicators also suggests reversal and declines in the coming week. On top of that, the ratio also reached the red resistance zone marked on the chart below.
Taking all the above into account, we think that closing long positions and taking profits off the table is the best investment decision at the moment.
Summing up, crude oil moved higher once again and approached important resistance zone, which in combination with the proximity to the barrier of $50, the current position of the daily indicators and situation in the above-mentioned ratios increases significantly the probability of a bigger pullback in the coming days. Therefore, in our opinion, closing long positions and taking profits off the table is the best investment decision at the moment.
Very short-term outlook: mixed with bearish bias
Short-term outlook: mixed
MT outlook: mixed
LT outlook: mixed
Trading position (short-term; our opinion): No positions are justified from the risk/reward perspective. We will keep you – our subscribers – informed should anything change.
Thank you.
Nadia Simmons
Forex & Oil Trading Strategist
Przemyslaw Radomski, CFA
Founder, Editor-in-chief, Gold & Silver Fund Manager
Gold & Silver Trading Alerts
Forex Trading Alerts
Oil Investment Updates
Oil Trading Alerts
