

Oil Trading Alert originally sent to subscribers on June 6, 2016, 10:00 AM.
Trading position (short-term; our opinion): No positions are justified from the risk/reward perspective.
On Friday, crude oil lost 0.33% after Baker Hughes’ report. As a result, light crude closed the day under important support line. Is it enough to trigger further declines?
On Friday, Baker Hughes’ report showed that U.S. oil rigs increased by 9 to 325 for the week ending May 27, which was the largest weekly increase since last Dec. Thanks to this news, light crude slipped under $49 and closed the day under important support line. Is it enough to trigger further declines? Let’s examine charts below and find out what can we infer from them (charts courtesy of http://stockcharts.com).
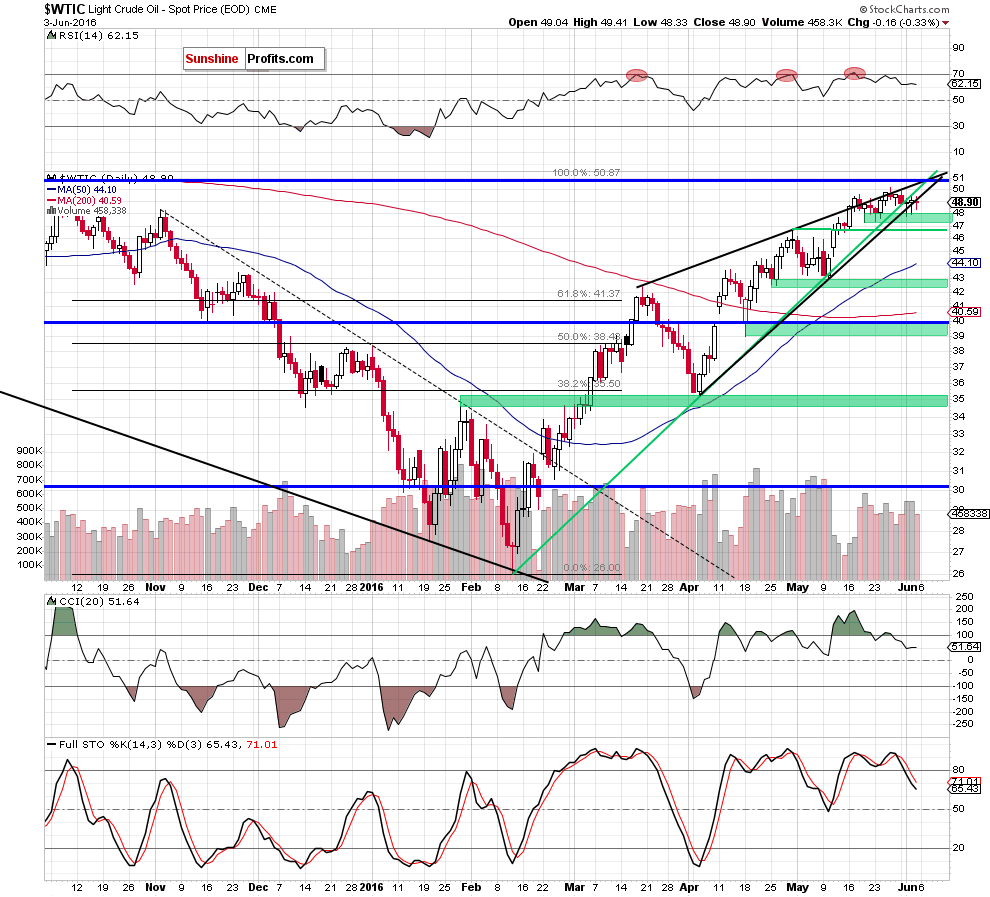
The first thing that catches the eye on the daily chart is a breakdown under the medium-term green support line and the lower border of the black rising wedge. Although this is a negative signal, which suggests further deterioration, the commodity is consolidating above the first green support zone created by the May 19 and May 23 lows. Therefore, in our opinion, acceleration of declines would be more likely and reliable after a drop below this support area.
If this is the case, and we see such price action, the initial downside target would be around $39.28, where the size of the downward move will correspond to the height of the black rising wedge (in this area is also the mid-Apr low). This scenario is also reinforced by the current position of all indicators as sell signals continue to support oil bears and lower prices of light crude.
Before we summarize today’s alert, let’s take a closer look at the non-USD (WTIC:UDN ratio) chart of crude oil once again. As a reminder, UDN is the symbol for the PowerShares DB US Dollar Index Bearish Fund, which moves in the exact opposite direction to the USD Index. Since the USD Index is a weighted average of the dollar's exchange rates with world's most important currencies, the WTIC:UDN ratio displays the value of crude oil priced in "other currencies".
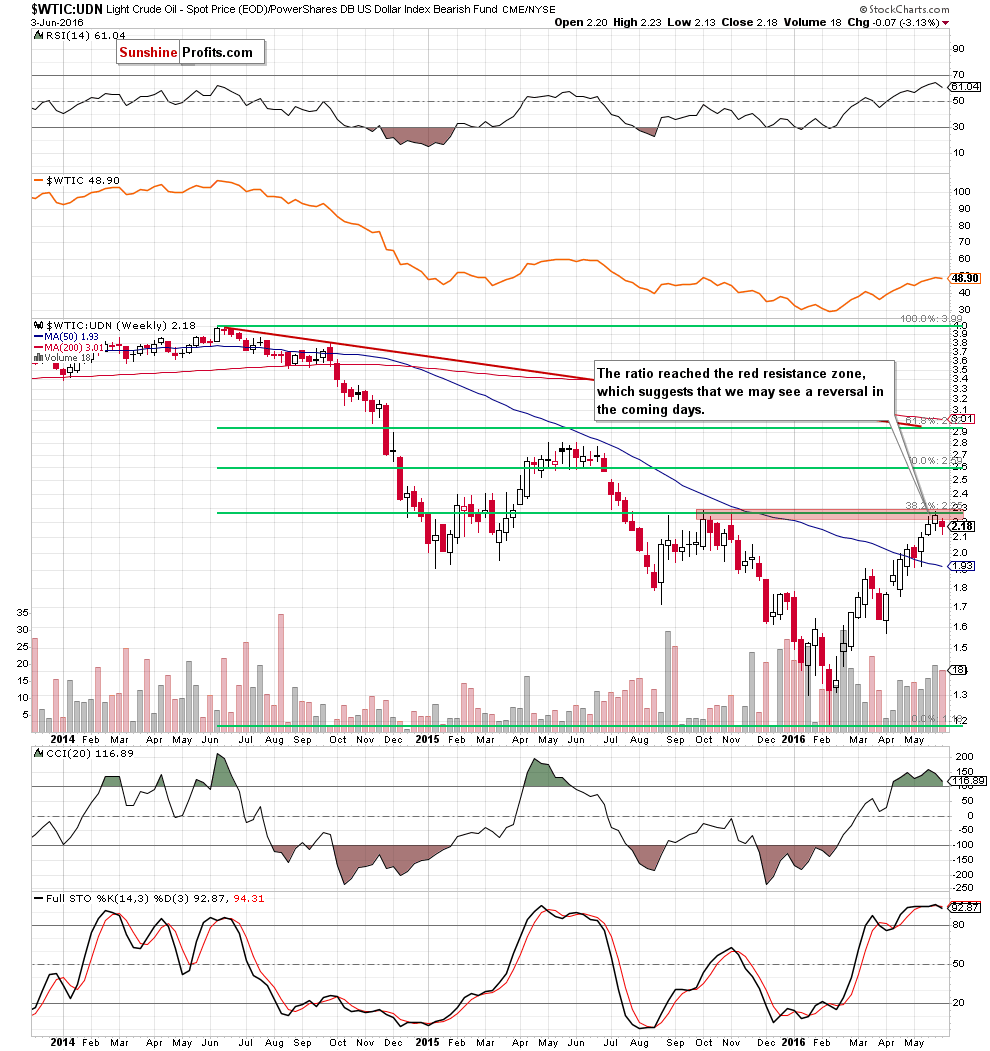
Looking at the weekly chart, we see that the red resistance zone (created by the Oct and Nov highs and the 38.2% Fibonacci retracement based on the entire Jun 2014-Feb 2016 downward move) stopped oil bulls and triggered a pullback in the previous week. Taking into account the proximity to this strong resistance area and the current position of the indicators (the Stochastic Oscillator generated a sell signal, while the CCI is close to doing the same), we think that further deterioration is just around the corner. If this is the case, and the ratio extends declines from here, well also see lower prices of crude oil in the following days.
Summing up, crude oil moved lower in the previous week and dropped below the medium-term green support line and the lower border of the black rising wedge, which is a negative signal that suggests further deterioration and a test of the barrier of $40 in the coming week.
Very short-term outlook: mixed with bearish bias
Short-term outlook: mixed with bearish bias
MT outlook: mixed
LT outlook: mixed
Trading position (short-term; our opinion): No positions are justified from the risk/reward perspective. We will keep you – our subscribers – informed should anything change.
Thank you.
Nadia Simmons
Forex & Oil Trading Strategist
Przemyslaw Radomski, CFA
Founder, Editor-in-chief
Gold & Silver Trading Alerts
Forex Trading Alerts
Oil Investment Updates
Oil Trading Alerts
