

Oil Trading Alert originally sent to subscribers on March 9, 2016, 6:29 AM.
Trading position (short-term; our opinion): No positions are justified from the risk/reward perspective.
On Tuesday, crude oil lost 4.34% as bearish news from Kuwait and Goldman Sachs warnings weighed on investors’ sentiment. Thanks to these circumstances, light crude came back under the Aug low and invalidated earlier breakout above the Jan highs. What does it mean for the commodity?
Although crude oil moved higher after the market’s open, hitting a fresh March high, Kuwait oil minister’s comments eased optimism among oil investors. Anas al-Saleh said that Kuwait would agree to an output freeze only if all major producers take part - including Iran. Additionally, Goldman Sachs warned in its report that a recent upward move in commodities could be premature and not sustainable in the long run. Thanks to these circumstances, light crude came back under the Aug low and invalidated earlier breakout above the Jan highs. What does it mean for the commodity? Let’s take a look at the charts and find out (charts courtesy of http://stockcharts.com).
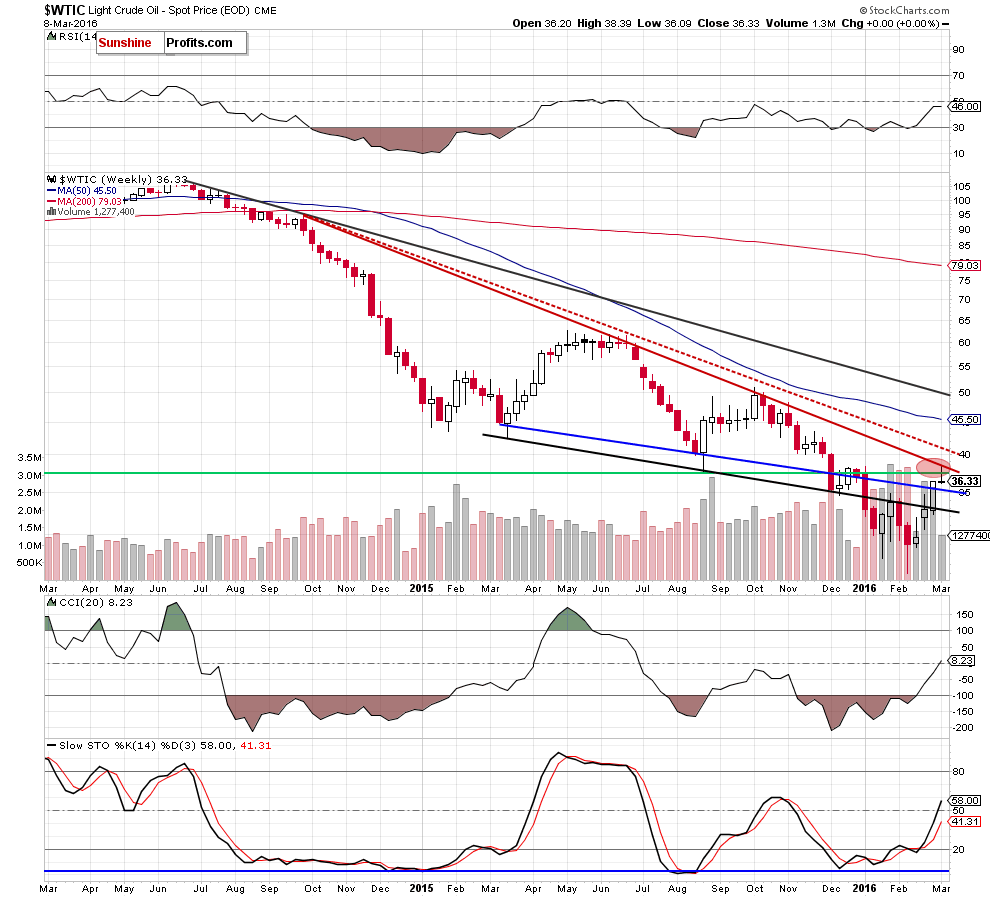
Looking at the weekly chart, we see that the red declining resistance line (based on the Sep 29, Jun 22 and Oct 12 weekly closing prices) stopped further improvement and triggered a pullback, which took the commodity under the Aug low once again.
How did this move affect the very short-term picture? Let’s check.
Quoting our previous Oil Trading Alert:
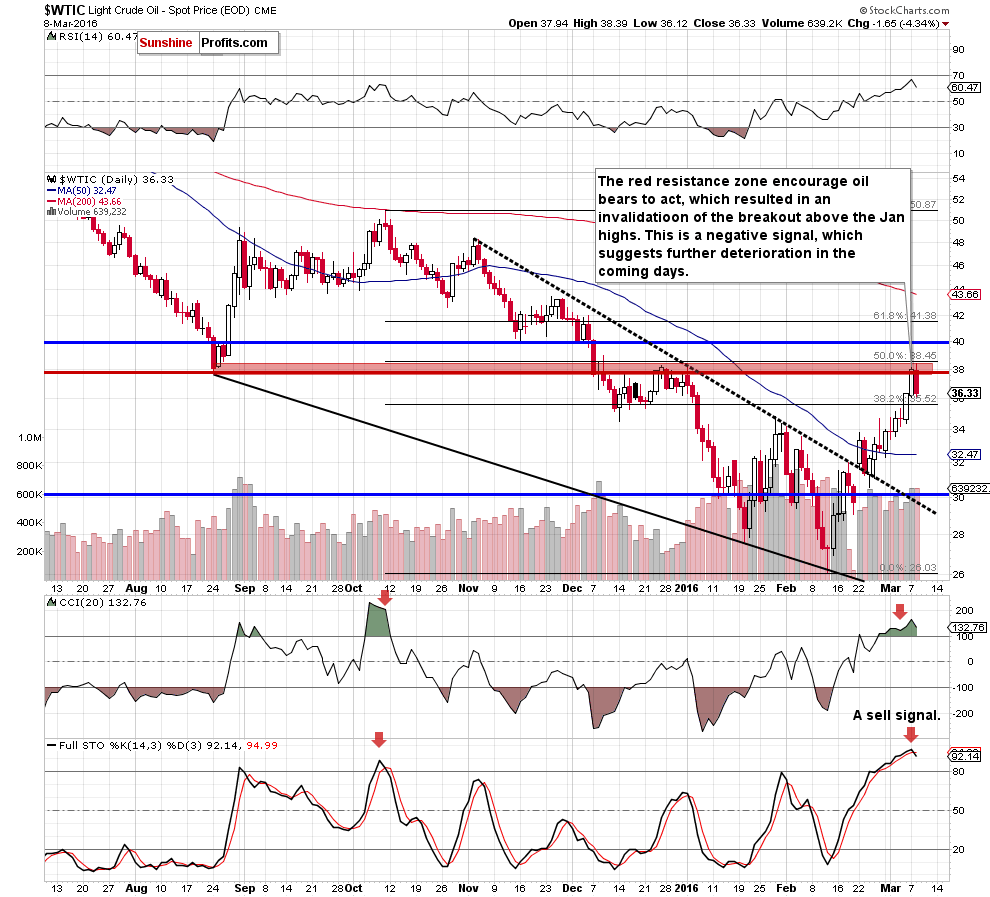
(…) crude oil extended gains and climbed (…) around $37.75-$38.45, where the red horizontal line (based on the Aug low), the late Dec and Jan highs and the 50% Fibonacci retracement (based on the Oct-Feb downward move) are. (…) Taking this fact into account and combining it with the current position of the indicators (they climbed to the highest levels since Oct and the Stochastic Oscillator is very close to generating a sell signal), we think that reversal and lower values of the commodity are just around the corner (even if we see an increase to the 50% Fibonacci retracement at $38.45). Nevertheless, such price action would be more reliable if light crude declines under the Aug low once again.
Looking at the daily chart, we see that the situation developed in line with the above scenario as crude oil declined sharply after an increase to an intraday high of $38.39. With yesterday’s move, the commodity invalidated earlier breakout above the Jan highs and came back under the Aug low of $37.75. Such price action doesn’t bode well for light crude and suggests lower values of the commodity in the coming days.
Additionally, the Stochastic Oscillator generated a sell signal (so far the indicator remains above the level of 80, but the signal is already in play), which increases the probability of further deterioration. If this is the case, and light crude extends losses, the first downside target would be around $35.40, where the previously-broken blue support/resistance line (marked on the weekly chart) currently is.
Before we summarize today’s Oil Trading Alert, we would like to draw your attention to the relationship between crude oil and gold.
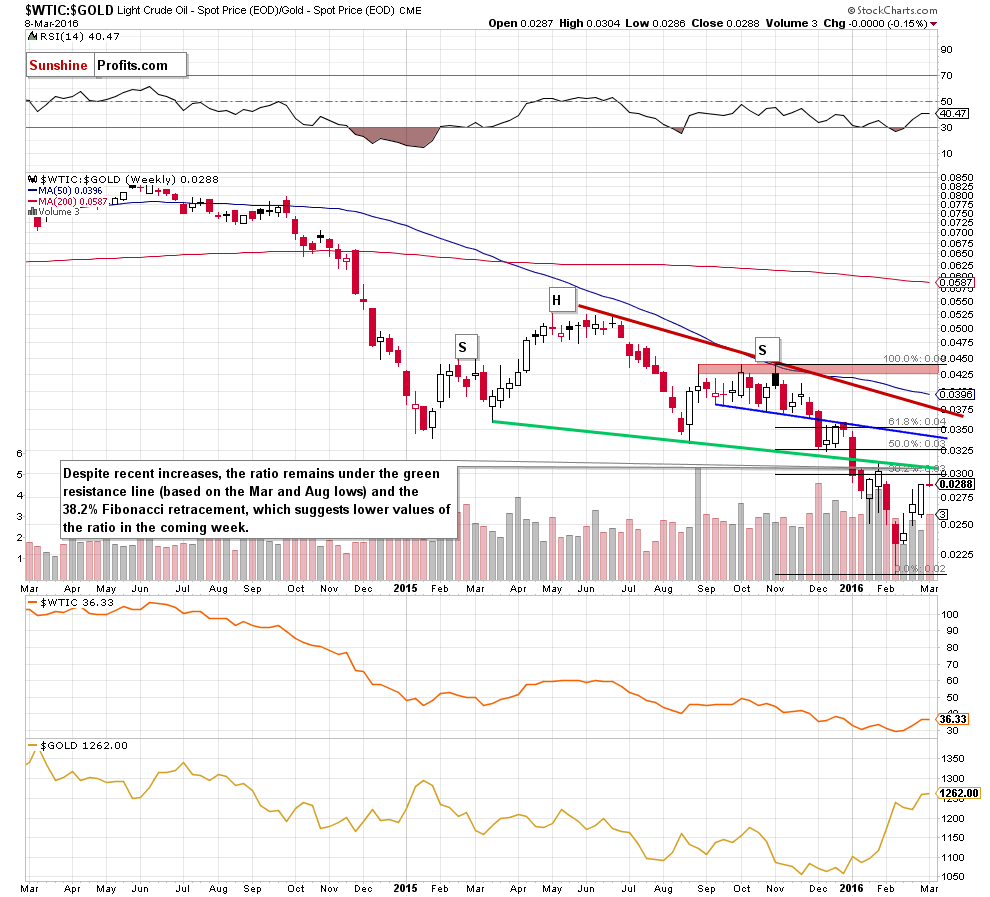
As you see on the weekly chart, although the oil-to-gold ratio moved higher earlier this week, the green resistance line (based on the Mar and Aug lows) stopped further improvement once again. We saw similar price action in late Jan, which translated into a sharp decline in the following weeks. Therefore, in our opinion, yesterday’s invalidation of a small breakout above the 38.2% Fibonacci retracement increases the probability of another downward move from here. If we see such price action, the price of crude oil will also decline – just as it happened in previous months.
Summing up, the first important resistance zone (created by the Aug low, the late Dec and Jan highs and the 50% Fibonacci retracement) triggered a pullback, which invalidated earlier breakout above the Jan highs. This is a negative sign, which suggests further deterioration in the very near future. Nevertheless, the size of volume that accompanied yesterday’s decline wasn’t significant, which doesn’t confirm oil bears’ strength yet. Therefore, we’ll wait for it (and other negative signals) before opening short positions.
Very short-term outlook: mixed with bearish bias
Short-term outlook: mixed with bearish bias
MT outlook: bearish
LT outlook: mixed with bearish bias
Trading position (short-term; our opinion): No positions are justified from the risk/reward perspective. We will keep you – our subscribers – informed should anything change.
Thank you.
Nadia Simmons
Forex & Oil Trading Strategist
Przemyslaw Radomski, CFA
Founder, Editor-in-chief
Gold & Silver Trading Alerts
Forex Trading Alerts
Oil Investment Updates
Oil Trading Alerts
