

Oil Trading Alert originally sent to subscribers on December 23, 2015, 7:26 AM.
Trading position (short-term; our opinion): No positions are justified from the risk/reward perspective.
On Tuesday, crude oil gained 1.93% as a weaker greenback supported the price. As a result, light crude broke above the upper border of the triangle. Is it enough to encourage oil bulls to another test of the Aug lows?
Yesterday, the U.S. National Association of Realtors showed that existing home sales dropped 10.5% to a 19-month low of 4.76 million units in Nov, which pushed the USD Index lower and made crude oil more attractive for buyers holding other currencies. As a result, light crude broke above the upper border of the triangle. Is it enough to encourage oil bulls to another test of the Aug lows? Let’s examine charts and find out (charts courtesy of http://stockcharts.com).
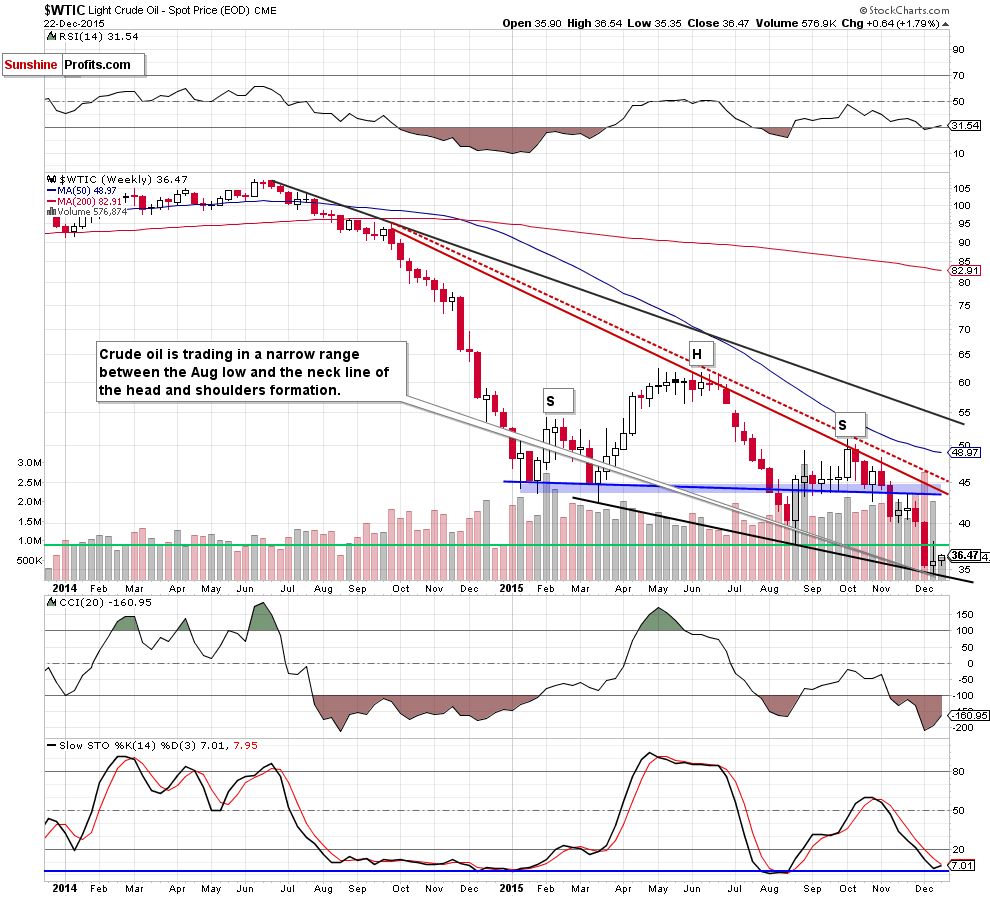
From the medium-term perspective we see that crude oil is trading in a narrow range between the Aug lows and the neck line of the head and shoulders formation. Therefore, in our opinion, as long as there is no invalidation of the breakdown below the Aug low or a breakdown under black support line, another sizable move is not likely to be seen. Nevertheless, the current position of the indicators suggests that oil bulls will try to push the commodity higher and re-test the Aug low.
Will the daily chart confirm this pro-growth scenario? Let’s check.
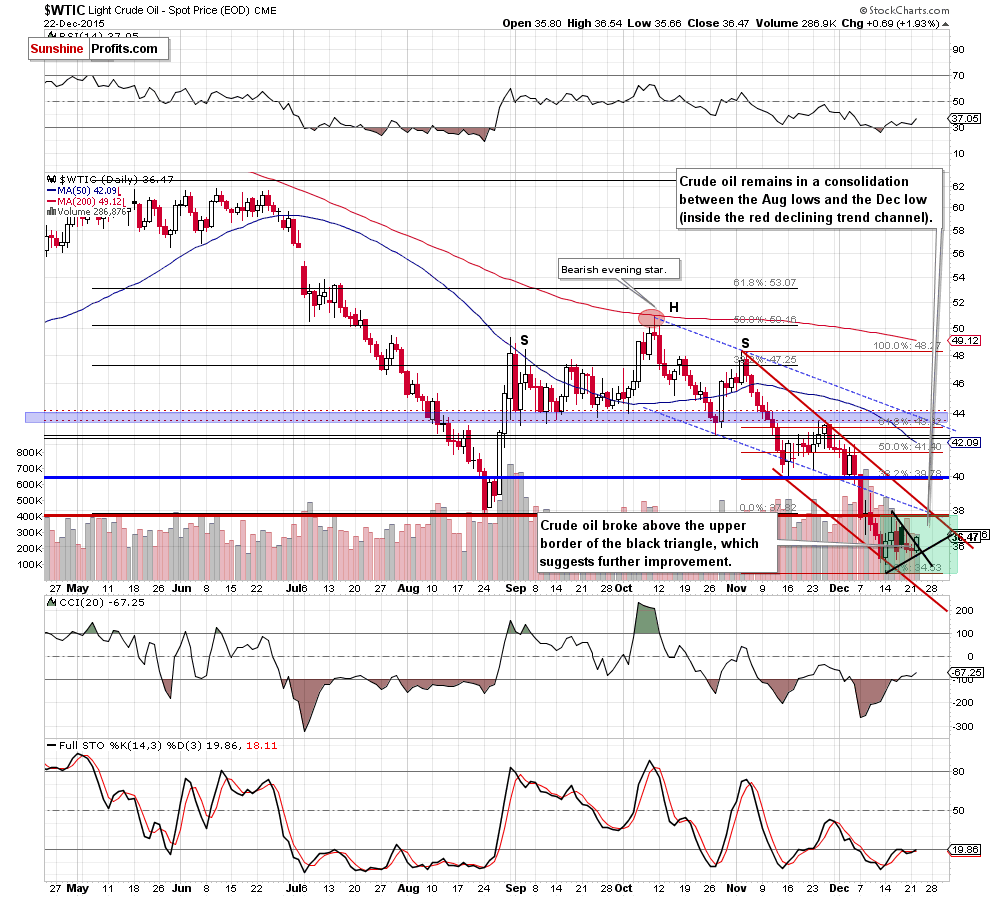
The first thing that catches the eye on the daily chart is a breakout above the upper border of the black triangle. This is a positive signal, which suggests further improvement. How high could the commodity go? We think that the best answer to this question will be the quote from our Monday’s alert:
(…) the current position of the daily indicators suggests that oil bulls will try to push the commodity higher. If this is the case, the initial upside target would be the red horizontal resistance line based on the Aug low and then the upper border of the red declining trend channel. If these lines are broken, we’ll likely see an increase to our next upside target - the barrier of $40 (please note that this area is also reinforced by the 38.2% Fibonacci retracement based on the Nov-Dec declines).
Finishing today’s alert, please keep in mind that as long as there is no breakout above the upper border of the red declining trend channel (or a breakdown under $34.53) another sizable move is not likely to be seen and short lived moves in both directions should not surprise us.
Summing up, crude oil broke above the upper border of the triangle, which suggests a re-test of the Aug lows. Nevertheless, in our opinion, the medium-term trend remains down and lower values of the commodity are still ahead us. Therefore, we’ll likely re-open short positions at higher prices (after crude oil will finish its corrective upswing) in near future.
Very short-term outlook: mixed
Short-term outlook: mixed with bearish bias
MT outlook: bearish
LT outlook: mixed with bearish bias
Trading position (short-term; our opinion): No positions are justified from the risk/reward perspective. We will keep you – our subscribers – informed should anything change.
Thank you.
Nadia Simmons
Forex & Oil Trading Strategist
Przemyslaw Radomski, CFA
Founder, Editor-in-chief
Gold & Silver Trading Alerts
Forex Trading Alerts
Oil Investment Updates
Oil Trading Alerts
