

Oil Trading Alert originally sent to subscribers on June 1, 2015, 9:17 AM.
Trading position (short-term; our opinion): Short positions with a stop-loss order at $65.23 are justified from the risk/reward perspective.
On Friday, crude oil gained 3.83% as the combination of the weaker greenback and the Baker Hughes report supported the price. As a result, light crude climbed above $60 and reached the resistance line. Will it withstand the buying pressure in the coming days?
On Friday, the U.S. Bureau of Economic Analysis showed that gross domestic product dropped by 0.7% in the first quarter of 2015, while the Chicago PMI declined to 46.2 in May, missing expectations for an increase to 53.0. Thanks to these disappointing numbers, the USD Index moved lower, making crude oil more attractive for buyers holding other currencies.
Additionally, the Baker Hughes reported that the number of oil rigs in the U.S. dropped by 13 to 646 (which is the lowest level since August, 2010), easing concerns over the supply glut. In these circumstances, light crude extended gains and climbed above $60. Will we see further improvement in the coming days? (charts courtesy of http://stockcharts.com).
In our last commentary, we wrote the following:
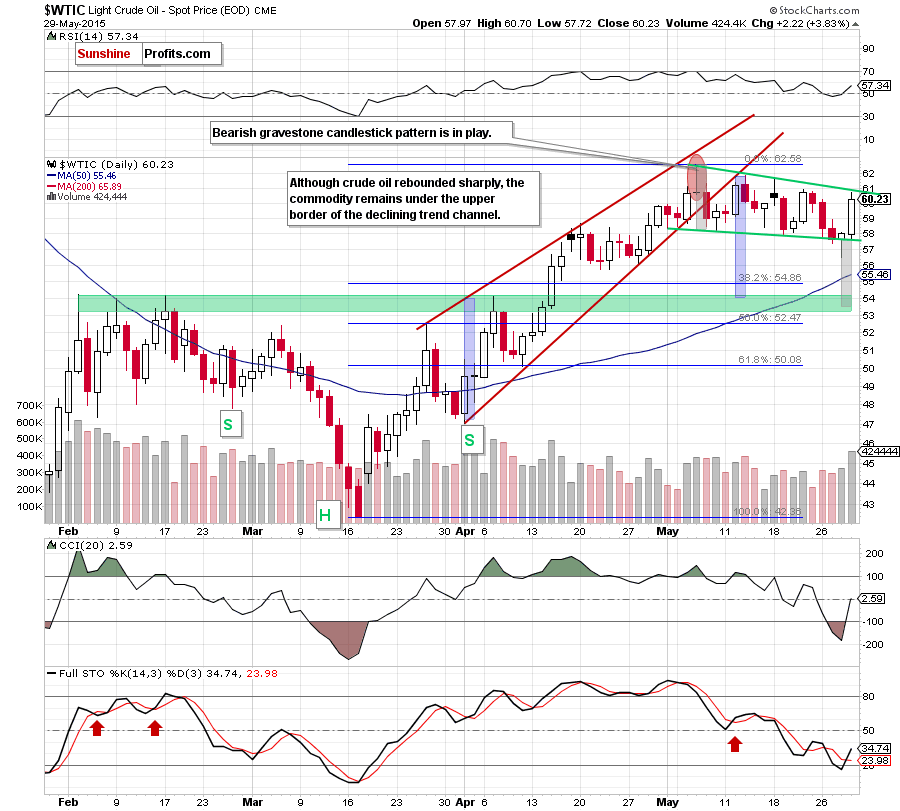
(…) crude oil declined below the neck line of the head and shoulders formation. Despite this deterioration, the commodity reversed and rebounded in the following hours, invalidating earlier breakdown (…) which suggests further improvement (even to the upper line of the green resistance line)
Looking at the daily chart, we see that the situation developed in line with the above scenario and crude oil reached upside target on Friday. Although this is a positive signal, we should keep in mind that we saw similar upswings in the previous weeks. In all precious cases, the upper border of the green declining trend channel/declining wedge in combination with a bearish gravestone candlestick pattern and the long-term picture was strong enough to stop further improvement.
And speaking of the long-term picture… Let’s take a closer look at the monthly chart and check what impact did this upward move have on the long-term perspective.
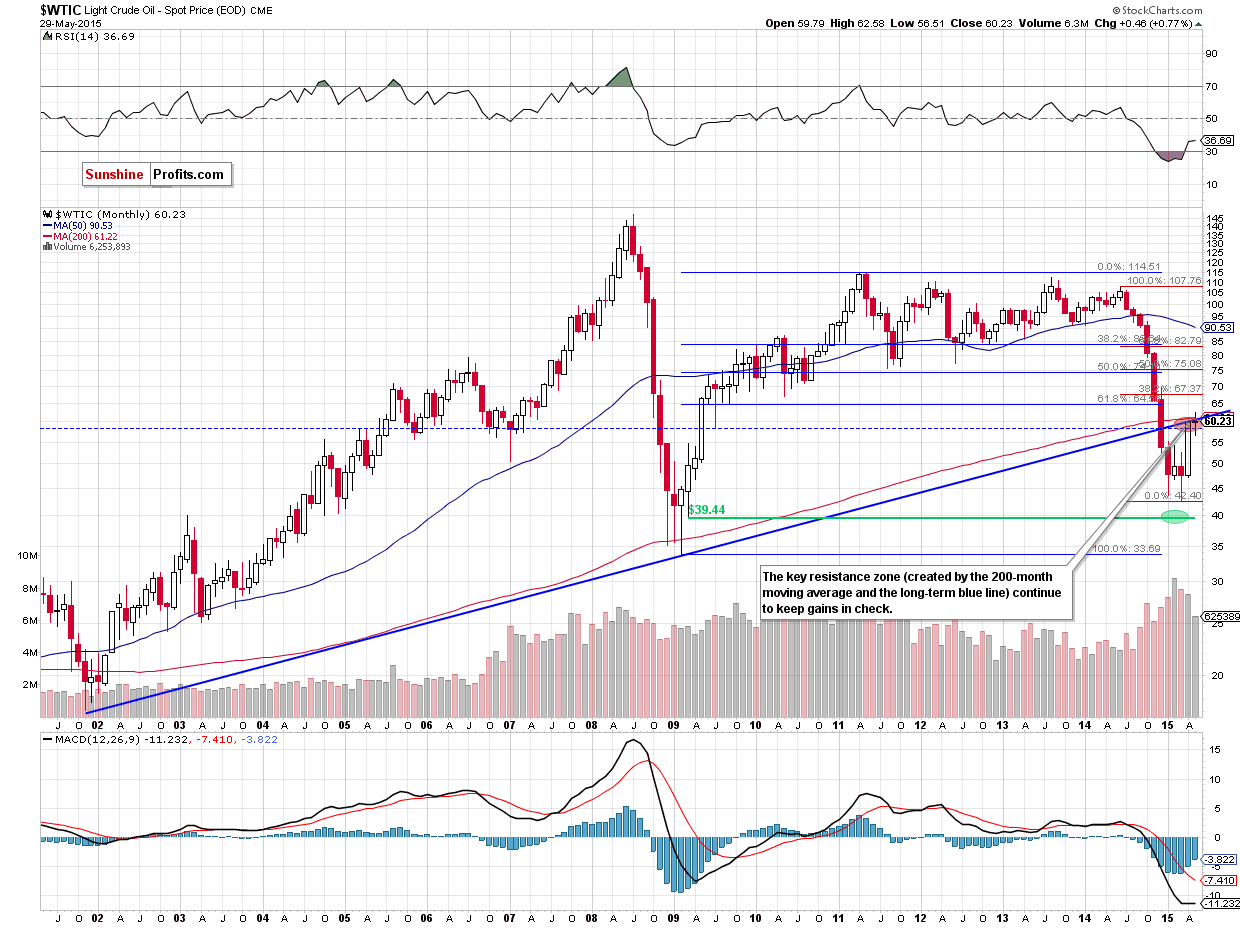
On the above chart, we see that although crude oil moved higher in the recent days, the key resistance zone (created by the long-term blue resistance line and the 200-month moving average) continues to keep gains in check. In our opinion, this means that as long as there is no successful breakout above this area further rally is not likely to be seen and further deterioration is more likely than not.
Summing up, although crude oil moved higher, the space for further gains is limited by the combination of the key resistance zone (marked on the monthly chart) and the upper border of the green declining trend channel/declining wedge. Taking the above into account, we think that a reversal and a test of the lower line of the formation is just around the corner.
Very short-term outlook: bearish
Short-term outlook: bearish
MT outlook: mixed with bearish bias
LT outlook: mixed with bearish bias
Trading position (short-term; our opinion): Short positions with a stop-loss order at $65.23 are justified from the risk/reward perspective. We will keep you – our subscribers – informed should anything change.
Thank you.
Nadia Simmons
Forex & Oil Trading Strategist
Przemyslaw Radomski, CFA
Founder, Editor-in-chief
Gold & Silver Trading Alerts
Forex Trading Alerts
Oil Investment Updates
Oil Trading Alerts
