

Oil Trading Alert originally sent to subscribers on March 30, 2015, 9:42 AM.
Trading position (short-term; our opinion): No positions are justified from the risk/reward perspective.
On Friday, crude oil lost 5.04% as supply worries related to the crisis in Yemen waned. Additionally, disappointing Baker Hughes reported watered down the price as well. As a result, light crude declined sharply, invalidating earlier breakouts above important resistance lines. What does it mean for the commodity?
On Thursday, crude oil increased significantly on fears that the closure of the Bab el-Mandeb could limit oil exports out of the strait (as a reminder, Yemen is located on a strait that connects the Gulf of Aden with the Red Sea). These worries supported the price of the commodity, pushing it to an intraday high of $52.48. However, as it turned out on the following day, Goldman Sachs wrote in a note to investors that even if the strategic pathway is unavailable, the tankers could be diverted to travel around Africa. Additionally, General Lloyd Austin told that the military would work with its Gulf and European partners to ensure that the strait remains open in spite of the conflict. Thanks to these news, fears over the disruption of Middle East crude shipments waned, which translated to lower price of the commodity.
On top of that Baker Hughes report showed that the number of oil rigs nationwide fell only by 12 to 813 (a week earlier, the number of oil rigs in the U.S. decreased by 56), which was the lowest weekly decline in nearly four months. In response to these numbers and the situation in Yemen crude oil dropped to an intraday low of $48.21, invalidating earlier breakouts above important resistance lines. What does it mean for the commodity? (charts courtesy of http://stockcharts.com).
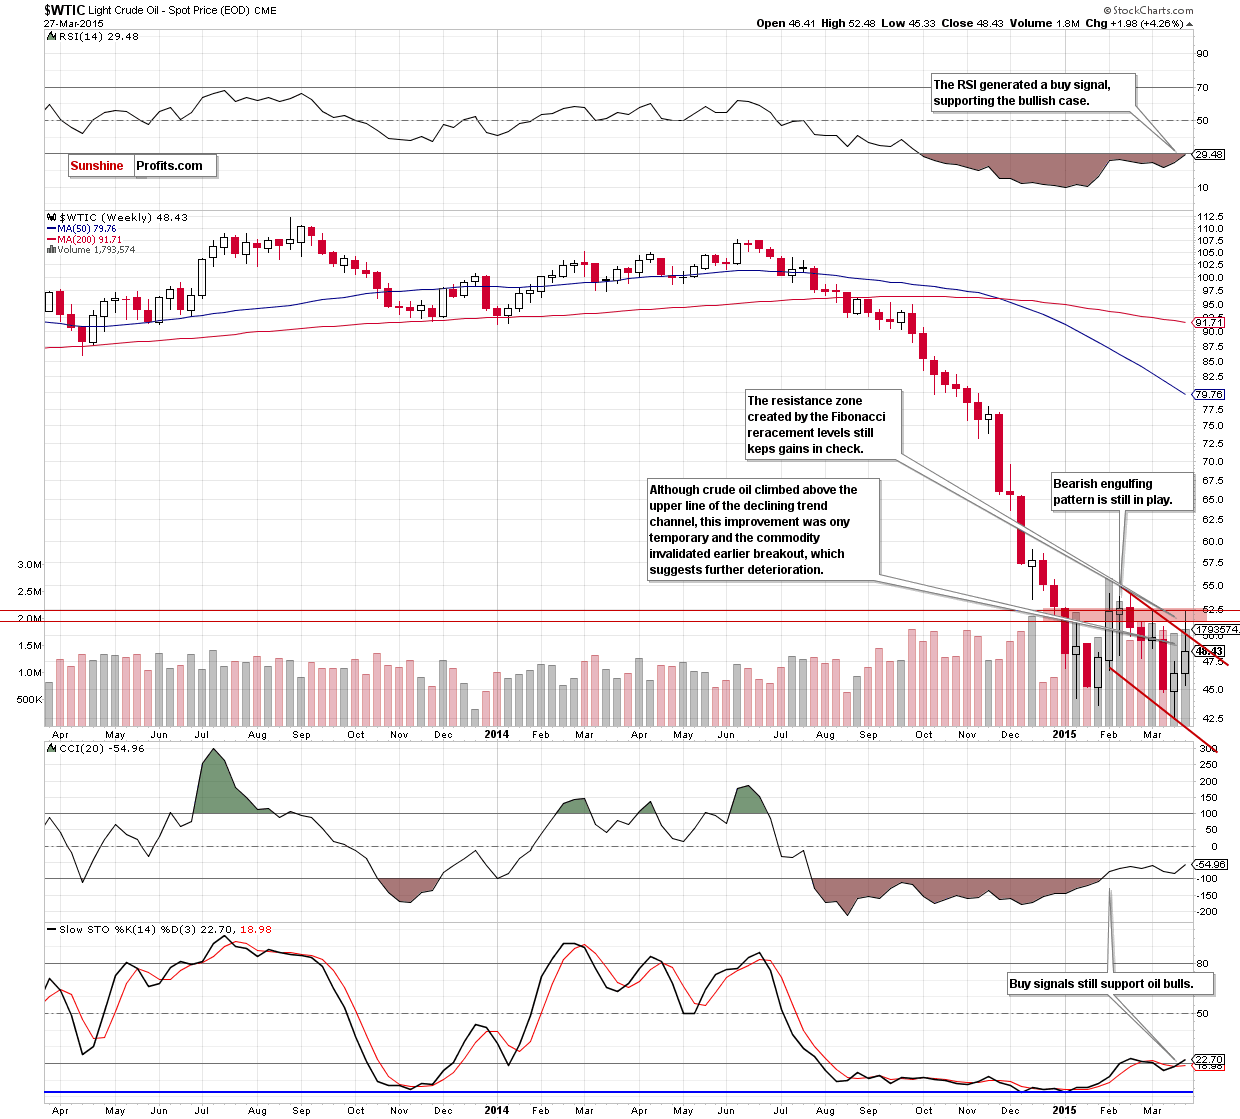
Looking at the above chart, we see that although crude oil moved sharply higher and climbed above the upper line of the declining trend channel, the resistance zone created by the 76.4% and 78.6% Fibonacci retracement levels (marked with red) successfully stopped further improvement - similarly to what we saw in the previous weeks. As a result, the commodity reversed and declined, invalidating earlier breakout. This is a negative signal that suggests another attempt to move lower.
How low could crude oil go in the coming week? Let’s examine the daily chart and look for some clues.
In our Oil Trading Alert posted on March 20, we wrote the following:
(…) in mid-Feb (…) the red resistance zone created by the Dec lows stopped further improvement and encouraged oil bears to act. Taking into account the fact that history repeats itself, it seems that we could see similar pause in the coming days as the resistance zone created by the Feb lows is currently in play.
Nevertheless, when we factor in the current position of the daily indicators (the CCI and Stochastic Oscillator generated buy signals), it seems that oil bulls will try to push the commodity above this resistance area in the coming day(s).
What is the bullish scenario? If they succeed, and crude oil closes the day above Feb lows, the initial upside target would be the previously-broken 50-day moving average (currently at $48.61). If it is broken, we might see an increase to the red declining resistance line based on the recent highs (around $50.50 at the moment) or even to $52.40, where the Mar 5 high is.
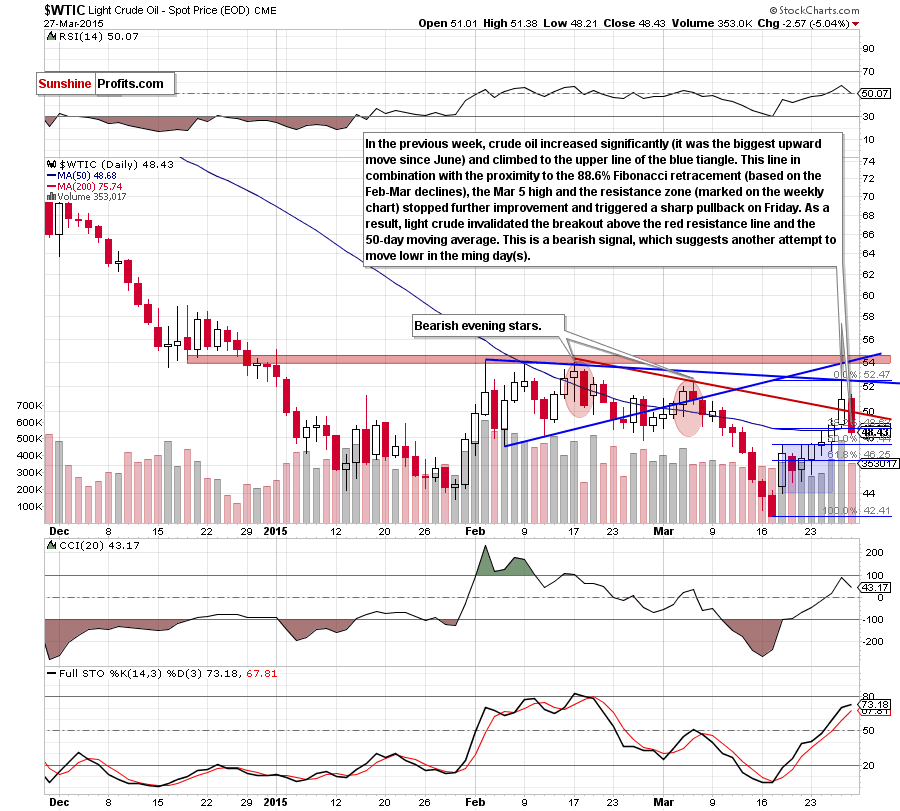
As you see on the daily chart, the situation developed in line with the above scenario as crude oil extended gains and reached our upside target after several days in a consolidation (marked with blue) under the mid-Feb lows. With this upward move light crude climbed to the upper line of the blue triangle. As you see this resistance line in combination with the proximity to the 88.6% Fibonacci retracement based on the Feb-Mar declines (around $52.80), the Mar 5 high and the resistance zone (marked with red on the weekly chart) stopped further improvement and triggered a sharp pullback on Friday. As a result, crude oil invalidated the breakout above the red resistance line (based on the Feb and Mar highs) and the 50-day moving average, which is a negative signal that suggests another attempt to move lower in the coming day(s).
How low could the commodity go? The initial downside target would be the 50% Fibonacci retracement level based on the entire recent rally around $47.45 (in this area is also the previously-broke upper line of the consolidation). If it is broken, we might see a drop to $46.26 (the 61.8% Fibonacci retracement) or even to around $44.56-$44.78, where the next Fibonacci retracements are.
Please note that even if the proximity to the 50% Fibonacci retracement level encourages oil bulls to act, it seems that the space for gains is limited as the red resistance line (currently around $49.80) is quite close.
When can we expect an improvement in the very short term? In our opinion, further increases will be likely only if we see an invalidation of the breakdown below the above-mentioned resistance line. Nevertheless, it seems to us that a sizable (and profitable) upward move will appear after a breakout above the Feb highs.
Summing up, on Friday, crude oil moved sharply lower, invalidating earlier breakout above the red resistance line based on the Feb and Mar highs, the 50-day moving average (marked on the daily chart) and the upper line of the declining trend channel (marked on the weekly chart). This is a negative signal that suggests another attempt to move lower in the coming day(s). Nevertheless, the proximity to the 50% Fibonacci retracement level could encourage oil bulls to test the strength of the red resistance line later in the day.
Very short-term outlook: mixed
Short-term outlook: mixed
MT outlook: mixed
LT outlook: bullish
Trading position (short-term; our opinion): No positions are justified from the risk/reward perspective at the moment, but we will keep you informed should anything change.
Thank you.
Nadia Simmons
Forex & Oil Trading Strategist
Przemyslaw Radomski, CFA
Founder, Editor-in-chief
Gold & Silver Trading Alerts
Forex Trading Alerts
Oil Investment Updates
Oil Trading Alerts
