
Oil Trading Alert originally sent to subscribers on October 22, 2014, 9:37 AM.
Trading position (short-term; our opinion): No positions.
Although crude oil started yesterday’s session almost $1 below Monday’s closing price, the commodity rebounded in the following hours supported by solid Chinese and U.S. data. Did this increase change the very short-term picture?
Yesterday, official data showed that China’s economy grew at an annual rate of 7.3% in the three months to September, slightly higher than the 7.2% forecast, which raised optimism among oil investors and eased worries over the world's crude oil’s second-largest consumer slowdown.
Additionally, later in the day, the National Association of Realtors showed that sales of previously owned homes climbed 2.4% from a month earlier to a seasonally adjusted annual rate of 5.17 million in September. These solid numbers improved investors’ sentiment and pushed crude oil to an intraday high of $83.26. How did fundamental factors affected the technical picture of the commodity? Let’s examine charts and find out (charts courtesy of http://stockcharts.com).
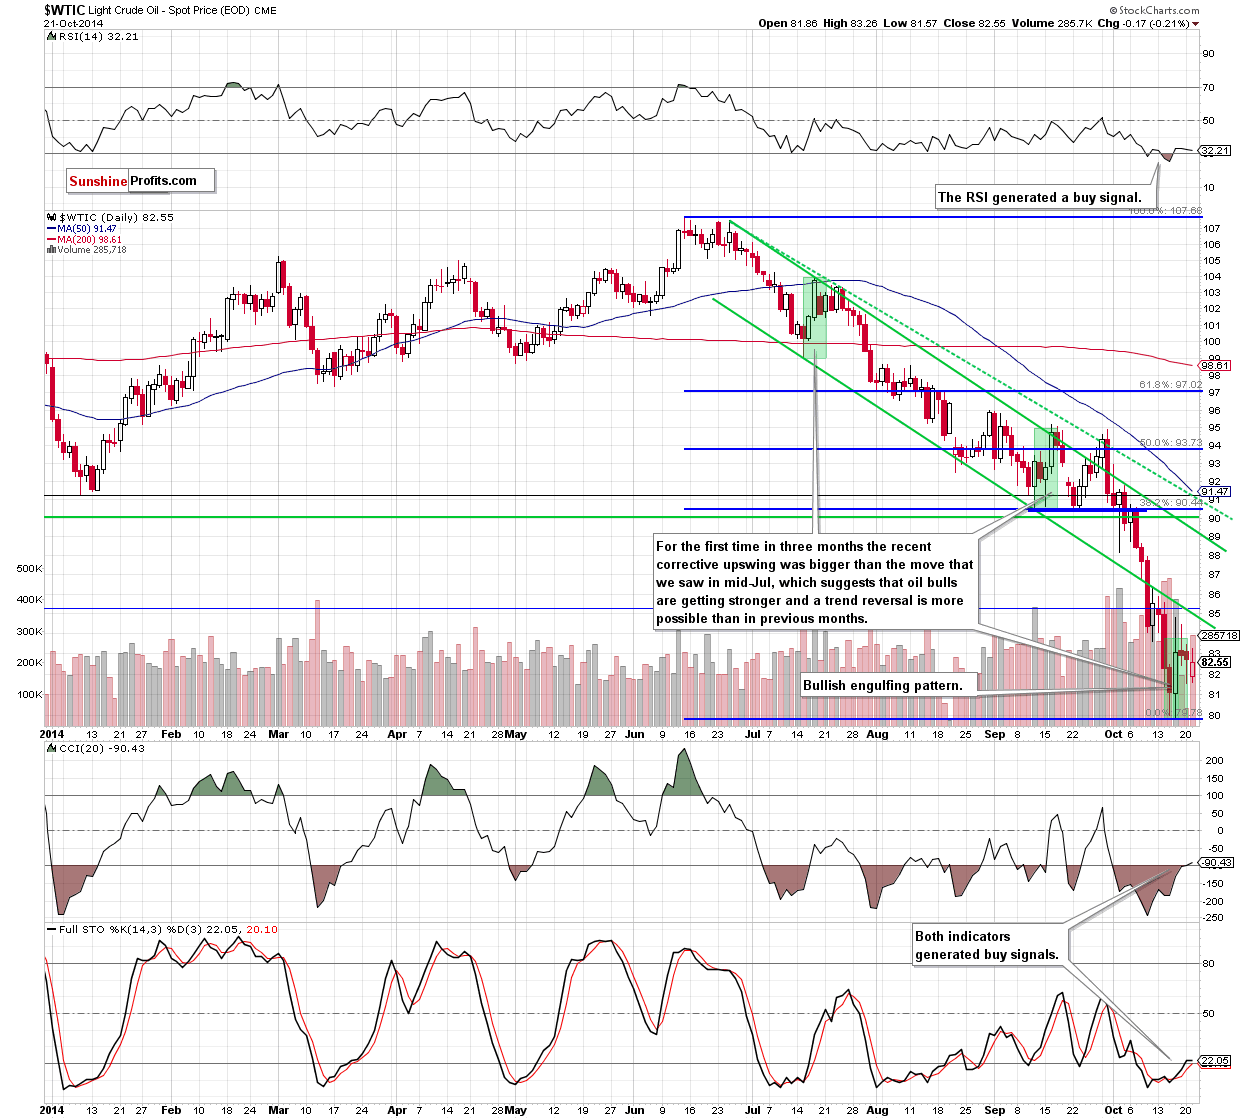
As we mentioned earlier, although crude oil started yesterday’s session almost $1 below Monday’s closing price, oil bulls didn’t give up and managed to push the price higher using this week’s low as support. As a result, crude oil rebounded sharply and climbed to an intraday high of $83.26. Despite this rally, the situation in the very short term (not to mention the short- or medium-term perspective) hasn’t changed much as the commodity is still trading in a consolidation between Thursday’s high and low. Therefore, what we wrote in our previous Oil Trading Alert is up-to-date:
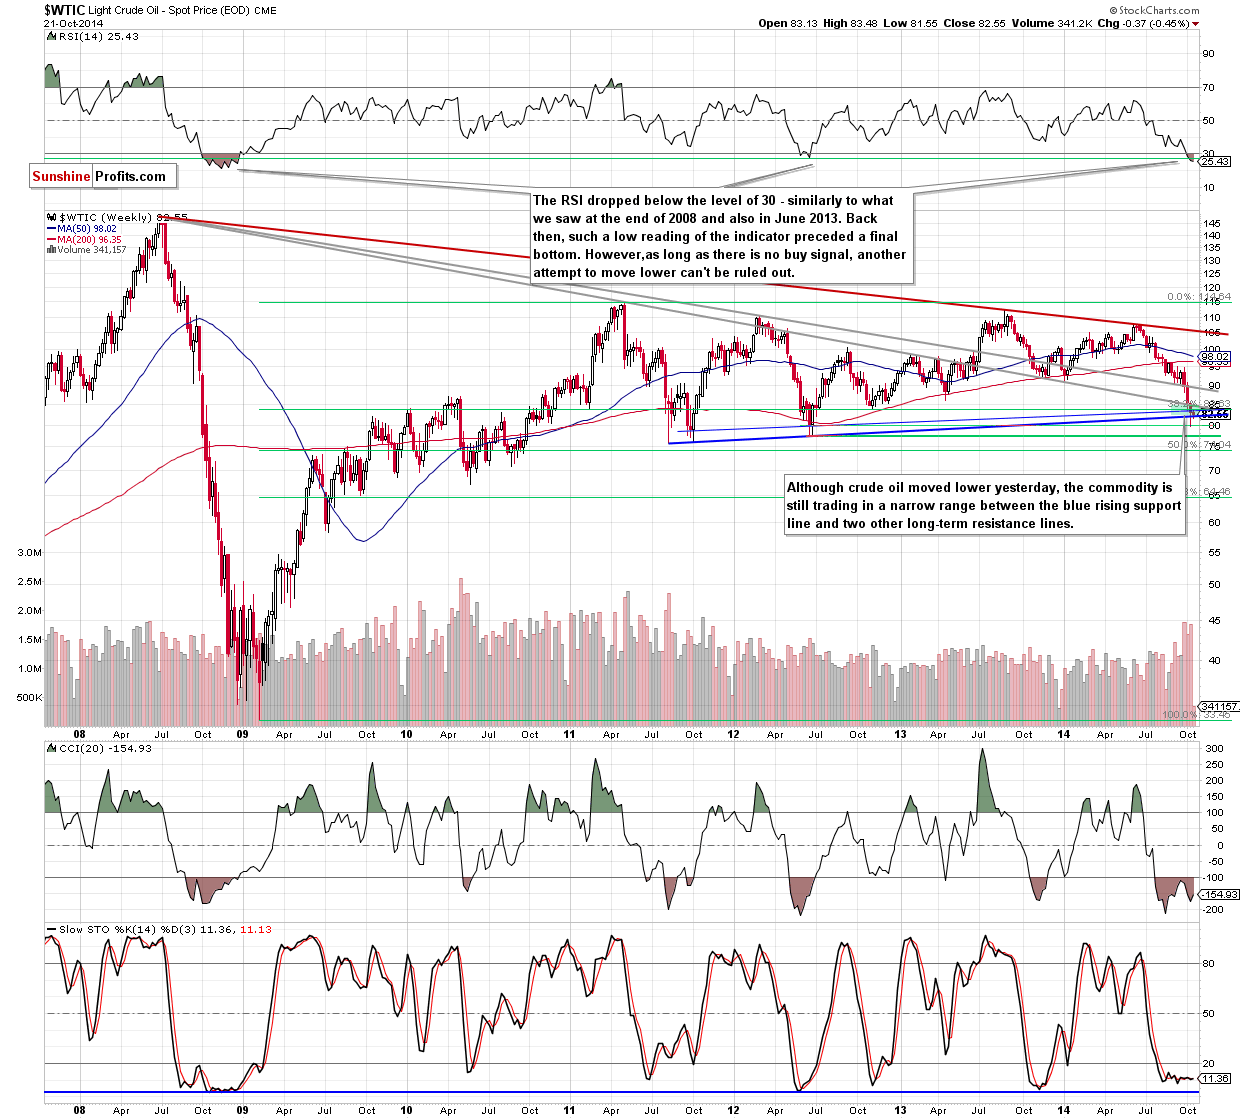
(…) light crude rebounded, invalidating earlier small breakdown. As you know this is a positive sign (especially when we factor in the bullish engulfing pattern and buy signals generated by the daily indicators), which suggests that oil bulls are getting stronger and defend this area. (…) In our opinion, a bigger upward move will be more likely if the commodity breaks above $84.80. Why this level is important? When you take a closer look at the charts, you will see that in this area is currently the lower border of the declining trend channel, the second long-term grey resistance line and the upper border of the current consolidation seen on the daily chart (based on the Oct 16 high). Therefore, a breakout above such solid resistance zone would be a strong bullish signal that should trigger further improvement and an increase to at least $88.50-$89, where the next resistance zone (created by the upper line of the declining trend channel and the first long-term grey declining line) is. However, as long as there is no such breakout, another test of the strength of the long-term blue support/resistance line can’t be ruled out.
Summing up, despite yesterday’s rally, the overall situation hasn’t changed much as the commodity is still trading in the consolidation under the solid resistance zone, which keeps gains in check. Therefore, we think that staying on the sidelines and waiting for the confirmation that the declines are over is the best choice at the moment.
Very short-term outlook: mixed
Short-term outlook: mixed
MT outlook: mixed
LT outlook: bullish
Trading position (short-term; our opinion): No positions.
Thank you.
Nadia Simmons
Forex & Oil Trading Strategist
Przemyslaw Radomski, CFA
Founder, Editor-in-chief
Gold & Silver Trading Alerts
Forex Trading Alerts
Oil Investment Updates
Oil Trading Alerts
