
Oil Trading Alert originally sent to subscribers on June 23, 2014, 10:33 AM.
Trading position (short-term; our opinion): Speculative short positions in crude oil seem to be justified from the risk/reward perspective.
On Friday, crude oil gained 0.54% as ongoing worries over the potential of supply disruptions from Iraq continued to weigh on the price. As a result, light crude climbed above the resistance line, invalidating earlier breakdown. Will this bullish factor trigger further improvement in the short term?
As you know from our previous Oil Trading Alerts, the key factor that has driven the price of crude oil in recent days was the deteriorating situation in Iraq. Therefore, news that the conflict between Sunni Islamist insurgents and Iraqi army forces continued to push the commodity higher also on Friday. Please note that although active oilfields remain far south from the insurgency, concerns about potential supply disruptions still support the price. Where crude oil head next? Let’s try to find the answer to this question on charts (charts courtesy of http://stockcharts.com).
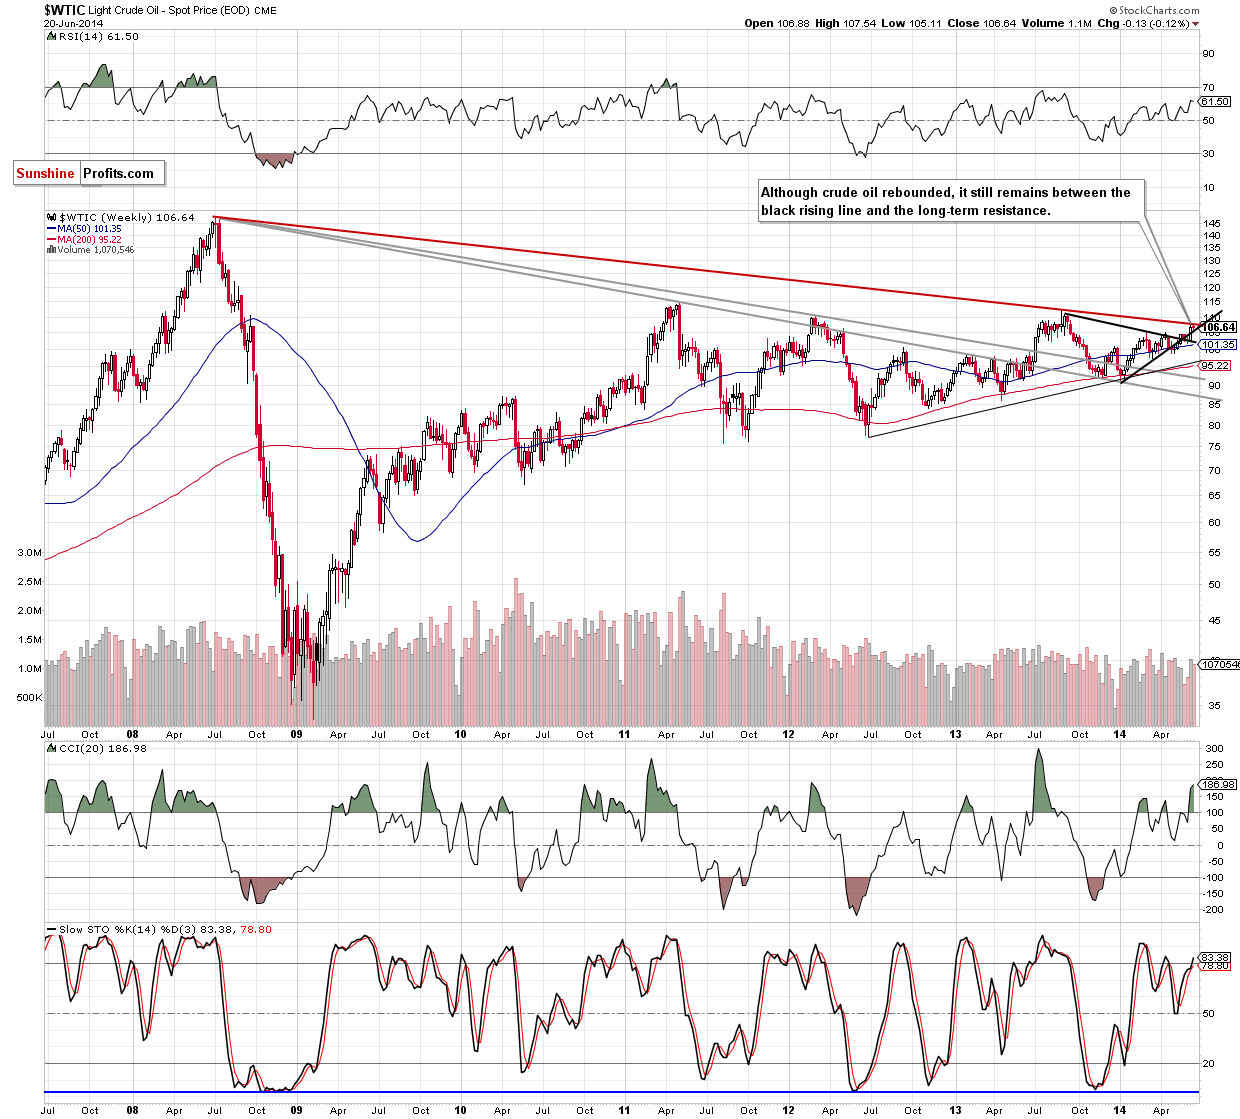
Looking at the weekly chart, we see that although crude oil rebounded and came back above the black support rising line, the commodity still remains below the long-term declining resistance line. Therefore, we think that as long as light crude is trading in this narrow range another sizable move to the upside or downside is likely to be seen.
What can we infer from the daily chart?
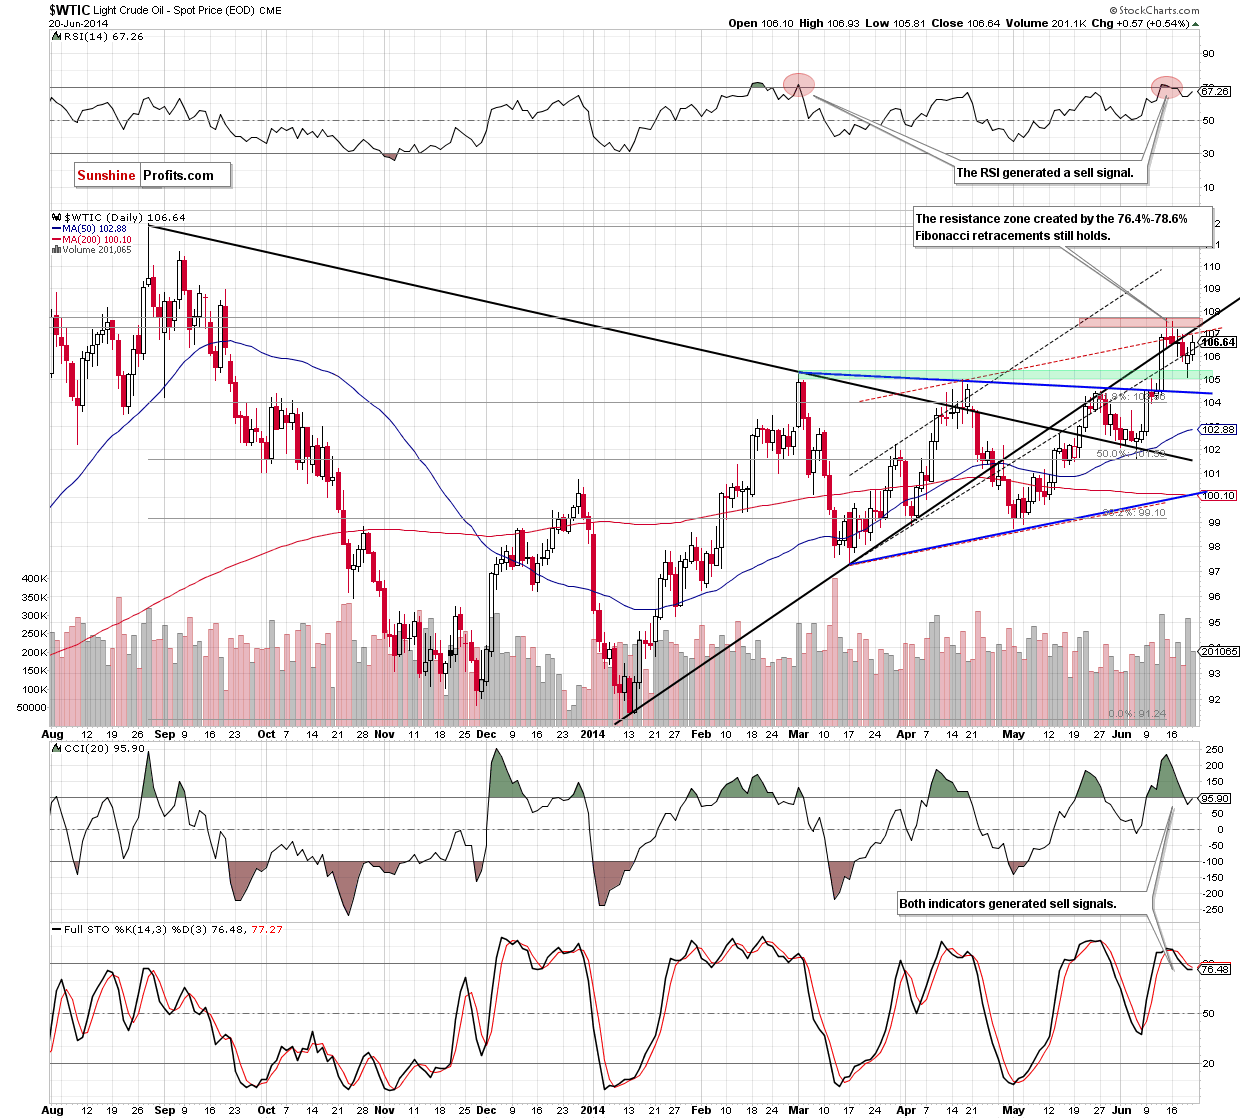
From this perspective, we see that light crude extended gains and climbed above the previously-broken black dashed support/resistance line. Although an invalidation of the breakdown is a bullish signal, we should keep in mind that despite Friday’s improvement, the commodity still remains below the medium-term black rising line and the strong resistance zone created by the 76.4% and 78.6% Fibonacci retracement levels. As a reminder, this resistance area successfully stopped further improvement in mid-June, triggering a recent decline. Therefore, we believe that if history repeats itself once again, we will see another pullback from here in the coming days. If this is the case, the initial downside target for oil bears will be the support zone created by the previous highs (marked with green). Please note that the current position of the indicators supports the bearish case as sell signals are still in play.
Summing up, although crude oil rebounded and invalidated the breakdown, we remain bearish as crude oil still remains below the medium-term black line and the strong resistance zone created by the Fibonacci retracement levels. As we mentioned earlier, if history repeats itself once again, we will see a pullback from here to at least around $105, where the nearest support zone is.
Very short-term outlook: bearish
Short-term outlook: mixed with bearish bias
MT outlook: mixed
LT outlook: mixed
Trading position (short-term): Short. Stop-loss order at $109.20. We will keep you informed should anything change, or should we see a confirmation/invalidation of the above.
Thank you.
Nadia Simmons
Forex & Oil Trading Strategist
Przemyslaw Radomski, CFA
Founder, Editor-in-chief
Gold & Silver Trading Alerts
Forex Trading Alerts
Oil Investment Updates
Oil Trading Alerts
