
Oil Trading Alert originally sent to subscribers on May 5, 2014, 10:47 AM.
Trading position (short-term; our opinion): Speculative short positions in crude oil seem to be justified from the risk/reward perspective.
On Friday, crude oil gained 0.72% as stronger-than-expected U.S. employment data and ongoing concerns over tensions between Russia and Ukraine weighted on the price. In this way, light crude rebounded and hit an intraday high of $100.14. Did this rally change anything in the overall outlook?
On Friday, the Labor Department showed that the U.S. economy added 288,000 jobs in the previous month, well above expectations for a 210,000 increase. The report also showed that the U.S. unemployment rate dropped to 6.3% in April, while analysts had expected a fall to 6.6%. In reaction to these better-than-expected numbers, the commodity rebounded and moved above the key level of $100. Although the U.S. economy added more new jobs than expected (which suggests more workers on the roads and stronger fuel demand), the record-high stockpile continued to cloud the outlook for higher prices. As a reminder, on Wednesday, the EIA showed in its weekly report that crude oil inventories rose once again and hit an all-time high of 399.4 million barrels.
Having discussed the above, let’s move on to the technical changes in the crude oil market (charts courtesy of http://stockcharts.com.)
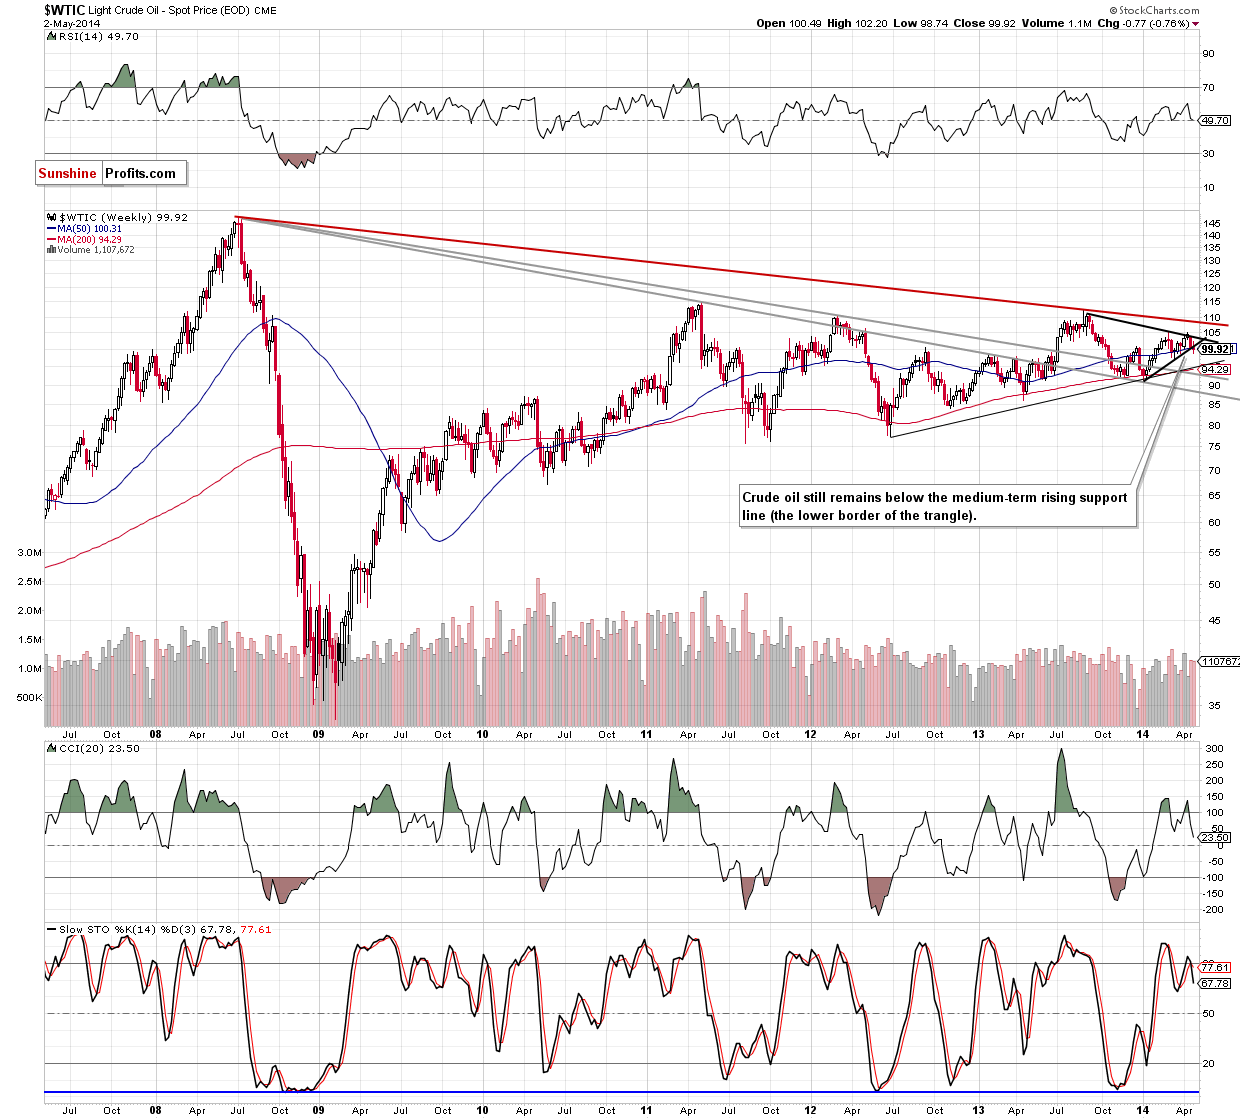
Looking at the weekly chart, we clearly see that the situation hasn’t changed much as crude oil still remains below the lower border of the triangle, the psychological barrier of $100 and the 50-week moving average. Although the breakdown is not confirmed, in our opinion, furter deterioration is likely to be seen. Therefore, the bearish scenario from our Oil Trading Alert posted on Wednesday is up-to-date:
(…) if the commodity extends losses and drops below the psychological barrier of $100, we will likely see further deterioration and a drop even to around $95, where the medium-term support line (based on the June 2012 and January 2014 lows) is. At this point, it’s worth noting that the CCI and Stochastic Oscillator generated sell signals, which suggests that another attempt to move lower should not surprise us.
Once we know the situation from the weekly perspective, let’s zoom in on our picture and move on to the daily chart.
Quoting our previous Oil Trading Alert:
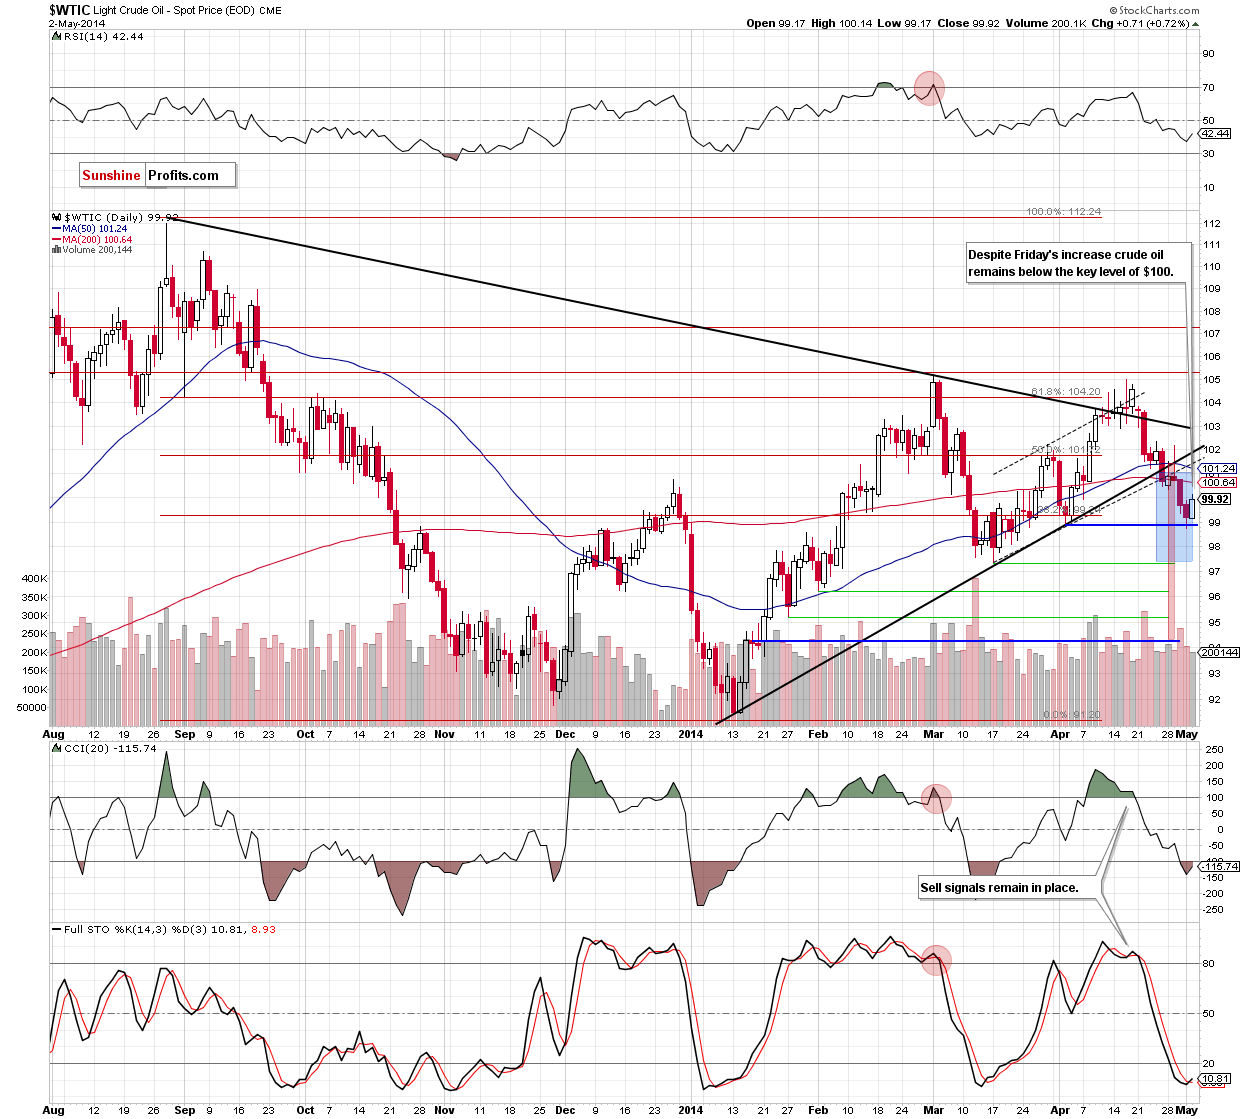
(…) crude oil moved lower once again and reached the bottom of the correction that we saw at the turn of March and April. If this support level holds, we may see a corrective upswing in the coming day and the first upside target will be the previously-broken level of $100.
As you see on the daily chart, crude oil rebounded and reached its first upside target on Friday. Despite this improvement, the commodity gave up the gains in the following hours and closed the day below the key level of $100 for the third time in a row. Taking this fact into account, we can conclude that all bearish factors that we noticed in the previous week (a confirmed breakdown below the the lower border of the medium-term triangle, the lower border of the short-term trend channel and the psychological barrier of $100) remain in place and still support the bearish case. At this point, it’s also worth noting that the breakdown in the USO ETF is confirmed after Friday's session, which is an additional negative sign. Therefore, we think that another attempt to move lower and test the strength of the nearest support level should not surprise us.
Please keep in mind that if it is broken, we will likely see further deterioration and a drop to one of downside targets that we discussed in our previous Oil Trading Alert:
(…) In the case of the breakdown under the lower border of the trend channel, declines may push the price to around $97, where the size of the downswing will correspond to the height of the formation. Nevertheless, in our opinion, the confirmation of the breakdown below the medium-term line is more important because it suggests an even bigger move. of its implication. In this case, the correction may be deeper and take light crude to around $94.20. At this point, it’s worth noting that the first downside target is supported by the March low of $97.37 and the latter corresponds to the 78.6% Fibonacci retracement based on the entire Jan.-March rally.
Summing up, although crude oil moved higher, it still remains below the previously-broken important resistance lines. Additionally, the commodity closed the day below the key level of $100 for the third time in a row, which means that the breakdown below this psychological barrier is confirmed. In our opinion, this is a strong bearish signal, which will likely encourage oil investors to push the sell button in the coming days and trigger further deterioration.
Very short-term outlook: bearish
Short-term outlook: bearish
MT outlook: mixed
LT outlook: mixed
Trading position (short-term): Short. Stop-loss order: $102.50. We will keep you informed should anything change, or should we see a confirmation/invalidation of the above.
Thank you.
Nadia Simmons
Forex & Oil Trading Strategist
Przemyslaw Radomski, CFA
Founder, Editor-in-chief
Gold & Silver Trading Alerts
Forex Trading Alerts
Oil Investment Updates
Oil Trading Alerts
