
Oil Trading Alert originally sent to subscribers on April 28, 2014, 12:05 PM.
Trading position (short-term; our opinion): No positions are justified from the risk/reward perspective.
On Friday, the price of light crude declined from $102 as concerns over domestic supplies encouraged oil investors to sell the commodity for profits. Will the psychological barrier of $100 withstand the selling pressure in the following days?
On Friday, the Thomson Reuters/University of Michigan's final April consumer sentiment index came in at 84.1, beating market expectations for a 83.0 reading. This positive news in combination with the ongoing conflict in Ukraine took the price above $102. Despite the increase, rising concerns over domestic supplies encouraged oil investors to take profits and pushed light crude below $101 per barrel. As a reminder, crude-oil supplies have increased in 13 of the last 14 weeks and currently stand at 397.7 million barrels and this is the highest recorded level since the 1931. At this point, it’s also worth noting that refinery capacity utilization rose 2.2 percentage points last week to 91%, but crude-oil stocks still rose by 3.5 million barrels, which is a bearish signal.
Having discussed the above, let’s move on to the technical changes in the crude oil market (charts courtesy of http://stockcharts.com.)
In our previous Oil Trading Alert, we wrote the following:
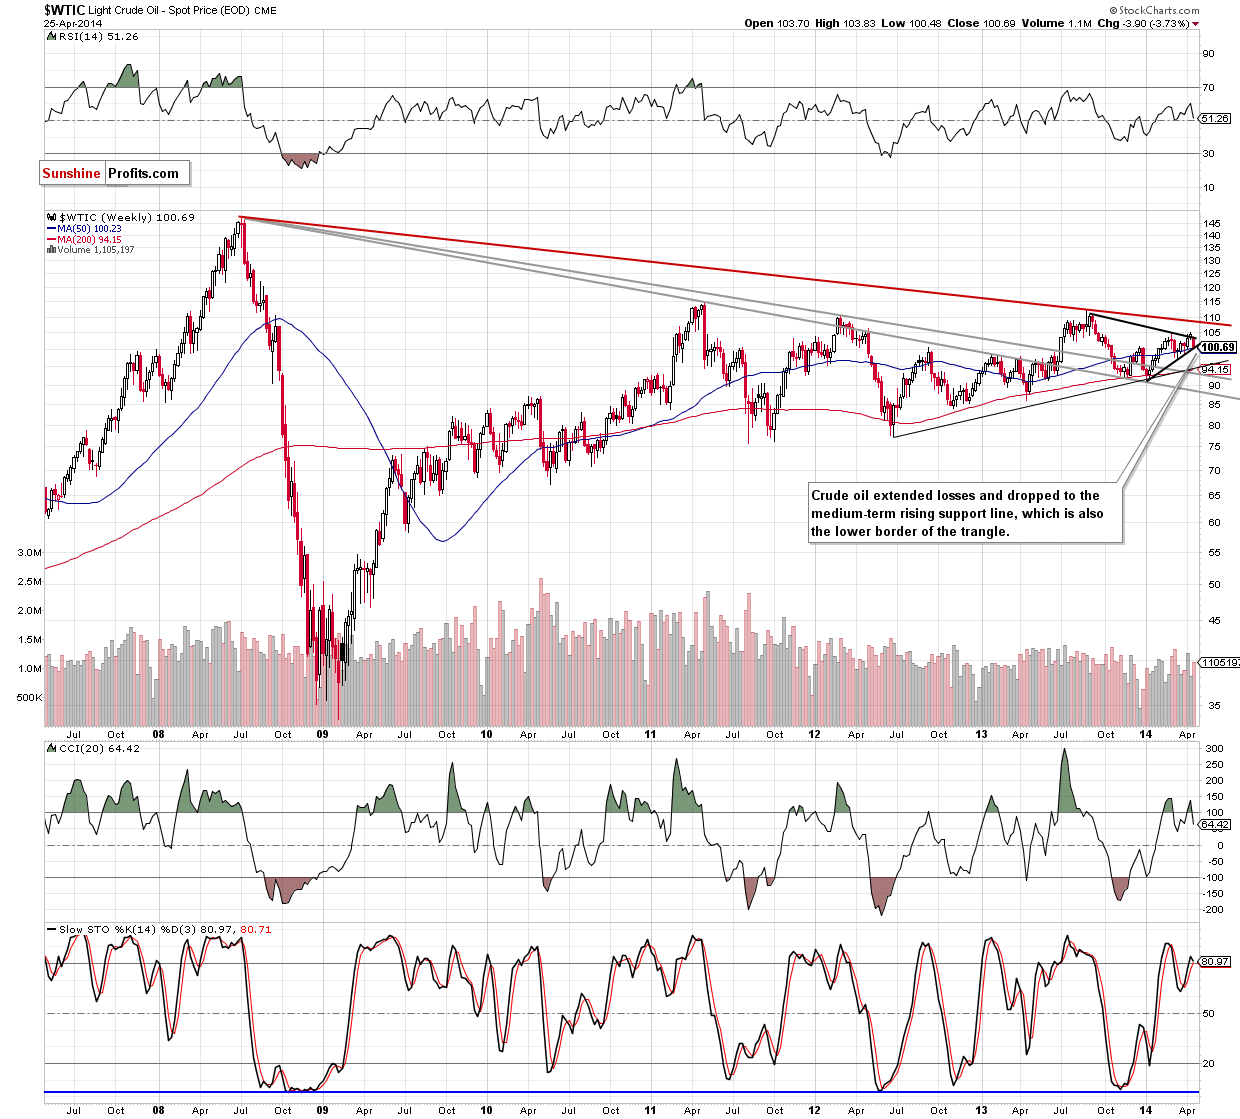
(…) crude oil gave up the gains and declined below the medium-term resistance line (marked with black). With this move, the commodity invalidated the breakout above this support line, which is a bearish signal. Taking this fact into account, it seems that we may see further deterioration and the downside target for the sellers will be the lower line of a triangle, which corresponds to the 50-week moving average at the moment (around $100.25).
As you see on the weekly chart, the situation has deteriorated as crude oil extended losses and dropped to its downside target on Friday. With this downward move, light crude also approached the 50-week moving average. Taking these facts into account, we should consider two scenarios. On one hand, if the support area encourages buyers to act, we may see a corrective upswing in the following days. In this case, the upside target for the buyers will be the medium-term resistance line (currently around $103.50). However, if oil bears do not give up and push the price below the support zone, we will likely see further deterioration and a drop even to around $95, where the medium-term support line (based on the June 2012 and January 2014 lows) is. At this point, it’s worth noting that the CCI generated a sell signal, while the Stochastic Oscillator is close to doing it, which suggests that another attempt to move lower should not surprise us.
To see the current situation in crude oil more clearly, let’s zoom in on our picture and move on to the daily chart.
In our previous Oil Trading Alert, we wrote the following:
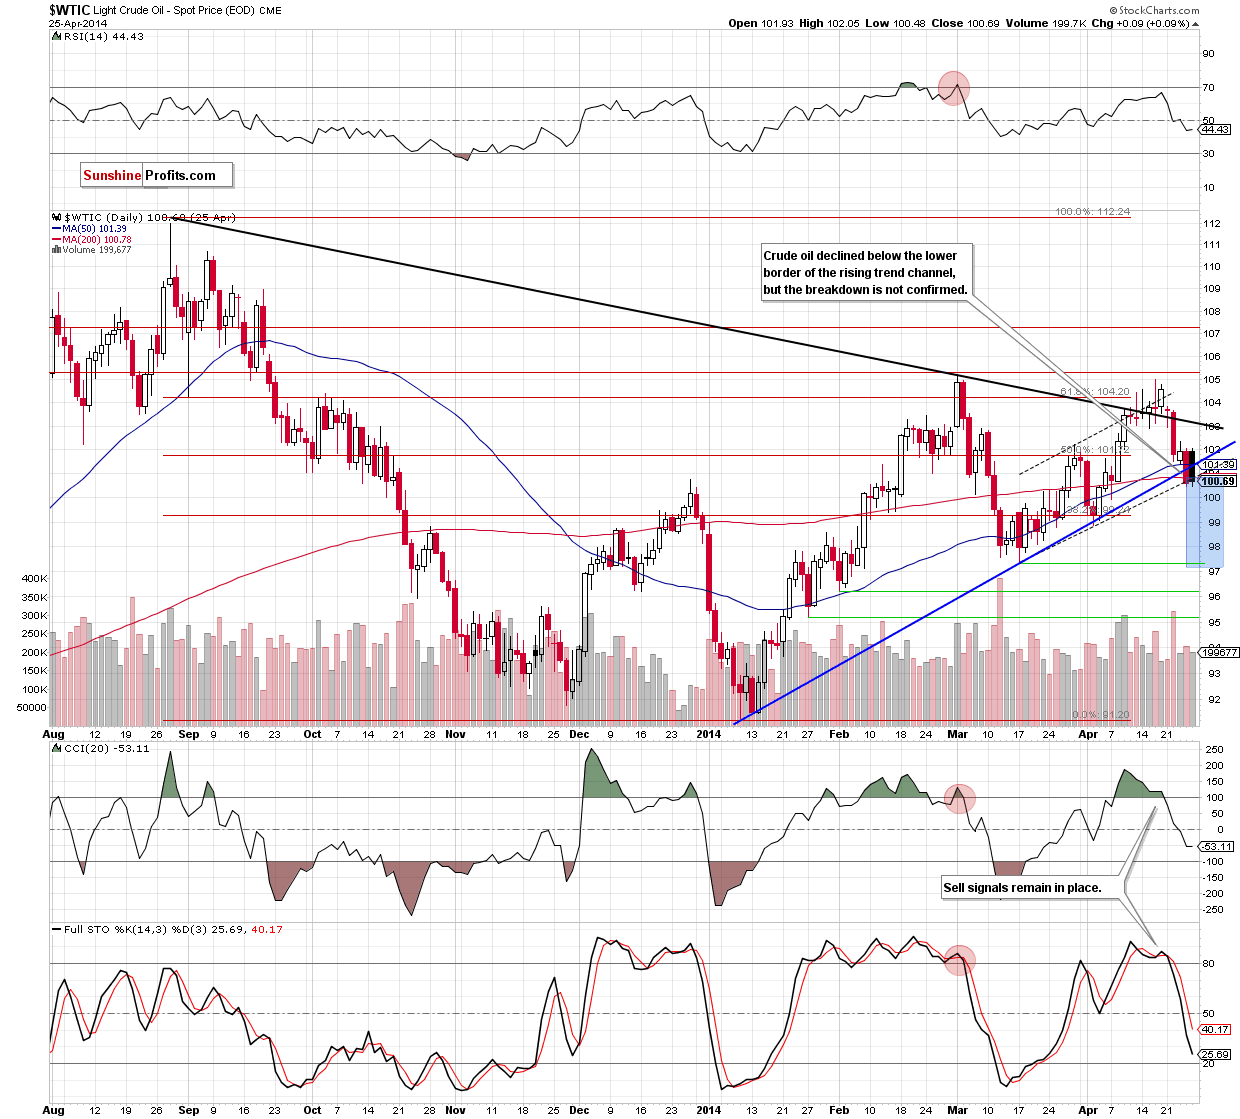
(…) light cude increased and hit an intraday high of $102.35, approaching the 38.2% Fibonacci retracement. If this resistance level encourages sellers to act, we may see another test of the strength of the 50-day moving average (which still serves as major support). (…) if the 50-day moving average is broken, the next downside target for the sellers will be the 200-day moving average (currently at $100.81). Please keep in mind that sell signals generated by the indicators remain in place, supporting the bearish case.
Looking at the above chart, we see that after the market open the sellers took control and succesfully realized the above-mentioned bearish scenario. Thanks to this downswing, the price not only dropped below two important moving averages, but also under the lower border of the rising trend channel, which is a negative sign. If the breakdown is not invalidated, we may see further deterioration and the downside target for the sellers (which corresponds to the height of the formation) will be around $97 (this area is supported by the March low of $97.37). Please note that even if oil bulls manage to push light crude above the resistance line, the combination of the 200- and 50-day moving averages may pause or stop further improvement. Connecting the dots, it seems that further deterioration is just around the corner (this scenario is also supported by sell signals generated by the indicators in the previous week).
Summing up, the short-term situation has deteriorated as crude oil declined below the lower border of the rising trend channel (and also under the 50- and 200-day moving averages). If we see another daily close below this line, the breakdown will be confimed, which may trigger further deterioration - especially, if the price of light crude declines below the lower line of a triangle marked on the weekly chart (currently around $100.25). If this strong support is broken, we’ll consider opening short positions.
Very short-term outlook: bearish
Short-term outlook: bearish
MT outlook: mixed
LT outlook: mixed
Trading position (short-term): In our opinion no positions are justified from the risk/reward perspective. We will keep you informed should anything change, or should we see a confirmation/invalidation of the above.
Thank you.
Nadia Simmons
Forex & Oil Trading Strategist
Przemyslaw Radomski, CFA
Founder, Editor-in-chief
Gold & Silver Trading Alerts
Forex Trading Alerts
Oil Investment Updates
Oil Trading Alerts
