
Oil Trading Alert originally sent to subscribers on April 3, 2014, 5:48 AM.
Trading position (short-term; our opinion): Short. Stop-loss orders for crude oil and also for WTI Crude Oil (CFD): $102.95.
On Wednesday, crude oil lost 0.42% as fears about sluggish demand and talks between the Libyan government and protestors weighted on the price. Because of these circumstances, light crude declined for the third time in a row and closed the day slightly above $99 per barrel.
Yesterday, the U.S. Energy Information Administration showed in its weekly report that U.S. crude oil inventories fell by 2.4 million barrels in the week ended March 28 (missing expectations for an increase of 1.1 million barrels), while distillate stockpiles increased by 0.6 million barrels, confounding expectations for a withdrawal of 0.1 million barrels. Despite this bullish report, the price of light crude extended declines. It seems that oil investors connected this unexpected drop in crude oil supplies with a closure of the Houston Ship Channel between March 22 and March 25. That event limited imports of crude oil and probably required refiners to draw more supplies from storage. Therefore, this drop in U.S. supply failed to erase traders' fears about sluggish demand and pushed the price below $99.
Additionally, crude oil extended declines as talks between the Libyan government and protesters fueled expectation for global supply to increase. Oil ports held by armed protesters along the Libyan coast may begin shipments soon (after an eight-month standoff) due to an agreement between both sides.
Having discussed the above, let’s move on to the technical changes in the crude oil market (charts courtesy of http://stockcharts.com.)
Quoting our last Oil Trading Alert:
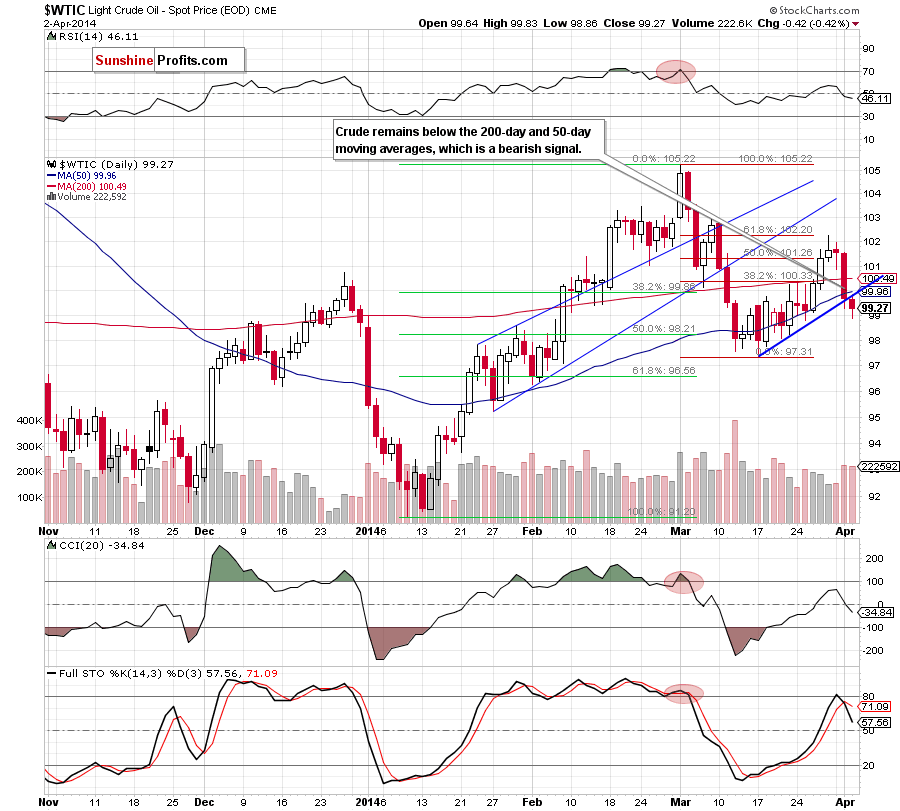
(…) with yesterday’s downswing light crude reached a blue support line (based on the recent lows). If it is broken, the nearest support will be around $98.80, where the 61.8% Fibonacci retracement (based on the entire recent increase) is (…) this area is also reinforced by the March 25 low.
Looking at the daily chart, we see that oil bears took control after the market open and prevented the return above the blue support line (which serves as resistance at the moment). These circumstances triggered further deterioration and crude oil declined below $99, hitting an intraday low of $98.86. In this way, light crude approached a support area and rebounded. Despite this fact, the commodity still remains below a resistance zone created by the previously-broken blue resistance line and the 50-day moving average (around $99.96). If oil bulls do not manage to push the price above this area, we will likely see another attempt to move lower. If this is the case, and the nearest support zone is broken, the next downside target for the sellers will be a support area (around $98-$98.27) created by the 76.4% and 78.6% Fibonacci retracements and the lower border of the rising trend channel on the weekly chart (we included it in yesterday’s Oil Trading Alert). Please note that Wednesday’s downswing materialized on relative high volume, which confirms the strength of the sellers at the moment and suggests that we may see further deterioration in the coming day (or days). On top of that, we should keep in mind that light crude still remains below the 50-week moving average and sell signals generated by the indicators remain in place, supporting sellers.
Having discussed the current situation in light crude, let’s take a look at WTI Crude Oil (the CFD).
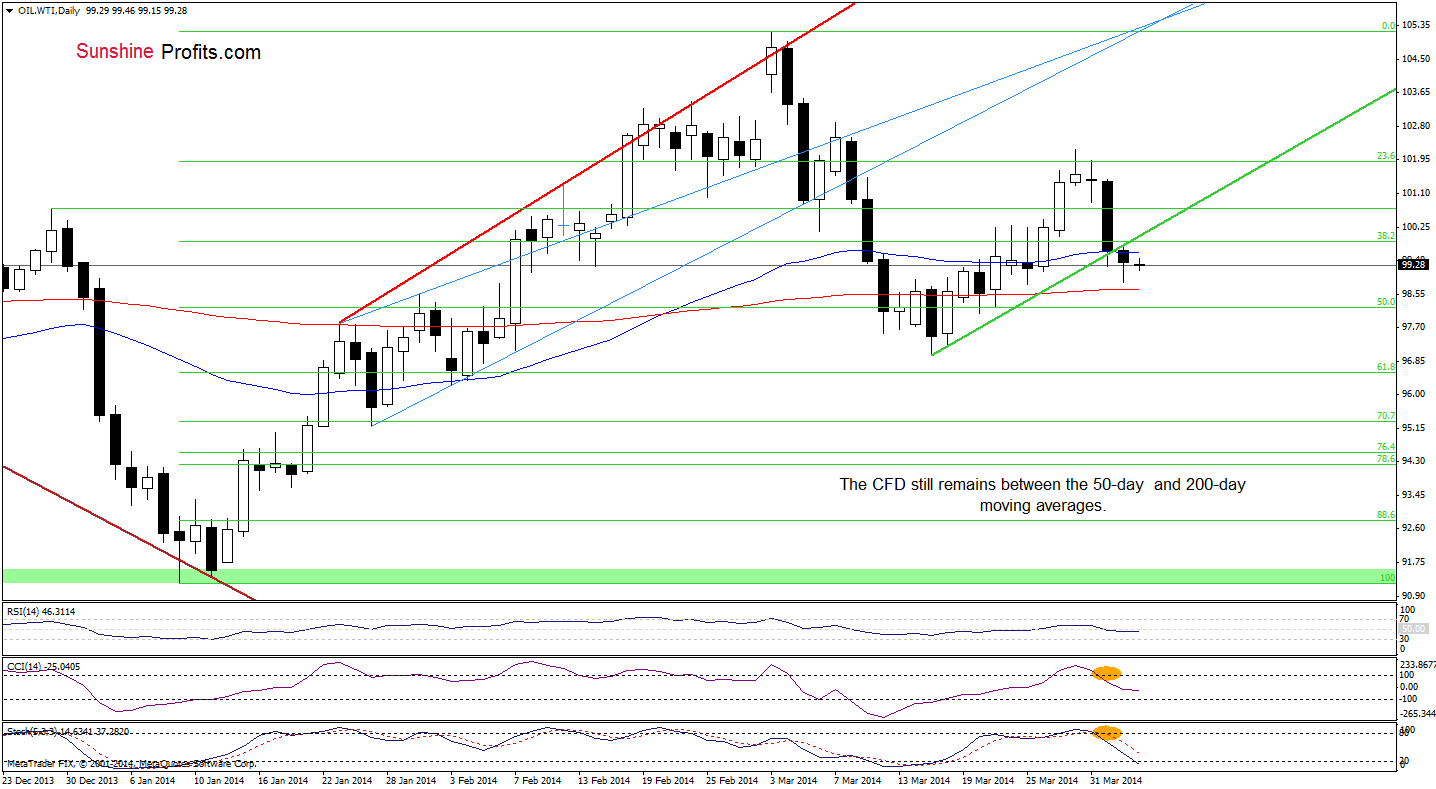
As you see on the daily chart, WTI Crude Oil extended losses and approached the 200-day moving average. Although the proximity to this strong support encouraged oil bulls to act, they didn’t manage to push the price above the previously-broken 50-day moving average (not to mention the comeback above the very short-term green line, which serves as resistance at the moment). These are not positive news for the buyers – especially when we factor in sell signals generated by the indicators, which suggests further deterioration. Please note that the nearest support is still the 200-day moving average (currently at $98.68). However, if this strong support is broken, we may see a correction even to the March 17 low of $96.99. As mentioned earlier, the nearest resistance is created by the 50-day moving average (currently at $99.60) and the very short-term resistance line (around $99.96). If it is broken, the next upside target will likely be Tuesday’s high.
Before we summarize today’s Oil Trading Alert, let’s take a look at the 4-hour chart.
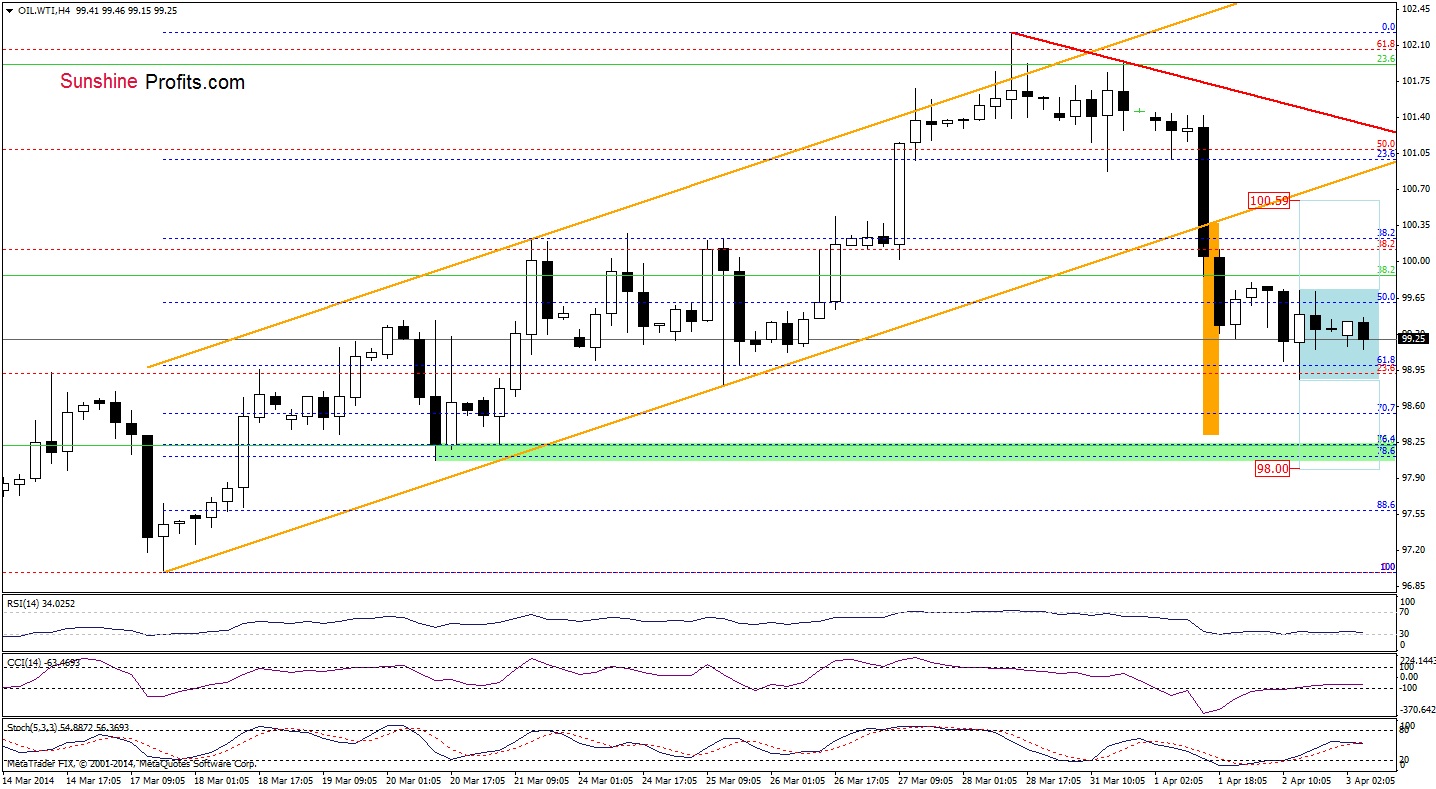
From this perspective, we see that the CFD paused earlier declines after a drop to slightly below the 61.8% Fibonacci retracement. Although we saw a corrective upswing yesterday, WTI Crude Oil still remains below the previously-broken lower border of the rising trend channel. As you see on the above chart, the recent candlesticks have formed a consolidation. So, if the CFD breaks above the upper line of this formation, we may see an increase to around $100.59. However, if the sellers push the price below yesterday’s low, they will realize a bearish scenario. As a reminder, the downside target (which corresponds to the height of the trend channel) is around $98.31(slightly below the 200-day moving average and only 10 cents above a support zone created by the 76.4% and 78.6% Fibonacci retracements).
Summing up, the short-term situation has deteriorated once again as crude oil dropped below the blue support line based on the recent lows. Despite yesterday’s small corrective upswing, the commodity still remains below the 200-day and 50-day moving averages. As mentioned earlier, yesterday’s downward move materialized on relative high volume, which confirms the strength of the sellers. The current situation in WTI Crude Oil is mixed as the CFD remains in a consolidation. However, taking into account sell signals generated by the indicators, it seems that oil bears will realize their own scenario before the market open. If this is the case, and the CFD declines once again, it will have a negative impact on light crude (just like in the previous days) and we will see further deterioration in crude oil later in the day.
Very short-term outlook: bearish
Short-term outlook: mixed with bearish bias
MT outlook: mixed
LT outlook: mixed
Trading position (short-term): Short. Stop-loss orders for crude oil and also for WTI Crude Oil (CFD): $102.95. We will keep you informed should anything change, or should we see a confirmation/invalidation of the above.
Thank you.
Nadia Simmons
Forex & Oil Trading Strategist
Forex Trading Alerts
Oil Investment Updates
Oil Trading Alerts
