

Based on Based on Oil Investment Update originally published on May 9, 2016, 11:47 AM
In the previous week, crude oil moved higher once again and re-tested the strength of the key resistance zone. Despite this improvement, oil bulls didn’t manage to hold gained levels, which resulted in another invalidation of earlier breakouts. What happened at the same time with oil stocks? Will they follow crude oil’s moves in the coming weeks? Let’s jump right into charts (chart courtesy of http://stockcharts.com) and find out what can we infer from them.
Let’s start today’s article with the long-term chart of oil stocks.
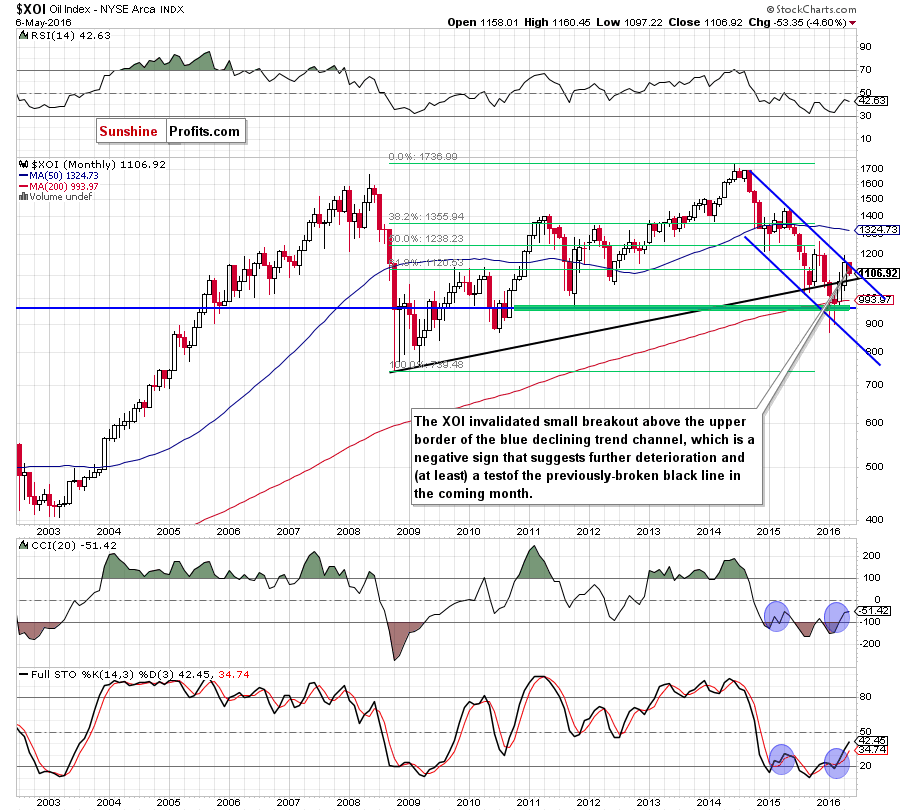
Looking at the monthly chart, we see that oil bulls push the XOI higher in the previous month, which resulted in invalidation of the breakdown under the long-term black resistance line. This positive signal triggered further improvement and oil stocks increased slightly above the upper border of the blue declining trend channel. Despite this improvement, oil bulls didn’t manage to hold gained levels, which resulted in a decline under this important resistance line. Earlier this month, we saw similar price action, but the index dropped once again, invalidating earlier breakout. This is a bearish signal, which suggests further deterioration and (at least) a test of the previously-broken black long-term support/resistance line (currently around 1,070) in the coming weeks.
Finishing today’s commentary on the long-term picture, we would also like to draw your attention to the current position of the monthly indicators. As you see, we saw similar signals at the beginning of Feb 2015. Back then, they didn’t trigger significant upward move, which suggests that they are not reliable enough.
Are there any other factors that could encourage oil bears to act? Let’s examine the weekly chart and find out what can we infer from it.
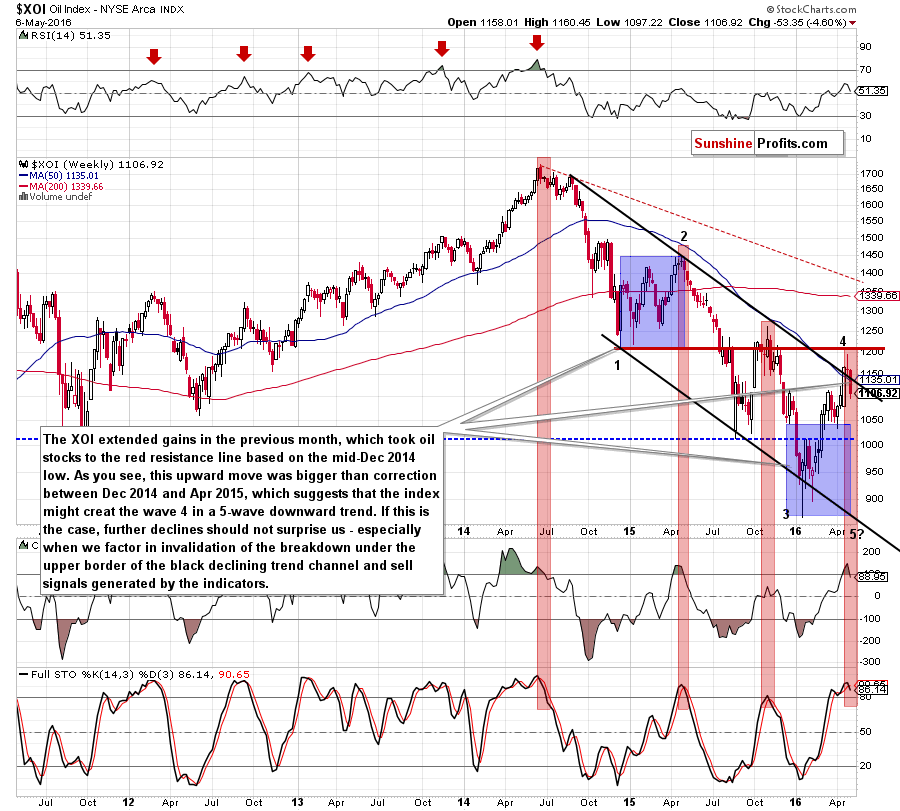
From this perspective, we see that the recent upward move took oil stocks to the red resistance line based on the mid-Dec 2014 low (the bottom of the potential first wave). As you see the upward move since Jan was much bigger than correction between Dec 2014 and Apr 2015, which suggests that the index might create a wave 4 in a 5-waves downward trend (according to Elliott wave theory).
If this is the case, further declines in the coming weeks should not surprise us – especially when we factor in sell signals generated by the CCI and Stochastic Oscillator. Is it more reliable than monthly indicator? In our opinion, it is, because all sell signals generated since 2014 preceded sizable downward moves, which increases the probability that we’ll see similar price action later this month.
Will the very short-term picture confirm this scenario? Let’s check the daily chart.
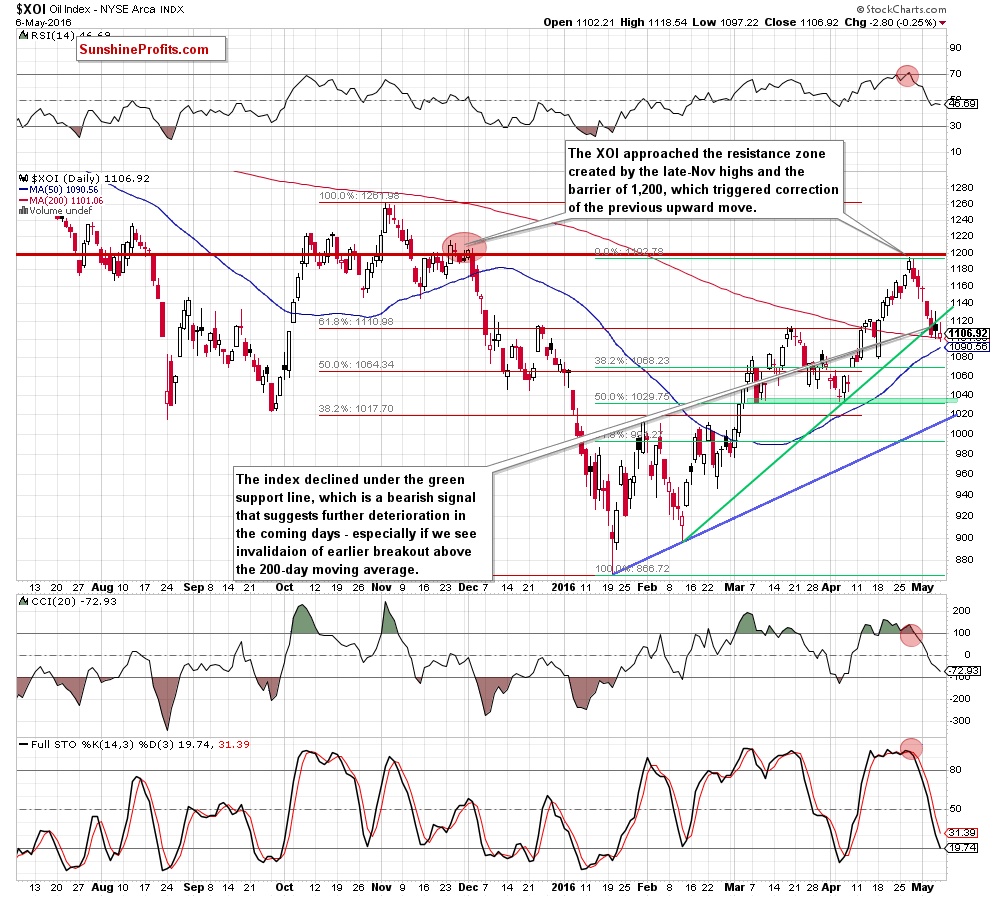
On the very short-term chart, we see that oil stocks extended gains since our previous Oil Investment Update was posted and approached the resistance zone created by the late-Nov highs and the barrier of 1,200, which triggered a correction of the earlier upward move. With this decline, the XOI dropped under the medium-term green support line, which is a bearish signal that suggests further deterioration - especially if we see invalidation of the breakout above the 200-day moving average. Additionally, sell signals generated by the indicators are still in play, supporting oil bears and lower prices. If this is the case and oil stocks move lower once again, the initial downside target would be around 1,032-1,038, where the green support zone and the 50% Fibonacci retracement level (based on the Jan-Apr rally) are.
Summing up, the resistance zone created by the late-Nov highs and the barrier of 1,200 triggered a correction, which took oil stocks not only under the medium-term green support line (seen on the daily chart), but also below the upper border of the long-term declining trend channel marked on the long- and medium-term charts. In this way, the XOI invalidated earlier small breakouts, which is a bearish signal that suggests further deterioration in the coming weeks. If you would like to know more about oil market and our interesting ratios, which gave valuable clues about market’s moves many times in the past, we encourage you to sign up for Oil Investment Update, Oil Trading Alerts or the All-Inclusive Package that includes them.
Thank you.
Nadia Simmons
Forex & Oil Trading Strategist
Oil Investment Updates
Oil Trading Alerts
