

U.S. consumer spending rose 0.3 percent in July. What does it mean for the gold market?
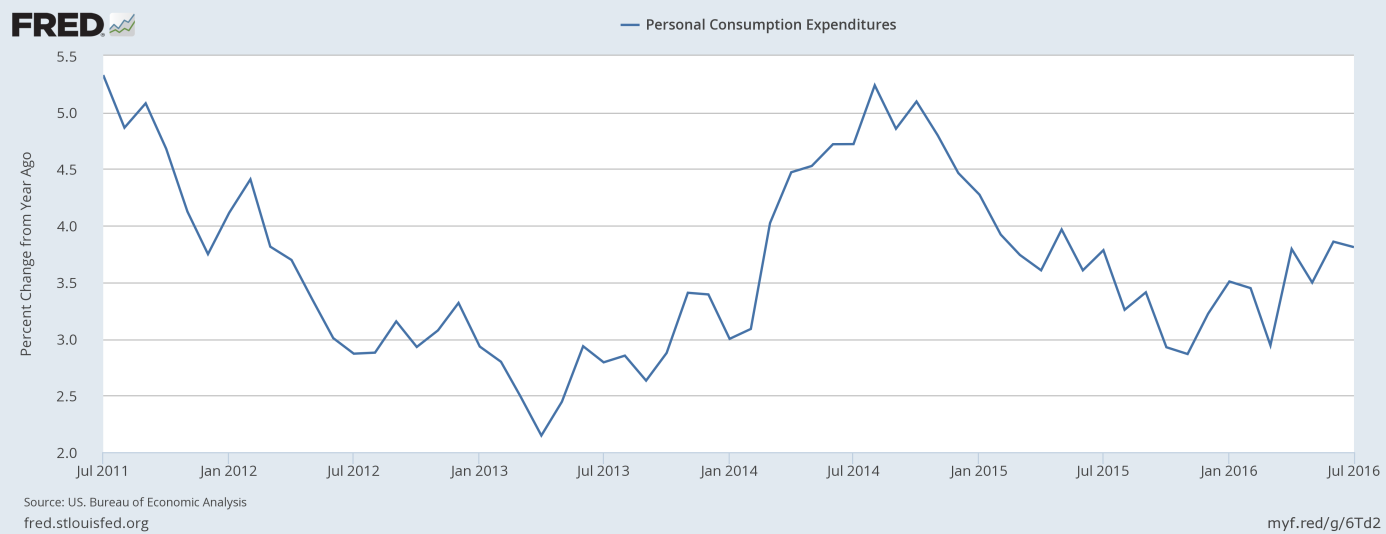
Personal consumption expenditures increased 0.3 percent last month after 0.5 percent rise in June. The jump was in line with expectations. It was the fourth relatively strong report in a row, which shows that household spending has picked up since the first quarter. The increase was driven by durable goods (mainly due to strong auto sales), while spending on non-durables declined due to price effects for energy. On an annual basis, consumer spending rose 3.8 percent and remained relatively strong, as one can see in the chart below.
Chart 1: Personal consumption expenditures from 2011 to 2016 (as percent change from year ago).
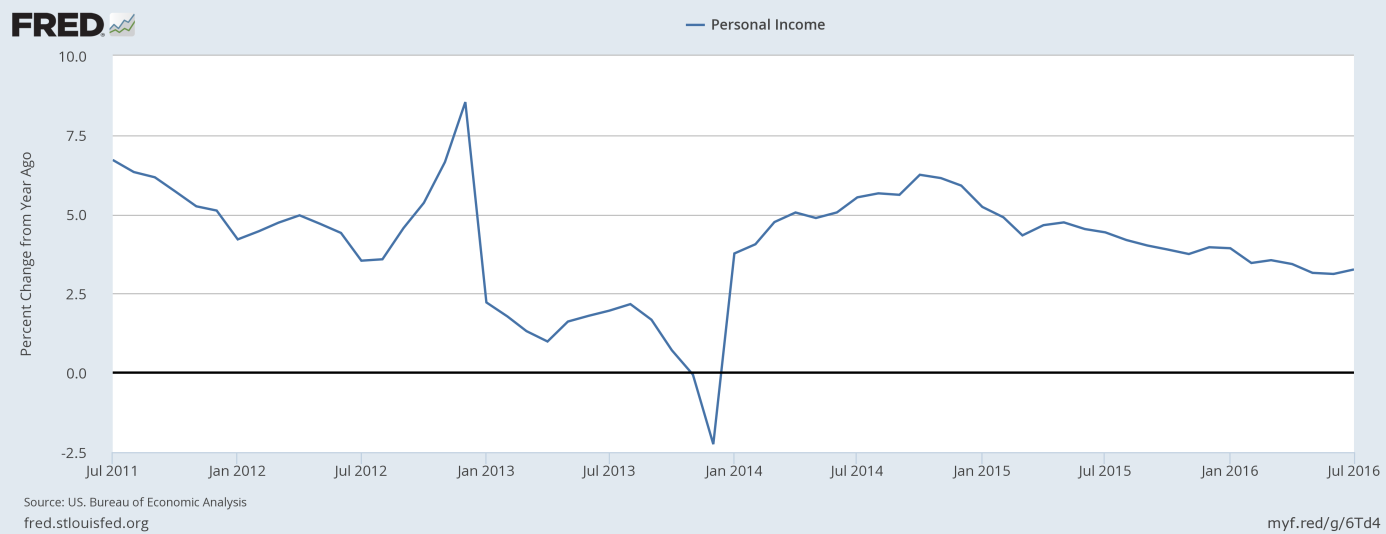
The strong consumer spending was partially possible by a gradual rise in incomes. Personal incomes jumped 0.4 percent in July, following a 0.3 percent increase in June. Importantly, incomes got another boost from wages and salaries, which rose 0.5 percent. However, on an annual basis, the pace of growth of personal income is slowing down, as one can see in the chart below.
Chart 2: Personal income over the last 5 years (as percent change from year ago).
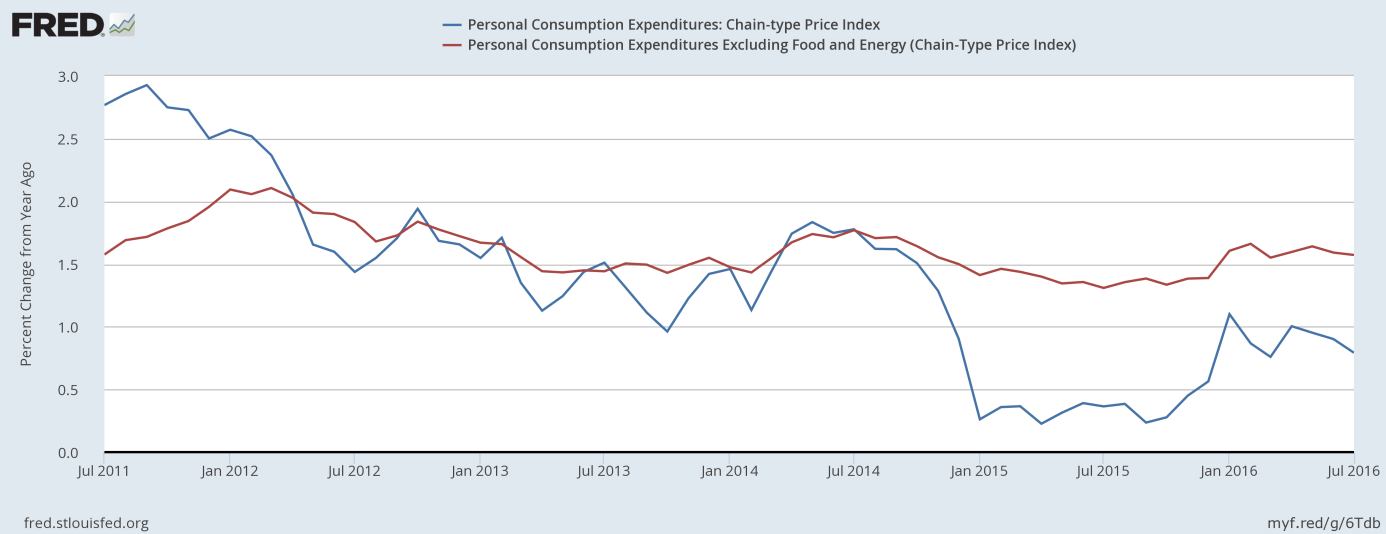
Price data still does not show any widespread inflationary pressure in the U.S. economy. The PCE price index was flat, while its core version ticked up 0.1 percent in July. On an annual basis, the Fed’s preferred inflation barometer increased 0.8 percent, while the core PCE rose 1.6 percent. It means that inflation pressure remained the same as in June, or even weakened slightly, as one can see in the chart below.
Chart 3: PCE Price Index (blue line) and Core PCE Price Index (red line) as percent change from year ago, from 2011 to 2016.
Summing up, household spending was strong in July, partially due to improving labor market and rising incomes. On the other hand, inflationary pressure remained absent. On balance, the report gives impression that the U.S. economy is on stable footing (especially that the report followed relatively strong data about orders for durable goods). Indeed, the GDPNow model forecast for real GDP growth in the third quarter of 2016 increased 0.1 percentage point to 3.5 percent after the release of data on personal income and outlays. Thus, although there is no inflation on the horizon, the report should strengthen the case for interest rate hike this year. Therefore, gold is likely to remain under downward pressure in the near future, unless we see a disappointing non-farm payrolls data on Friday.
If you enjoyed the above analysis, we invite you to check out our other services. We focus on fundamental analysis in our monthly Market Overview reports and we provide daily Gold & Silver Trading Alerts with clear buy and sell signals. If you’re not ready to subscribe yet and are not on our mailing list yet, we urge you to join our gold newsletter today. It’s free and if you don’t like it, you can easily unsubscribe.
Disclaimer: Please note that the aim of the above analysis is to discuss the likely long-term impact of the featured phenomenon on the price of gold and this analysis does not indicate (nor does it aim to do so) whether gold is likely to move higher or lower in the short- or medium term. In order to determine the latter, many additional factors need to be considered (i.e. sentiment, chart patterns, cycles, indicators, ratios, self-similar patterns and more) and we are taking them into account (and discussing the short- and medium-term outlook) in our trading alerts.
Thank you.
Arkadiusz Sieron
Sunshine Profits‘ Gold News Monitor and Market Overview Editor
Gold News Monitor
Gold Trading Alerts
Gold Market Overview
