
Based on the October 14th, 2013 Oil Investment Update
Without a doubt, oil investors are focusing now mostly on news out of Washington, because it could have the greatest impact on crude prices this week. During the last session we saw this impact very clearly. Light crude fell throughout the session as hopes for a deal to end the U.S. debt crisis steadily diminished, and finally lost over 1%. It’s worth noting that this is its lowest close since the beginning of July.
However, there is one more potential bearish development for crude prices - talks between Iran and western leaders in Geneva. In the past weeks any easing of tensions and the fact that Iran wants to negotiate about its nuclear program have had some downward effect. In this case, the main worry is that the negotiations and improving relations with Iran could mean that more than one million barrels of the country's oil will return to the global market.
From today’s point of view, it seems that the price of light crude will stay around the current range until an announcement on a debt deal is made and the outcome of a meeting between world powers and Iran over Tehran's disputed nuclear program is known.
Taking the above circumstances into account, investors are probably wondering what impact they had on oil stocks. Are they weaker or stronger in relation to crude oil? How does this relationship look like at the moment? Before we try to answer these questions, let’s take a look at the NYSE Arca Oil Index (XOI) charts to find out what the current situation in the oil stock market is. Let’s start with a look at the long-term chart (charts courtesy by http://stockcharts.com).
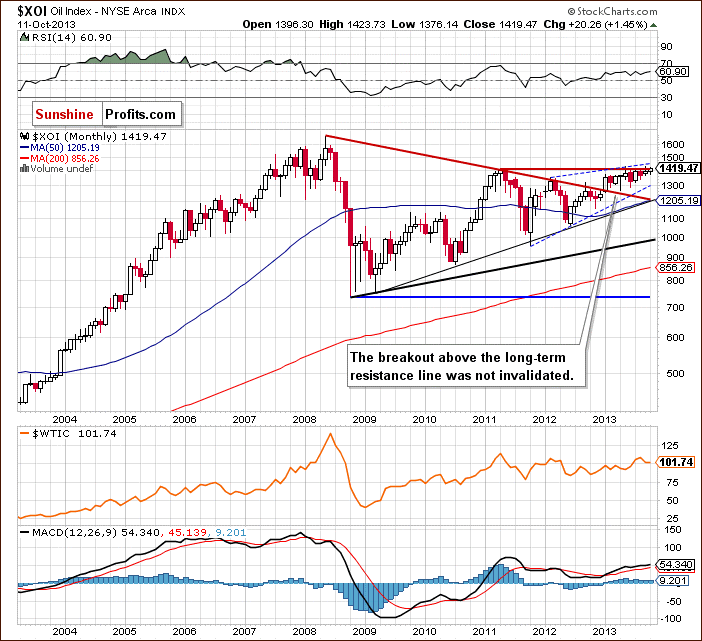
On the above chart we see that the XOI still remains above the previously-broken long-term declining resistance line based on the 2008 and 2011 highs and the breakout hasn’t been invalidated. The oil stock index also remains in the range of the rising trend channel.
At this point, it’s worth mentioning that the XOI came back above the May 2011 top. Therefore, taking these observations into account, the situation is still bullish.
To see this more clearly, let’s zoom in on our picture and move on to the weekly chart.
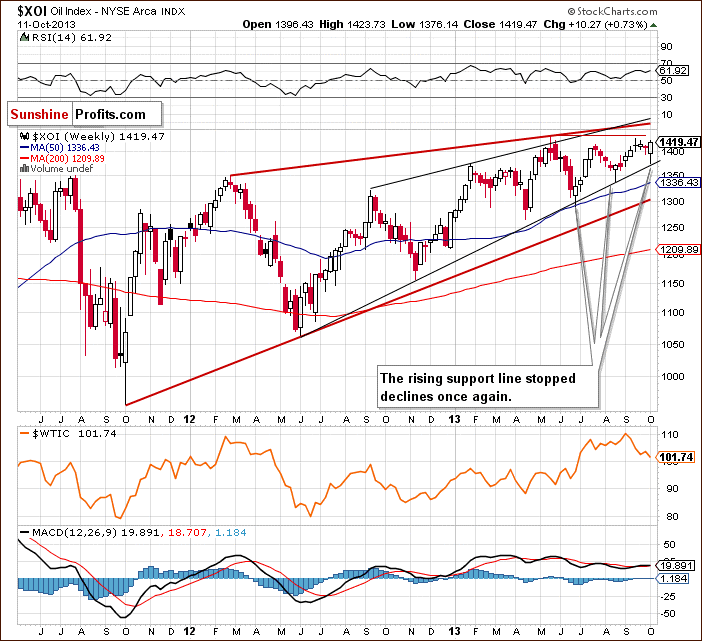
Looking at the above chart, we see that the oil stock index dropped to a weekly low at 1,376 in the previous week. However, this deterioration was only temporary and the XOI closed the whole week above 1,400 once again. On top of that, when we take into account weekly closing prices, we notice that this is the highest weekly close since June 2008.
Please note that the recent corrective move has taken oil stocks to the medium-term support line (marked in black), which is also the lower border of the rising wedge. As you see on the weekly chart this strong support line stopped declines once again. Taking this fact into account, further growth is quite likely.
However, keep in mind that the XOI is still close to the May top. The proximity of the above resistance level may encourage oil bears to go short once again and trigger a correction. In this case, the first support would be around 1,400 and the next one would be the medium-term support line (currently close to 1,380).
From this point of view, the medium-term uptrend is not currently threatened, and the situation remains bullish. It’s worth noting that even if the buyers manage to push the XOI higher, further increases may be restrained by the upper line of the rising wedge (currently close to 1,450).
At this point, we’ll focus on the relationship between light crude and the oil stocks.
When we take a look at the above charts and compare the price action in both cases, we clearly see that oil stocks were stronger in the previous week once again. Although, they dropped below 1,400, we saw a sharp pullback, which resulted in the highest weekly close since June 2008. What happened with the price of crude oil at the same time? Light crude declined and closed at its lowest level since June. Additionally, it dropped to a new October low, which clearly shows its weakness in relation to the oil stocks.
Now, let’s turn to the daily chart.
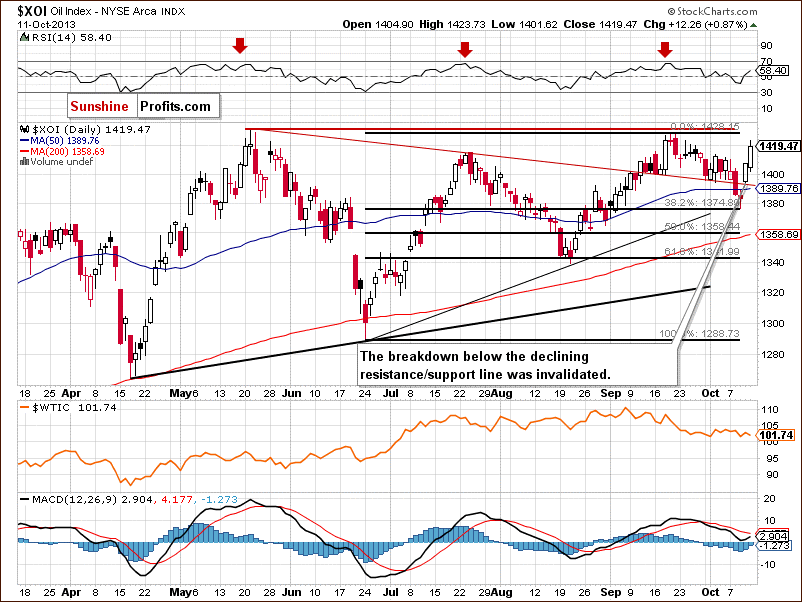
Looking at the above chart, we see that at the beginning of the previous week, sellers pushed the oil stock index not only below 1,400, but also below the declining resistance/support line based on the May and July highs. With this downward move the XOI reached the 38.2% Fibonacci retracement level based on the entire June-September rally (around 1,375).
This strong support level encouraged buyers to act and resulted in a pullback in the following days. In this way, the breakdown below the declining resistance/support line was invalidated. It’s worth noting that the recent increases took the XOI above its 50-day moving average, which is a bullish sign. Additionally, when we take a closer look at the above chart, we can see the morning star candlestick pattern. Earlier this week, all these positive circumstances resulted in further increases. Yesterday, the oil stock index broke above the September high and almost reached the May top. Although, this strong resistance zone encouraged sellers to take profits and the XOI moved lower, oil stocks remain on their track to higher levels.
Please note that the nearest support is the declining resistance/support line, which currently almost intersects with the 50-day moving average (around 1,390). This area is also reinforced by the already mentioned bullish candlestick pattern. The next support level is the 38.2% Fibonacci retracement level. Even lower, we have a support zone based on the Aug. 27 and Aug. 30 lows (1,361-1,364), and a further one based on the Aug. 21 bottom and the 61.8% retracement level (1,338-1,339).
Now, let’s comment on the relationship between the WTI and the XOI in the short term.
This time, we saw a negative correlation between light crude and the oil stocks. At the beginning of the previous week, there were declines, which pushed the oil stock index below the short-term declining support line, however, in case of crude oil we saw an upward move, which took it to the medium-term rising resistance line. Last Wednesday, after the XOI reached the 38.2% Fibonacci retracement level, we saw a sharp rebound, which triggered a rally in the following days. At the same time, crude oil tested this Fibonacci retracement and finally closed last week below it. Please note that earlier this week oil stocks continued their rally and yesterday they reached a new monthly high. Meanwhile, crude oil confirmed a breakdown below the 38.2% Fibonacci retracement level.
Summing up, from the long-, medium- and short-term perspectives the outlook for oil stocks remains bullish and the uptrend is not threatened at the moment. Taking into account the relationship between light crude and the oil stock index in the previous week (and also earlier this week), we clearly see that the oil stocks still remain stronger in relation to crude oil and it seems that they have greater upside potential than light crude itself at this moment.
If you'd like to read the full version of the above essay, I invite you to subscribe to my Oil Investment Updates (published weekly) and if you'd like to stay updated on a daily basis (and receive my direct trading suggestions), please consider subscribing to my Oil Trading Alerts. You can proceed using this link.
Thank you.
Nadia Simmons
Sunshine Profits' Crude Oil Expert
Oil Investment Updates
Oil Trading Alerts
