

Gold, silver and mining stocks moved higher yesterday, even though the USD Index moved higher as well, which had bullish implications. Based on the closing prices and the rally in mining stocks that took place in the second half of yesterday’s session, it seems that closing our extra-large short positions and taking profits off the table early in the session was a good idea. However, that’s not the only thing that changed in the precious metals market and the area surrounding it – some signs are not as clear, but just as important. Let’s take a closer look at the charts for details (charts courtesy of http://stockcharts.com).
The first chart features the breakout in the Nikkei 225 Index.
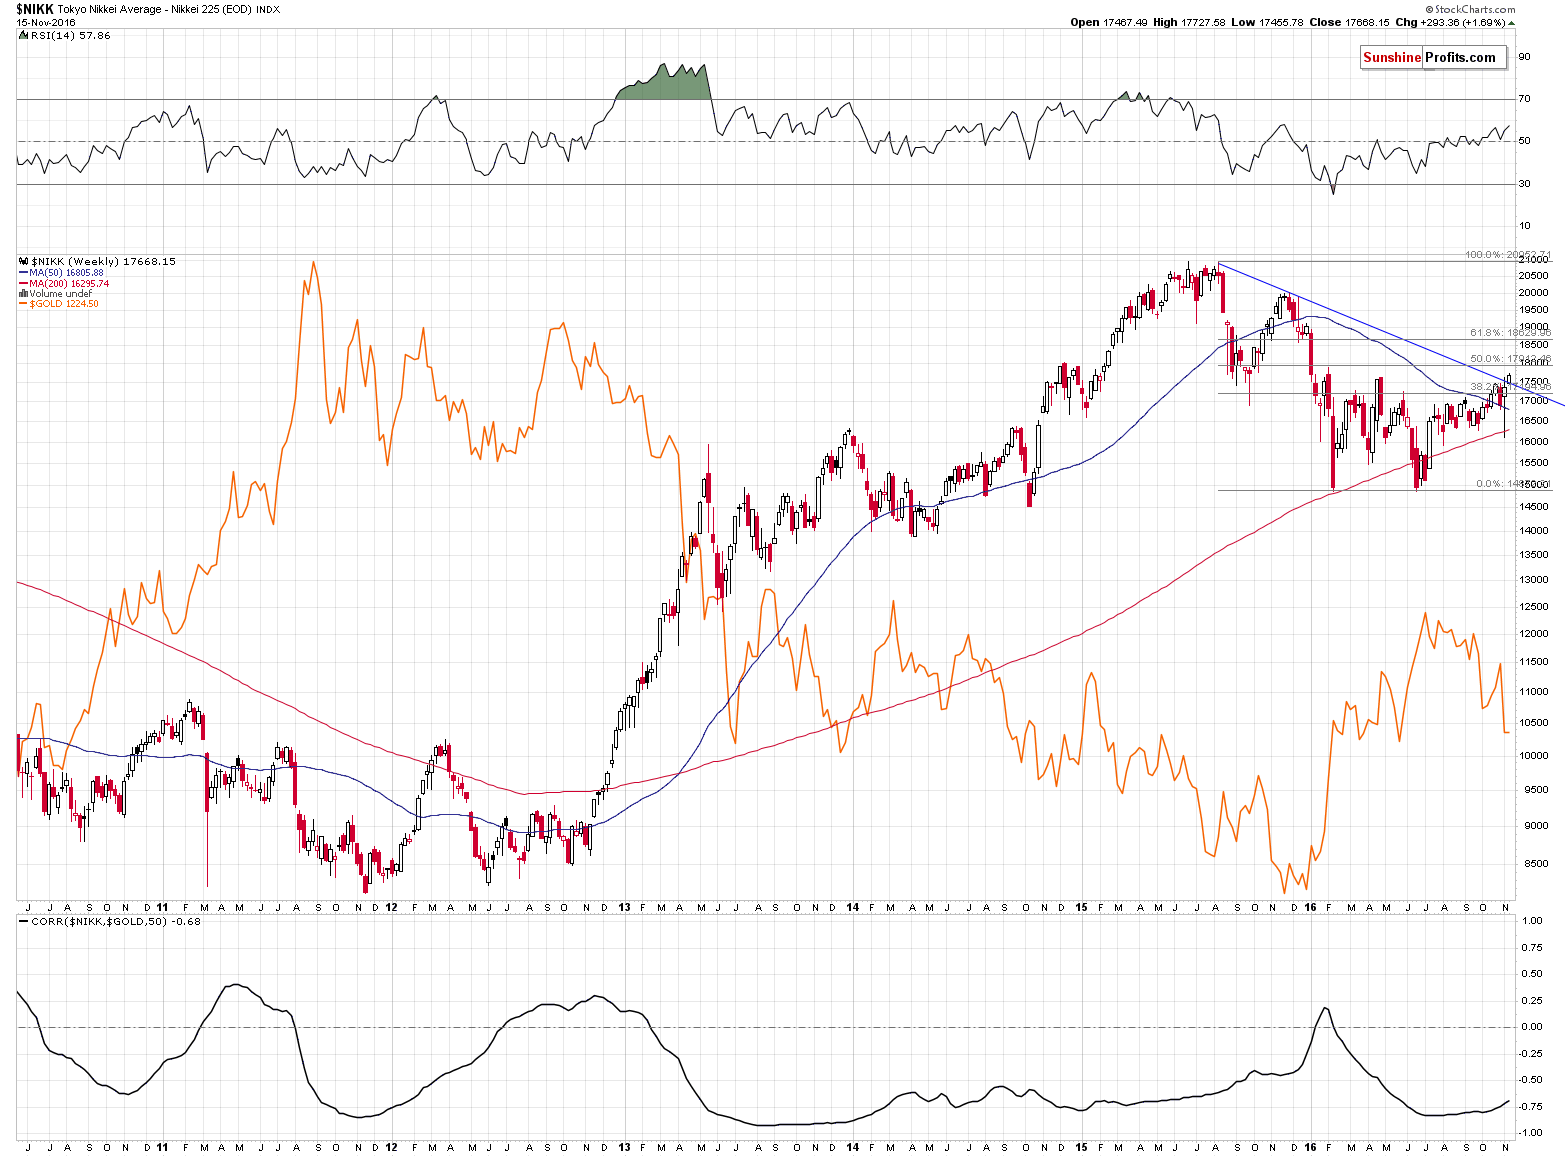
Why should one care about the above chart at all? Because the Nikkei has been strongly negatively correlated with gold. The strength of the phenomenon has been the strongest since 2012, but it’s also been present previously. The major tops and bottoms in the Japanese stocks and gold are not perfectly aligned, but they do correspond to each other, more or less.
Why is this correlation significant? Well, correlation doesn’t necessarily imply causation, but since both markets are connected to the Japanese yen, it doesn’t seem that the correlation is accidental. Consequently, a bullish outlook for Japanese stocks makes the outlook for the gold price bearish.
The thing is that we just saw an important breakout (above the declining blue resistance line) in the Nikkei and thus, the outlook just became bullish from the technical point of view. This doesn’t need to have immediate bearish implications for gold and the rest of the precious metals market, but it does suggest that the next big move is likely to be to the upside in the case of the Nikkei and to the downside in the case of gold.
Another thing that is not often discussed is the link between the financial stocks and gold.
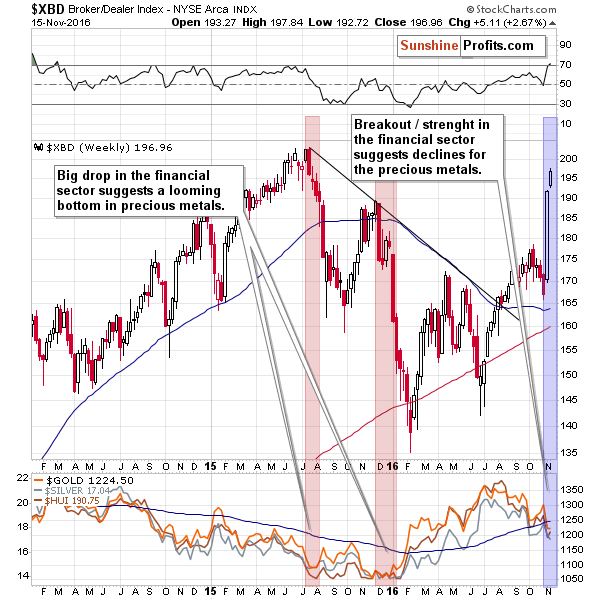
In the past 3 years there were 3 big price swings in the case of the financial sector. The first 2 took place in the middle of 2015 and at its end. In both cases the moves were big downswings and their early parts heralded that a big move higher in gold was just around the corner. In the case of the former move, we had to wait for the rally in precious metals for several months, but still – it happened. This is significant, because the opposite is taking place right now. Additionally, please note that the breakout in financial stocks in the middle of 2016 corresponded to the top in the precious metals sector.
Financials soared last week and the move higher continues this week. Just as the 2015 declines had bullish implications for gold, we now have bearish implications. The effect doesn’t have to be immediate, but it is a good indication that gold is likely to decline in the following weeks, regardless of what happens in the following days.
Finally, we would like to discuss the ratio between the XAU Index (it includes both gold stocks and silver stocks) and the general stock market.
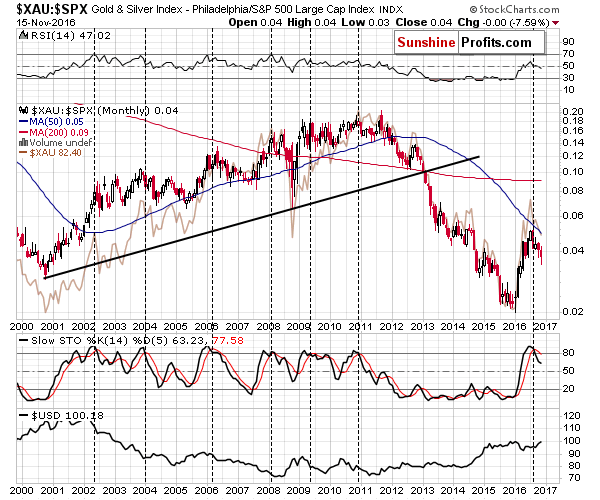
The key thing on the above chart is the Stochastic indicator based on the ratio. Almost every time since the bull market in the precious metals sector started, the indicator’s sell signal close to the 80 level was followed by a big decline in precious metals mining stocks. The only exception was seen in 2009, but please note that the signal was far from being clear at that time. Right now, we almost have the signal that is very clear, with significant bearish implications. We “almost” have it, as the above is based on the monthly candlesticks and the month is not over yet. Still, with a signal this significant, it would take a big rally in mining stocks and/or a big decline in the general stock market for the signal to be invalidated and both seem unlikely at this time. If nothing happens or if we see only a small rally in mining stocks, it’s likely that the signal will remain in place anyway and the bearish implications will remain in place.
Summing up, it seems that the outlook for the precious metals market remains bearish for the following weeks, but it’s no longer bearish for the following days. The relative strength of gold, silver and mining stocks compared to the rally in the USD Index has bullish implications and so does the mining stocks’ strength relative to gold. Consequently, it seems that our yesterday’s decision to take profits off the table and wait for additional bearish signs before re-opening a short position (or for multiple bullish signs before opening a long position) was correct. The analogy to 2013 continues to suggest that the next big move will be to downside and the charts featured today confirm this outlook, but caution is advised in the very short term.
The above estimations are based on the information that we have available today (Nov. 16, 2016). We will be monitoring the market for opportunities and report to our subscribers accordingly. If you'd like to join them, please use this link to subscribe now.
Thank you.
Sincerely,
Przemyslaw Radomski, CFA
Founder, Editor-in-chief, Gold & Silver Fund Manager
Gold & Silver Trading Alerts
Forex Trading Alerts
Oil Investment Updates
Oil Trading Alerts
