

Gold & Silver Trading Alert originally sent to subscribers on April 6, 2016, 8:06 AM
Briefly: In our opinion, speculative short positions (150% of the full position) in gold, silver and mining stocks are justified from the risk/reward point of view.
Gold moved higher yesterday, but it doesn’t seem that it had a major impact on even the short-term outlook as even the short-term resistance line wasn’t broken. Consequently, the previous trends remain in place. Let’s take a look at the details, starting with the long-term gold chart (charts courtesy of http://stockcharts.com).
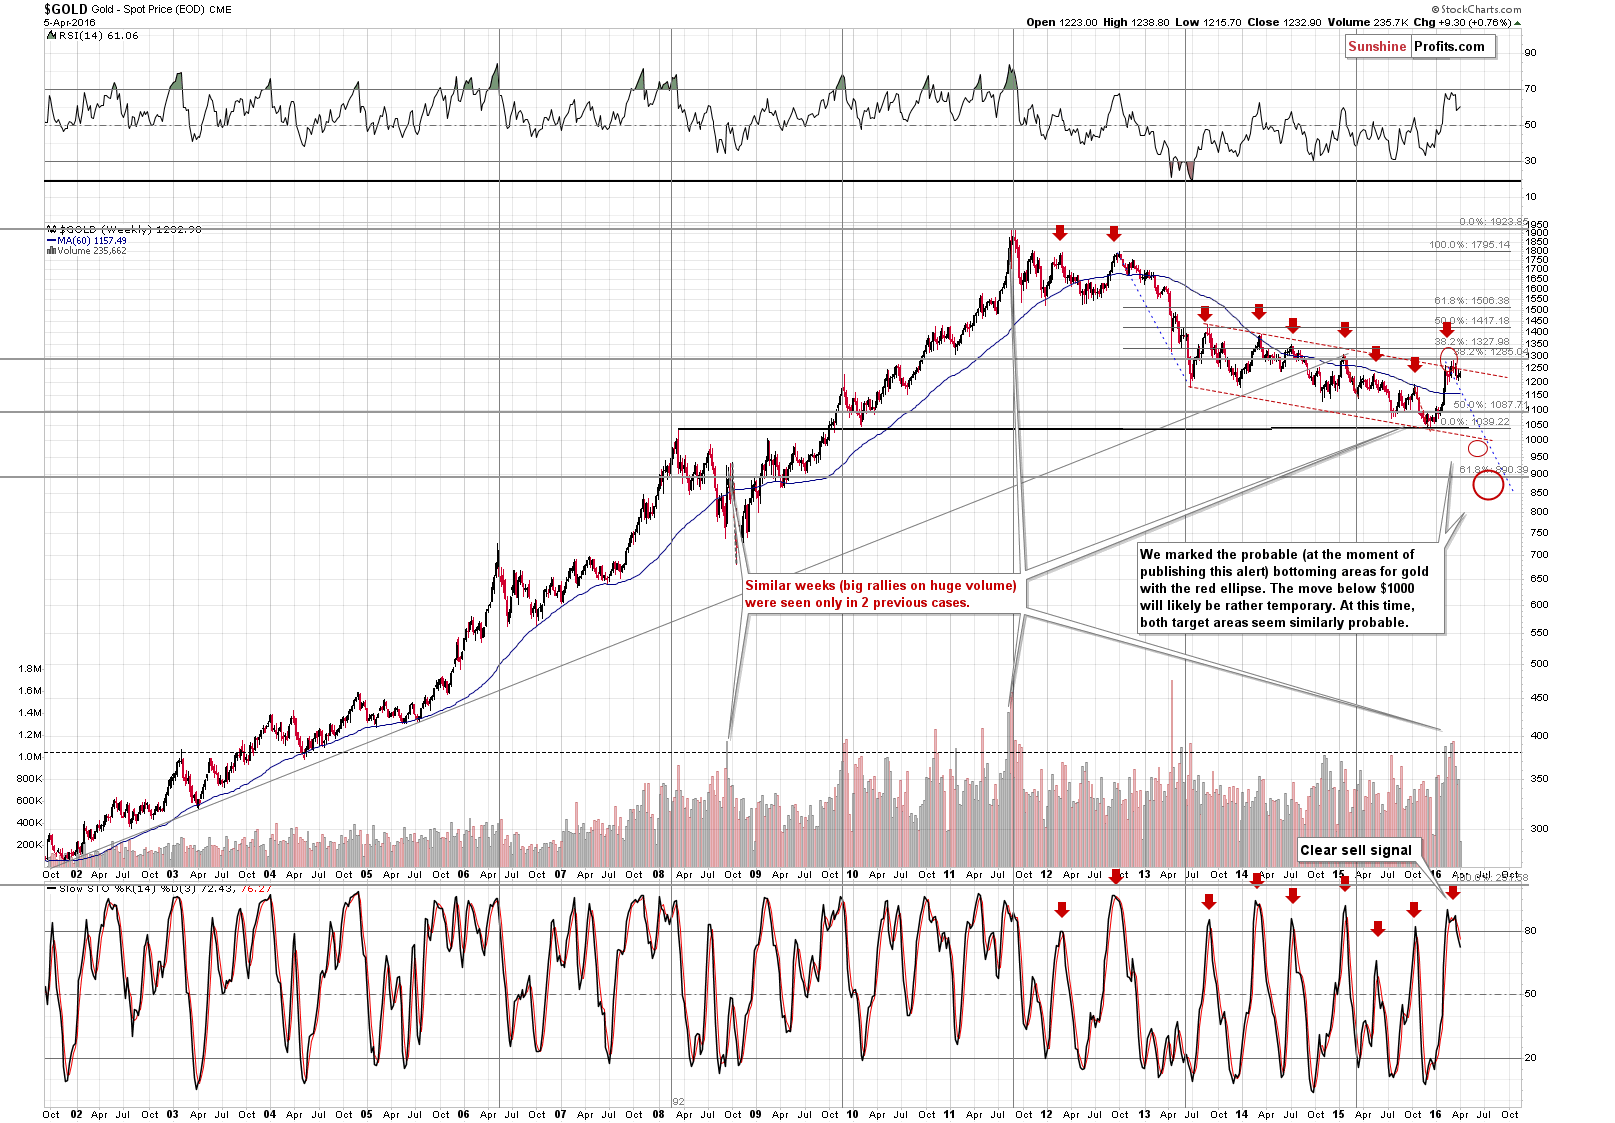
Once again nothing changed from this perspective and what we wrote previously about the above chart remains up-to-date:
(…) the outlook remains just as it was before this week began – it remains bearish.
The sell signal from the Stochastic indicator remains clearly visible and gold remains within the declining trend channel.
(…)
Although this year’s rally might seem big, gold actually didn’t even manage to move to the 38.2% Fibonacci retracement based on the 2012 – 2015 decline. Consequently, this year’s rally seems to be nothing more than just a correction within a bigger downtrend.
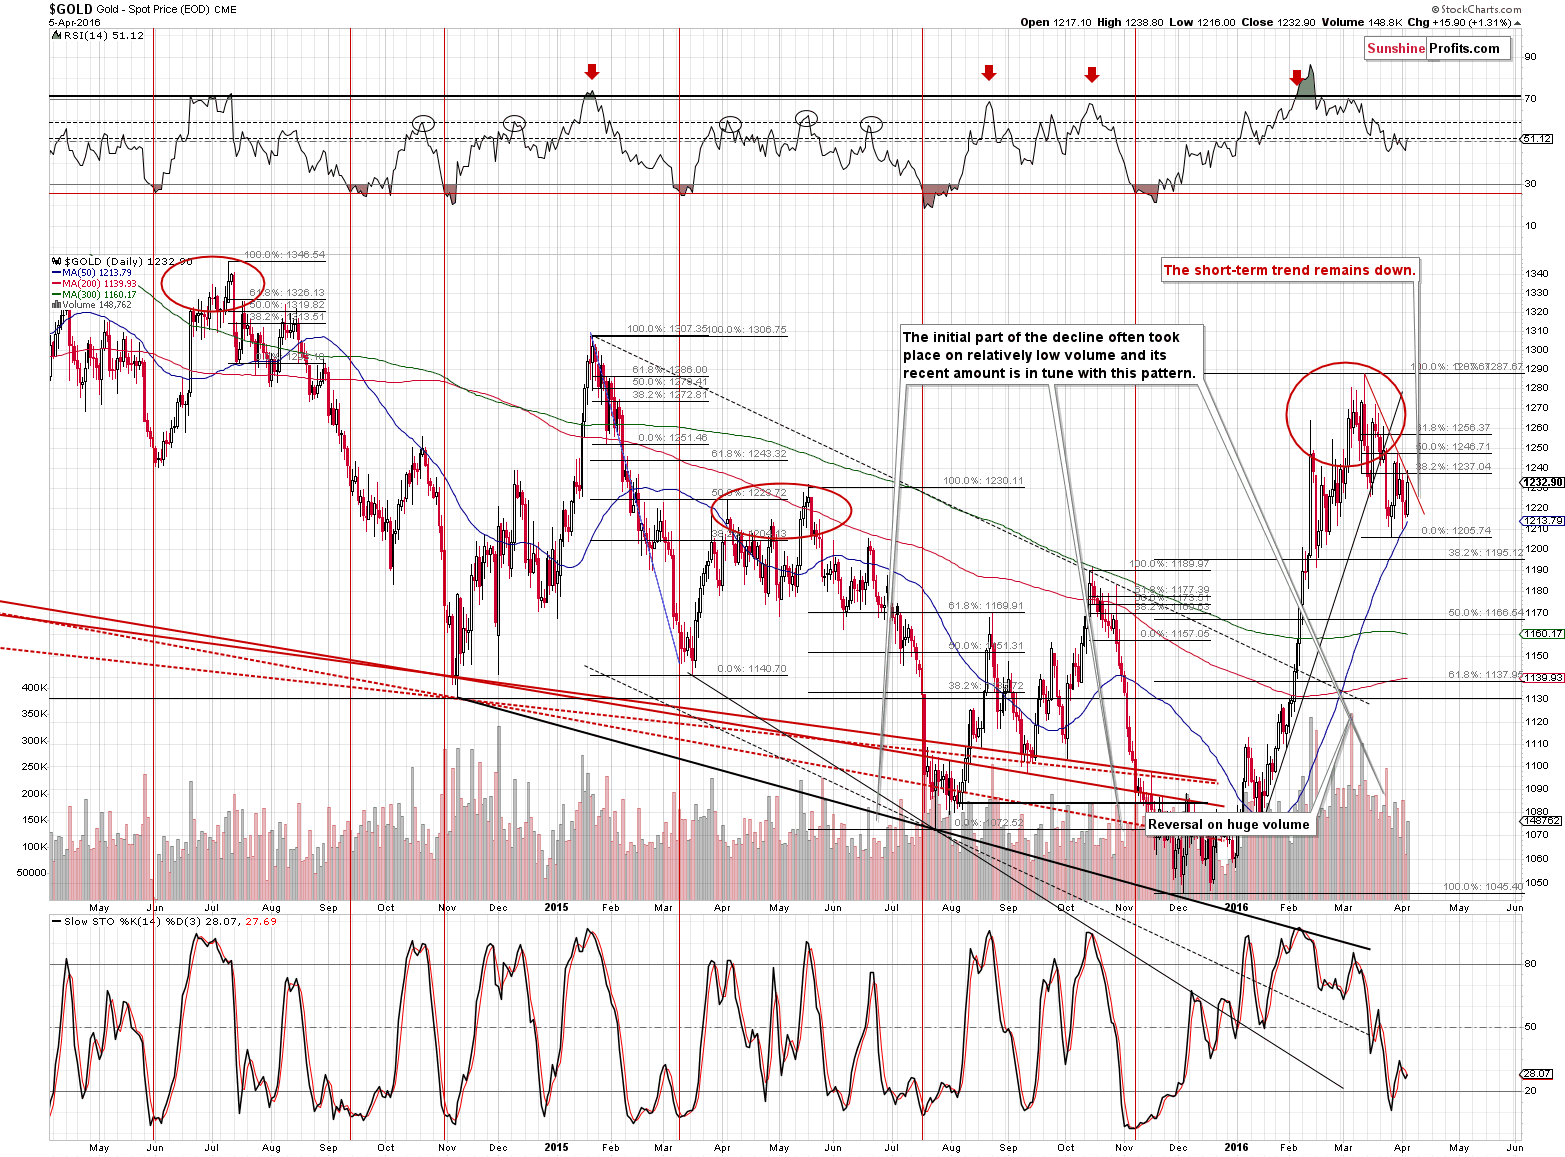
As far as the short term is concerned, we previously wrote the following:
(…), the trend remains down as well. Gold declined and practically erased Tuesday’s rally. The market participants seem to have realized that actually nothing changed based on Yellen’s recent comments and things are returning to normal after some very short-term volatility. (…), the previous downtrend remains in place.
Why a downtrend? Most importantly, because a downtrend is visible on the long-term gold chart, but also because the rising black short-term support line was clearly broken and this breakdown was more than verified.
Now, let’s move to what happened yesterday. Gold moved briefly to $1,238.80, but ended the session at $1,232.90 – below the $1,235 - $1,237 range. That’s important because that’s where we have the declining red resistance line and the 38.2% Fibonacci retracement level. Without a breakout above this level, nothing has changed from the technical perspective, so today’s rally still appears to be nothing more than a correction within a downtrend.
In yesterday’s Gold Trading Alert, we wrote about the gold price in terms of the Japanese yen and today’s we’d like to get back to this topic in order to show that yesterday’s session didn’t change anything.
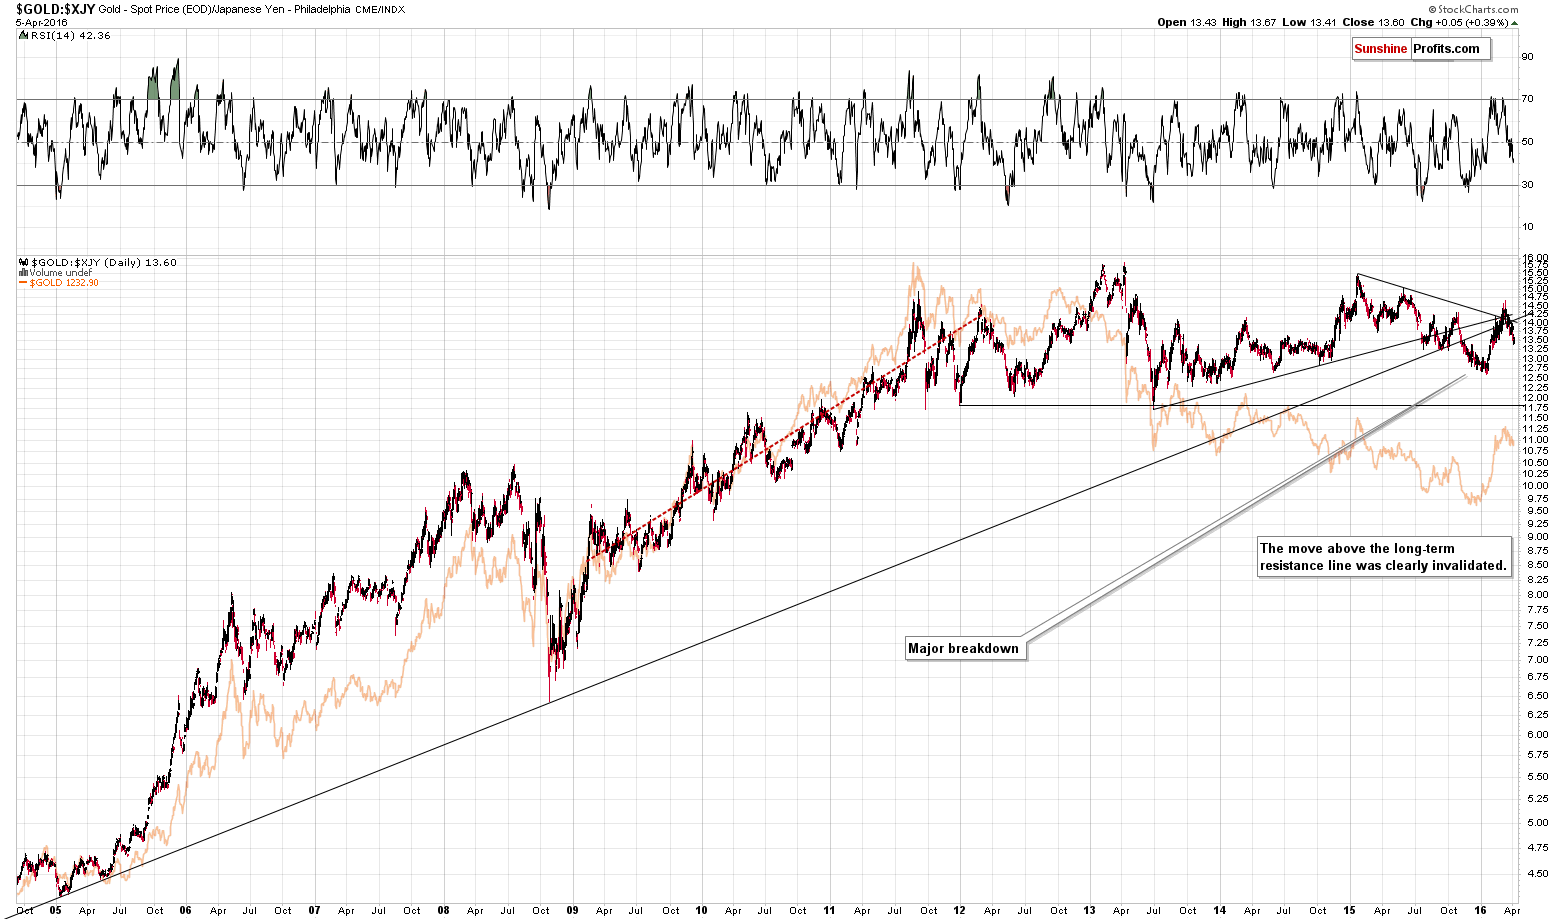
The above chart continues to have clearly bearish implications for the medium term and the reason is that we see a very clear invalidation of a few small breakouts. Most importantly, gold invalidated the breakout above the rising long-term support / resistance line (the one based on the 2005 and 2008 bottoms). These are clear bearish signs with medium-term implications.
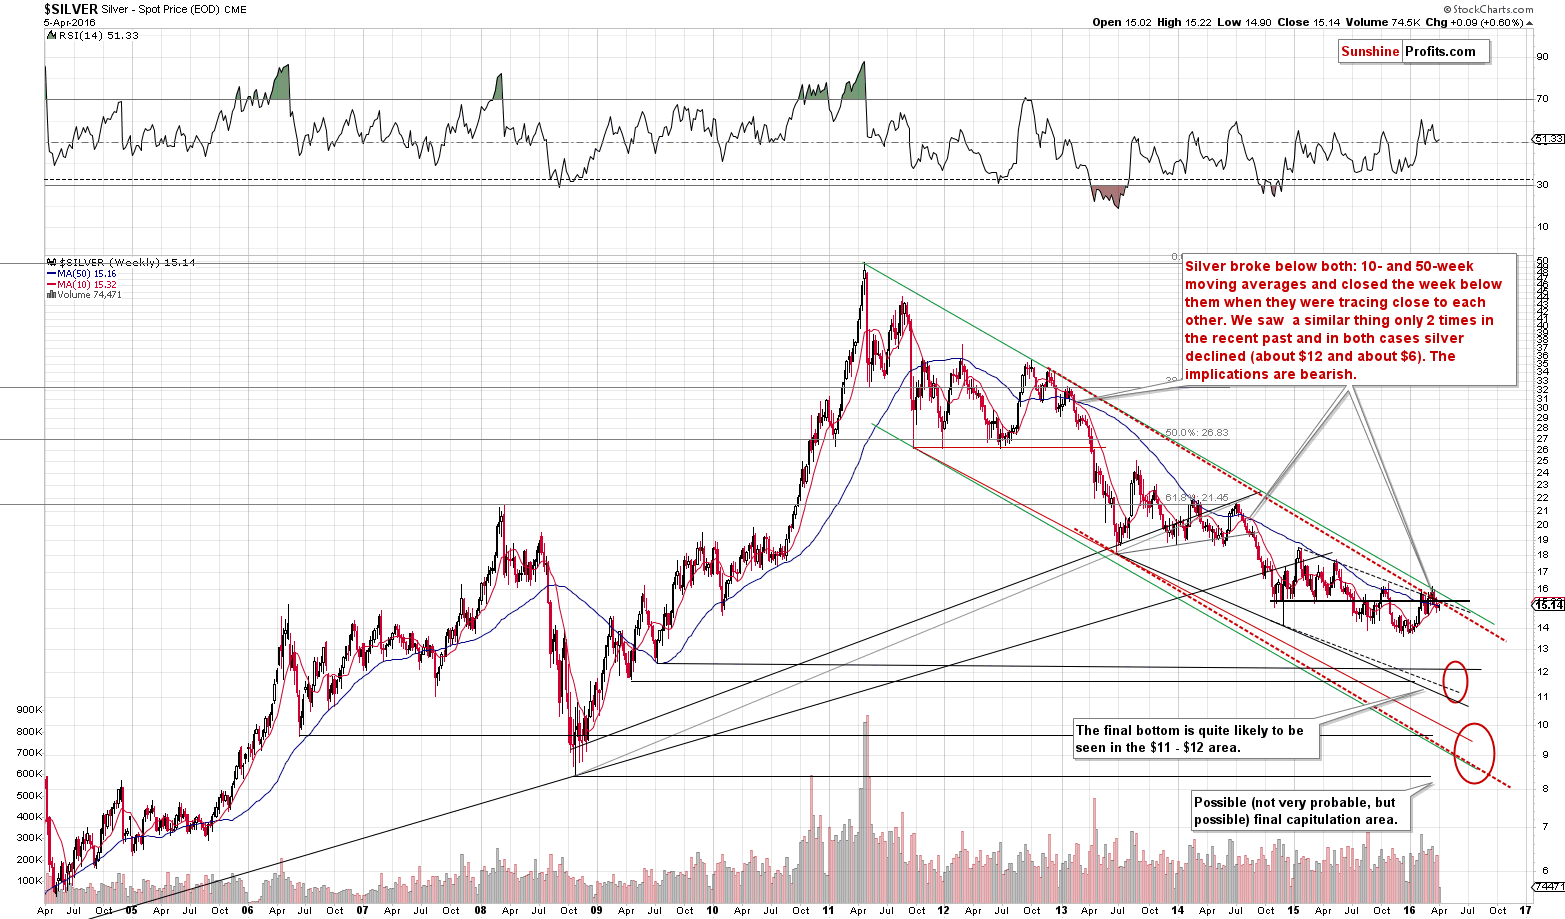
As far as silver is concerned, not much changed this week, and the most important signal is based on last week’s closing prices. We saw the decline’s continuation and, most importantly, we saw a breakdown below both the 10-week and 50-week moving averages (this week silver moved close, but not back above them). This is so important, because the last 2 times when we saw such breakdowns and both of them were close to each other, silver declined $12 and $6, respectively. Naturally, the implications are bearish - it appears that silver is about to move much lower in the coming weeks.
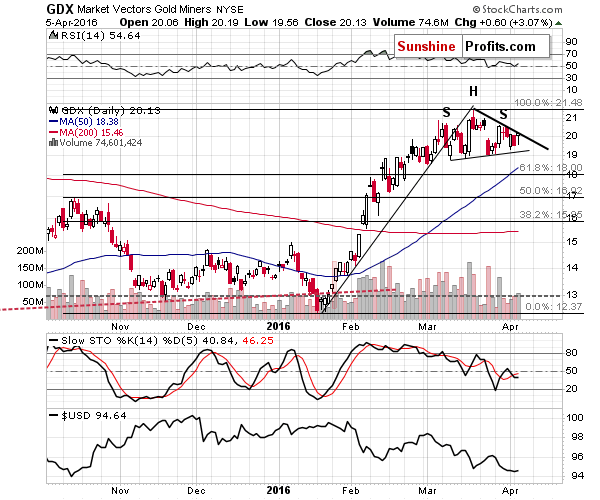
As far as mining stocks are concerned, well, once again nothing changed based on what happened yesterday. Miners are below the short-term resistance line, below the previous rising line and continue to form the head-and-shoulders top pattern. This pattern – if completed – would likely mark the start of the acceleration in the decline. Once we see a confirmed breakdown below the neck level (either a big move below the neck level on significant volume or 3 consecutive closes below this level), the bearish outlook for miners would become even more bearish.
Summing up, there are signs that the precious metals market is going to move lower in the coming weeks. The ones discussed above, plus those that we commented on in the previous days and weeks, make it very likely that the next big move in the precious metals sector will be to the downside. In other words, we expect that the best buying opportunity for long-term investments in the precious metals is still ahead. Moreover, it appears very likely that the profits on the current short trade will become much bigger before this trade is over. We’ll continue to monitor the situation and report daily in our alerts. There is a 7-day free trial to our Gold & Silver Trading Alerts, which you automatically get after signing up for our free gold newsletter. Again, it’s free and if you don’t like it, you can always cancel. Sign up today.
Thank you.
Sincerely,
Przemyslaw Radomski, CFA
Founder, Editor-in-chief, Gold & Silver Fund Manager
Gold & Silver Trading Alerts
Forex Trading Alerts
Oil Investment Updates
Oil Trading Alerts
