
Gold & Silver Trading Alert originally sent to subscribers on December 29, 2014, 7:17 AM.
Briefly: In our opinion no speculative short positions in gold, silver and mining stocks are currently justified from the risk/reward perspective.
The USD Index moved slightly above the key, long-term resistance level but gold rallied by almost $20 on Friday. We have seen several bearish signs in the precious metals market recently – is the above bullish enough to make the overall outlook for the precious metals market bullish?
Not really. Gold didn’t move above the previous resistance levels, so actually not much changed and most of what we wrote last week remains up-to-date. Let’s start today’s analysis with the USD Index (charts courtesy of http://stockcharts.com).
In the previous alert we wrote the following:
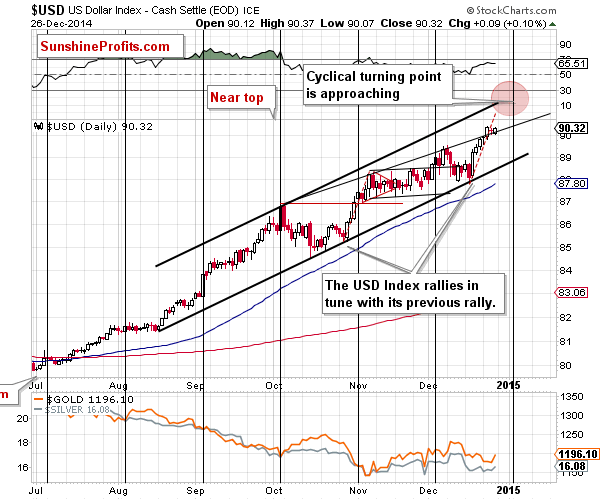
The USD Index moved higher only insignificantly, and we don’t see much change on the short-term chart. One could argue whether there was a short-term breakout or not, but even if we agree that there indeed was one, it’s not confirmed. Consequently, the short-term picture doesn’t provide us with much new information.
The USD Index closed the week above 90 and also above the rising short-term resistance line, so the short-term breakout is confirmed. The implications for the next several days are bullish.
Let’s take a look at the situation in the USD Index from the very long-term perspective.
In the previous alert we wrote the following:
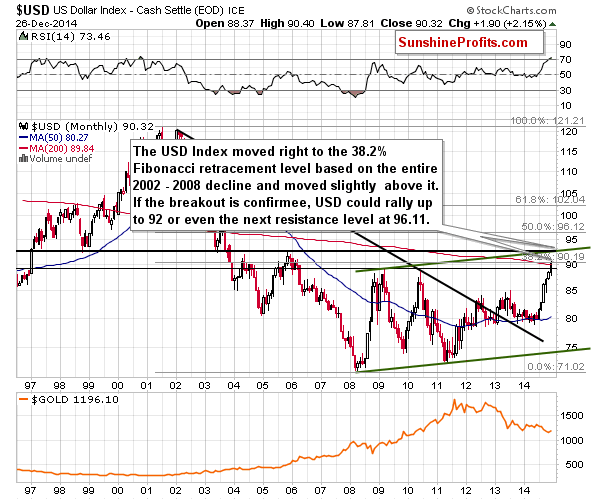
The USD Index has just encountered a major resistance line that it needs to surpass before a rally to 92 becomes very probable – the 38.2% Fibonacci retracement levels based on the entire 2002 – 2008 decline.
The Fibonacci retracements have worked for the USD Index many times in the past, so it could be the case that this level will keep the rally in check for some time. If not, and we see a confirmed breakout, then we’ll likely see another big rally – to the 92 level or perhaps even to the next retracement at 96.11.
However, we would first need to see the breakout and its confirmation. For now, we have just seen a move to this critical level. While the situation in the precious metals market remains bearish, without a breakout in the USD Index, the possibility of another slide in the USD and a rally in gold, silver and mining stocks will be too big for us to think that opening short positions in the precious metals sector is justified from the risk to reward perspective.
The USD Index closed the week above the critical resistance level (the 38.2% Fibonacci retracement level), but it closed only a little above it and for just one day, so the breakout is not confirmed at this time. Consequently, we don’t think that the move to 92 or higher is very probable for the USD Index at present. The implications for the precious metals market remain rather unclear at this time.
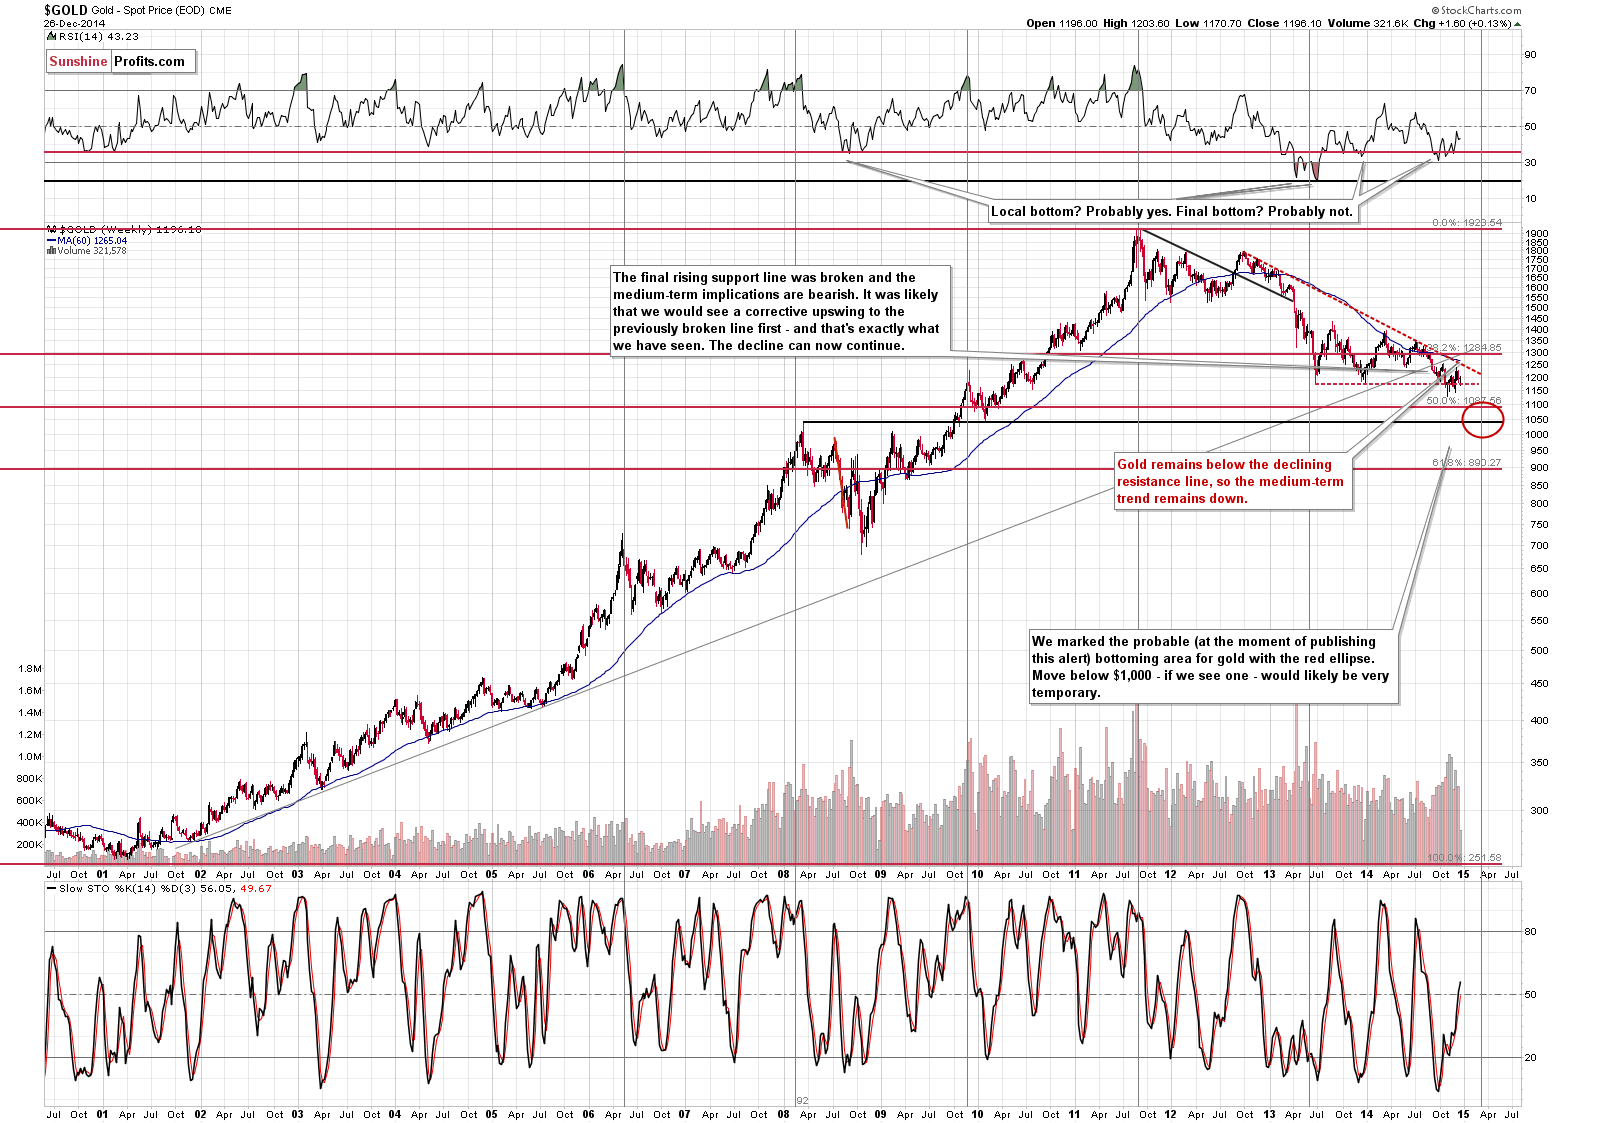
The long-term picture for gold remains unchanged. Last week’s events didn’t change much as gold ended the week below $1,200 and well below the declining resistance line. The medium-term trend remains down.
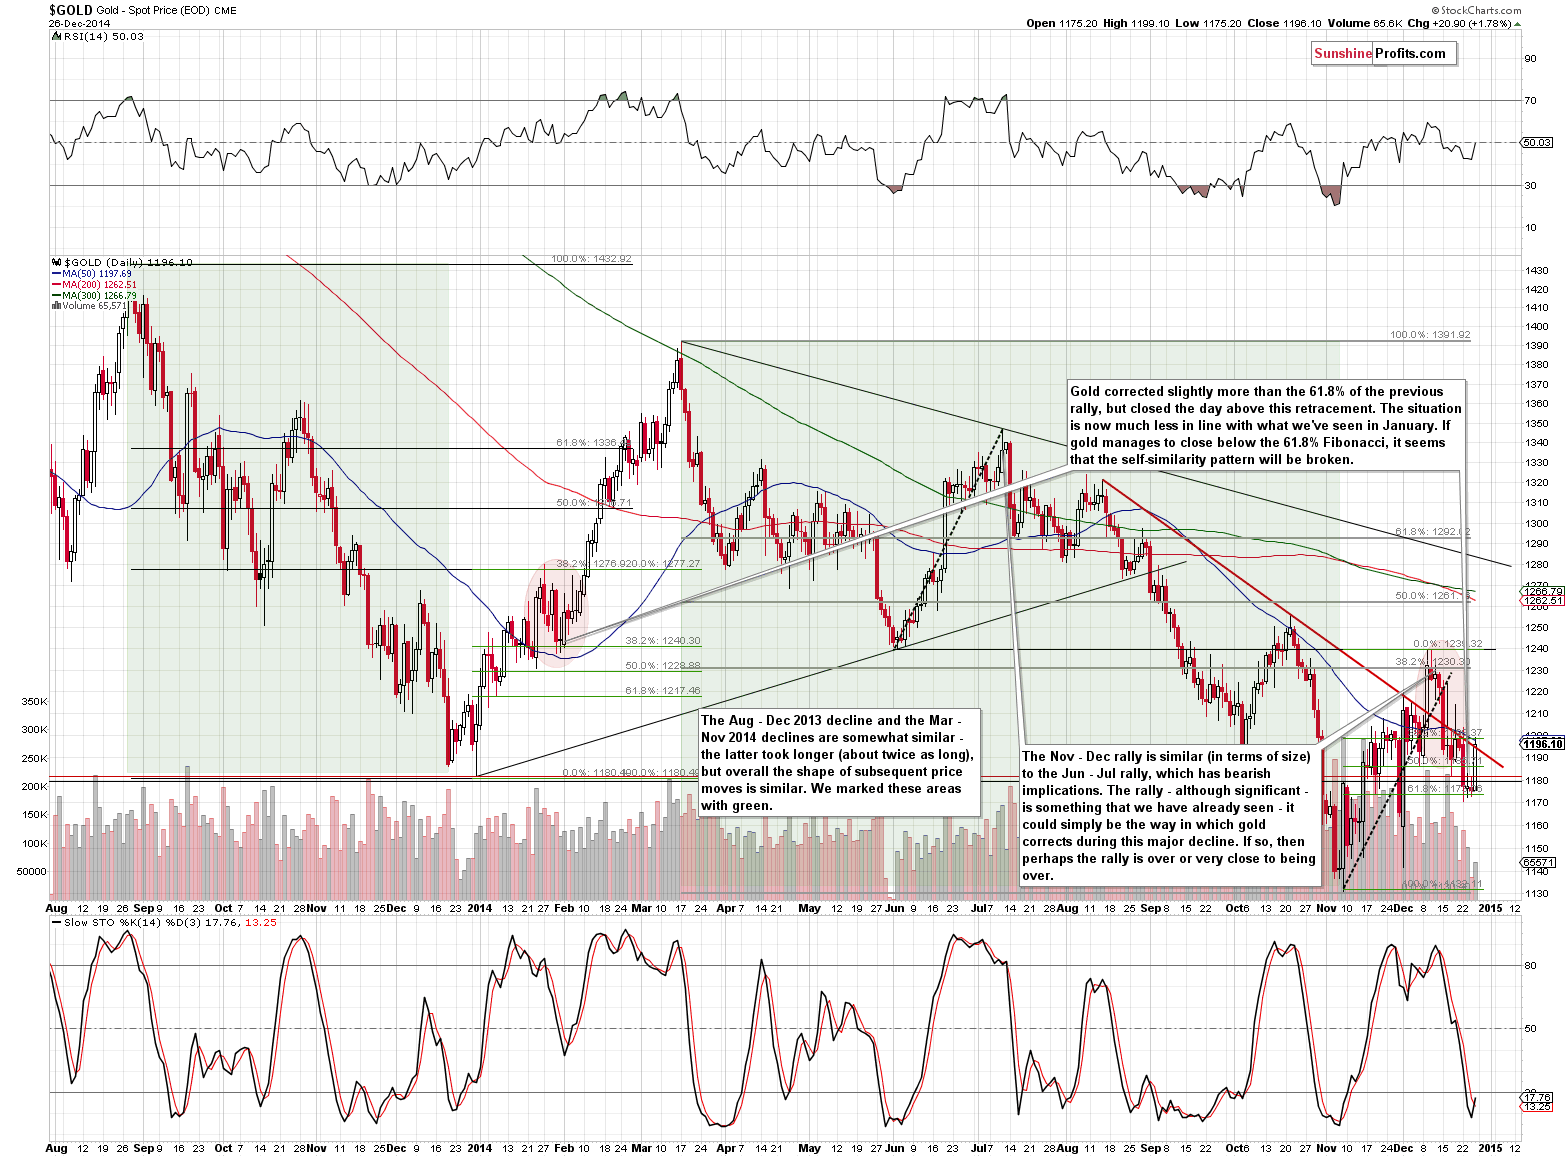
The short-term price action didn’t change much either. The previously-mentioned self-similar pattern could still be in place – the current situation is still somewhat similar to what we saw in January 2014. This means that based on the above chart alone we could see a rally in the coming days.
Please note that gold rallied on very low volume, but that was a low-volume session across the board due to the Holiday season. Consequently, while low-volume rally would be a bearish sign in normal case, at this time there are no such implications.
Moreover, there was a buy signal from the Stochastic indicator, which of course is a bullish sign, but on the other hand, there was no breakout above the declining red resistance line.
Overall, the above chart is more bullish than it was last week, but not bullish enough to justify opening long positions based just on it.
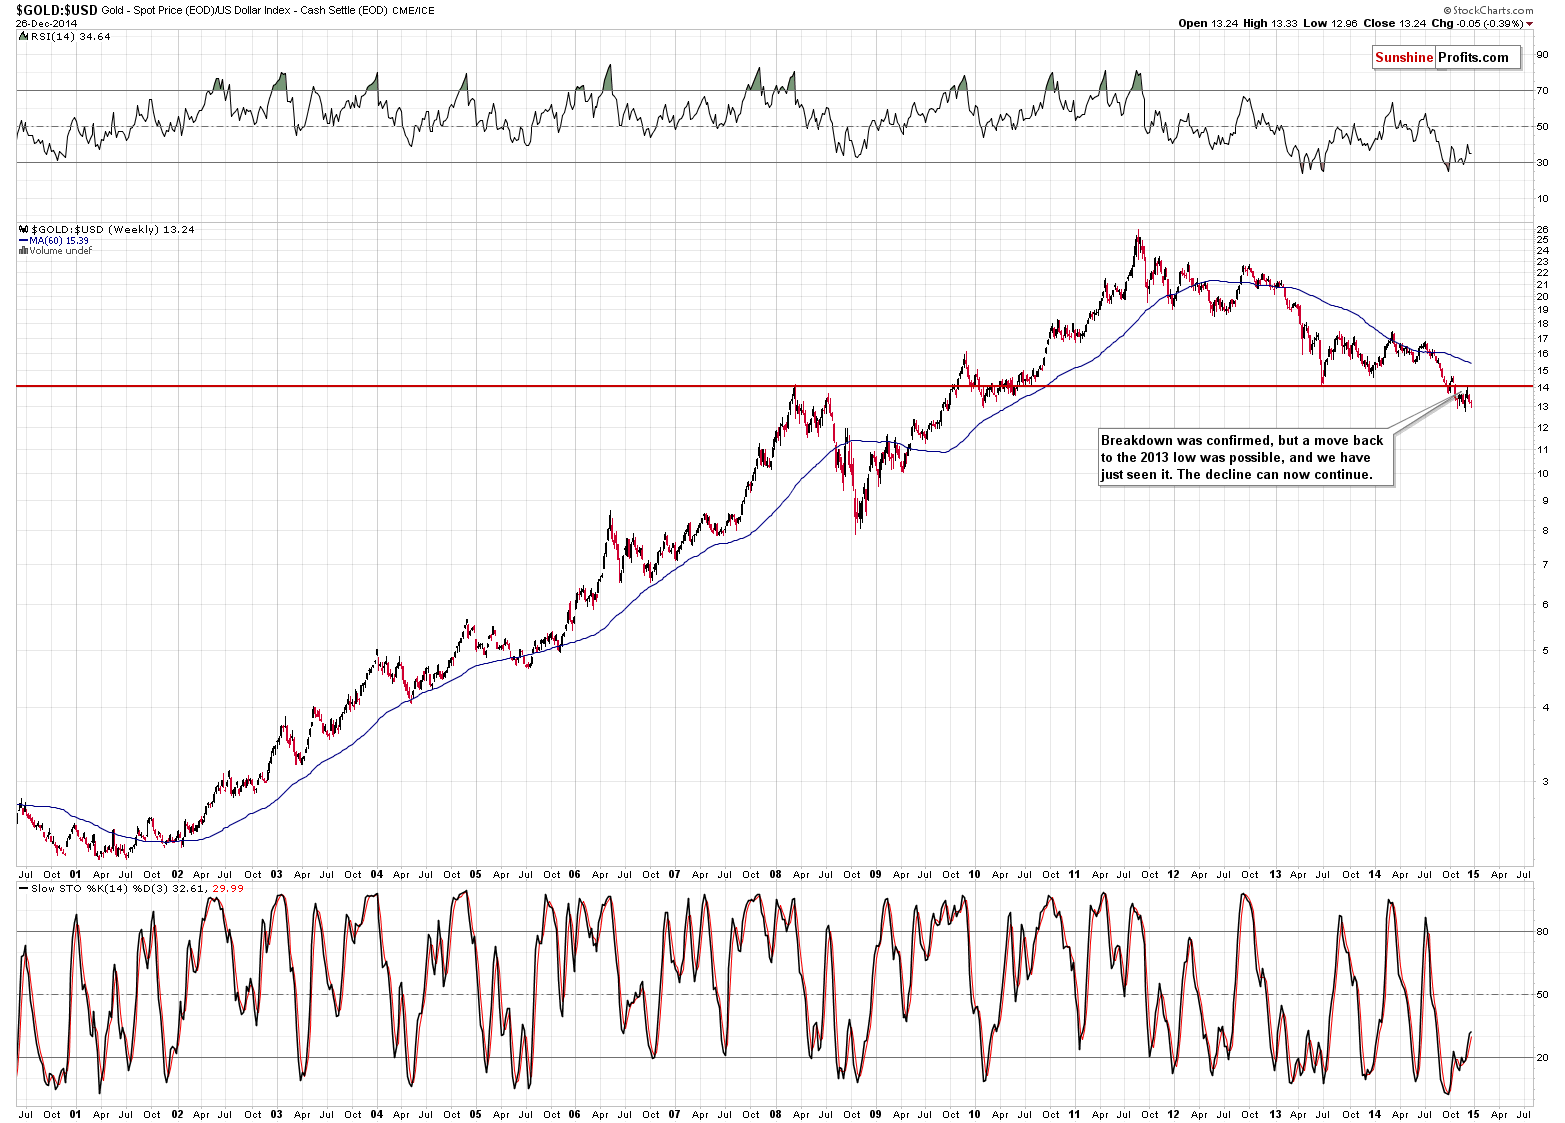
When we take a look at the gold market from the gold to USD Index ratio perspective, we’ll see that the recent really was nothing more than a verification of a breakdown below the 2013 low and 2008 high. With this breakdown being confirmed, we can expect to see a move lower shortly.
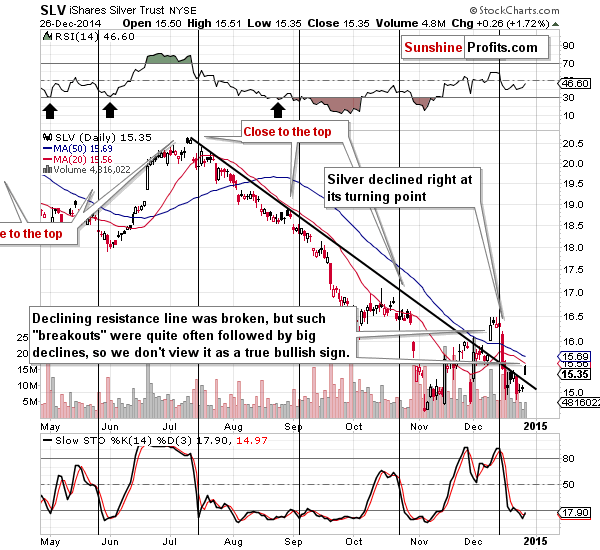
The silver market moved higher in the last session and we saw a breakout, but let’s not forget that “breakouts” in silver have very often turned out to be “fakeouts” and followed by sharp declines. The most recent example took place at the beginning of December. Overall, the breakout in silver has no bullish implications in our opinion.
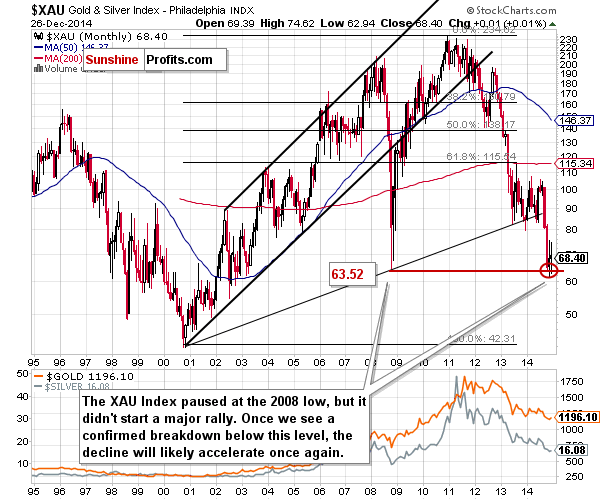
Gold stocks and silver stocks (the XAU Index includes both) didn’t move much lower last week, but they didn’t move much higher either. Overall, the last few weeks of trading seem to be simply a pause within a big decline. If the move that follows the current consolidation is similar to the one that preceded it, we could actually see mining stocks at their 2000 lows.
Could we really see such a significant decline in the mining stocks sector? Why not, it would be less than half of what the miners have already declined since 2010. Besides, the entire commodity sector could move even lower.
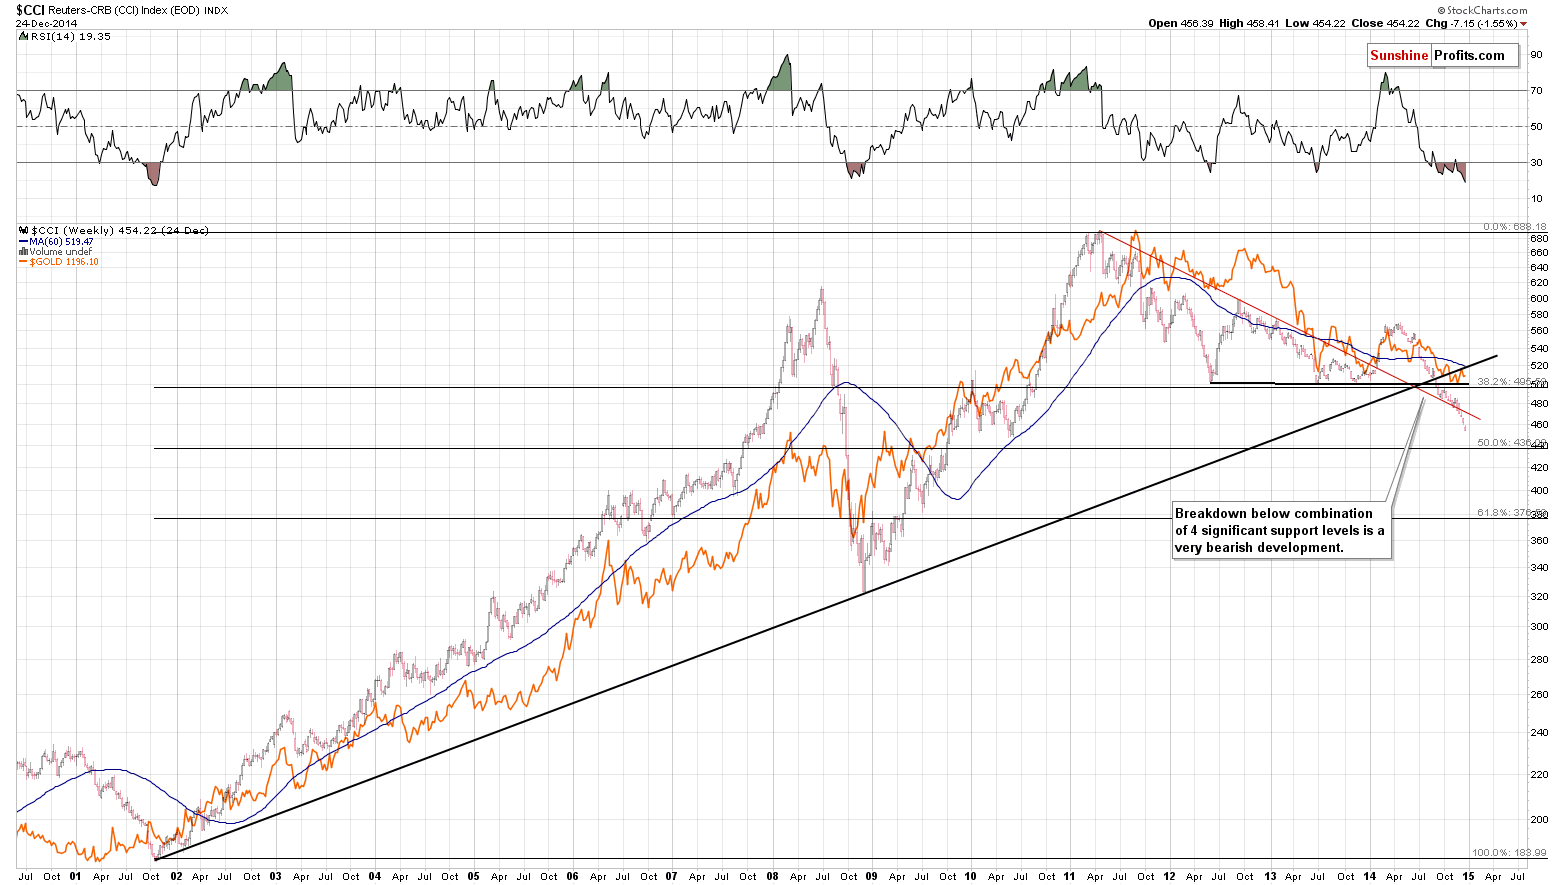
The CCI Index (proxy for the commodity sector) has definitely broken and verified the breakdown below important support levels: the rising very long-term support line, the declining long-term one, and the one based on the previous lows. The index has moved well below the 38.2% Fibonacci retracement based on the entire 2001 – 2011 bull market. It’s now likely to decline to the 50% or even the 61.8% retracement. The latter seems even more likely as that’s where the commodities declined in 2008 (back then the retracement was based on the 2008 top) – the CCI Index even moved a bit below this level and then started to rally once again.
Overall, the situation is still unclear as there are several factors that point to a looming decline in the precious metals, but there are also some important signs suggesting higher values of PMs – like the critical resistance in the USD Index.
It seems that another trading opportunity is just around the corner and even though not much seems to be going on, it might be that paying close attention to the precious metals market at this time and in the coming days will be well worth it. It might be the case that the USD Index manages to rally shortly and confirms the breakout above its key resistance. If that takes place, it will likely create a great entry point for short positions in the precious metals market. However, we are not at that point yet and other factors will need to be considered as well. We will be monitoring the market and we’ll keep you – our subscribers - informed.
To summarize:
Trading capital (our opinion): No positions
Long-term capital (our opinion): No positions
Insurance capital (our opinion): Full position
Please note that a full position doesn’t mean using all of the capital for a given trade. You will find details on our thoughts on gold portfolio structuring in the Key Insights section on our website.
As a reminder – “initial target price” means exactly that – an “initial” one, it’s not a price level at which we suggest closing positions. If this becomes the case (like it did in the previous trade) we will refer to these levels as levels of exit orders (exactly as we’ve done previously). Stop-loss levels, however, are naturally not “initial”, but something that, in our opinion, might be entered as an order.
Since it is impossible to synchronize target prices and stop-loss levels for all the ETFs and ETNs with the main markets that we provide these levels for (gold, silver and mining stocks – the GDX ETF), the stop-loss levels and target prices for other ETNs and ETF (among other: UGLD, DGLD, USLV, DSLV, NUGT, DUST, JNUG, JDST) are provided as supplementary, and not as “final”. This means that if a stop-loss or a target level is reached for any of the “additional instruments” (DGLD for instance), but not for the “main instrument” (gold in this case), we will view positions in both gold and DGLD as still open and the stop-loss for DGLD would have to be moved lower. On the other hand, if gold moves to a stop-loss level but DGLD doesn’t, then we will view both positions (in gold and DGLD) as closed. In other words, since it’s not possible to be 100% certain that each related instrument moves to a given level when the underlying instrument does, we can’t provide levels that would be binding. The levels that we do provide are our best estimate of the levels that will correspond to the levels in the underlying assets, but it will be the underlying assets that one will need to focus on regarding the sings pointing to closing a given position or keeping it open. We might adjust the levels in the “additional instruments” without adjusting the levels in the “main instruments”, which will simply mean that we have improved our estimation of these levels, not that we changed our outlook on the markets. We are already working on a tool that would update these levels on a daily basis for the most popular ETFs, ETNs and individual mining stocks.
Our preferred ways to invest in and to trade gold along with the reasoning can be found in the how to buy gold section. Additionally, our preferred ETFs and ETNs can be found in our Gold & Silver ETF Ranking.
As always, we'll keep you - our subscribers - updated should our views on the market change. We will continue to send out Gold & Silver Trading Alerts on each trading day and we will send additional Alerts whenever appropriate.
The trading position presented above is the netted version of positions based on subjective signals (opinion) from your Editor, and the automated tools (SP Indicators and the upcoming self-similarity-based tool).
As a reminder, Gold & Silver Trading Alerts are posted before or on each trading day (we usually post them before the opening bell, but we don't promise doing that each day). If there's anything urgent, we will send you an additional small alert before posting the main one.
=====
Latest Free Trading Alert:
We saw yet another day of appreciation yesterday. The move up was also on volume higher than on the day before. Does this mean that the short-term picture is now bullish?
Bitcoin Trading Alert: Important Developments Possibly Not Far Away
=====
Hand-picked precious-metals-related links:
Gold retains position as safe haven for 2015
China's net gold imports from Hong Kong hit 9-month high in Nov
=====
In other news:
Ukraine Lawmakers Approve 2015 State Budget to Unlock Aid
Russia’s Vladimir Putin clearly wants to dominate all of Europe
=====
Thank you.
Sincerely,
Przemyslaw Radomski, CFA
Founder, Editor-in-chief
Gold & Silver Trading Alerts
Forex Trading Alerts
Oil Investment Updates
Oil Trading Alerts
