
Last week gold rose to its highest level since mid-May as possible military action against Syria prompted safe-haven buying. It’s worth noting that the yellow metal gained over $250 an ounce from its June low of $1,180.71, but in spite of this growth it is still down about 17 percent for the year.
According to Reuters, gold gave up some gains after British lawmakers voted against any involvement. Additionally, over the weekend President Obama stepped back from the brink and delayed an imminent military strike against Syria to seek approval from the U.S. Congress. Our take is that it won’t happen anytime soon. You will find more details about this issue, and extensive coverage of the crude oil market in our yesterday’s Oil Update.
As the prospect of imminent attacks on Syria receded, gold extended losses and dropped below $1,400 an ounce on Friday. Will this drop trigger further dips?
In order to answer this question, we’ll need to examine gold’s charts to find out what the current situation in the yellow metal is. We also take a closer look at the US Dollar Index and the Euro Index to find out what impact they could have on future price of the yellow metal. Could they drive gold prices lower in the near term?
Let‘s start today’s analysis with the US Dollar Index long-term chart (charts courtesy by http://stockcharts.com).
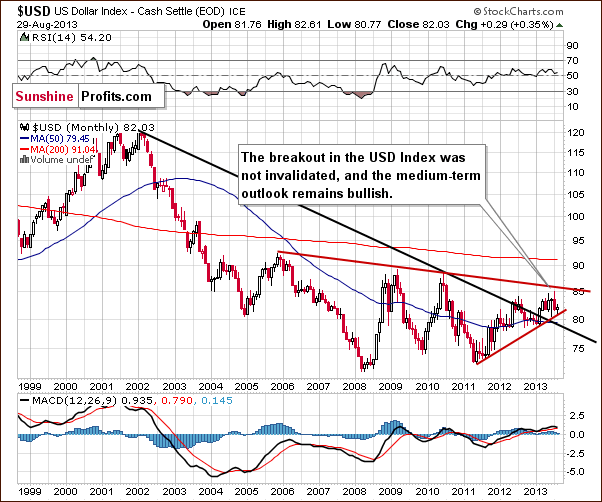
Quoting our essay on gold, dollar and mining stocks on August 28:
The situation in the long-term chart hasn’t changed much recently. The breakout above the declining support/resistance line (currently close to 79) hasn’t been invalidated and, from this perspective, the situation remains bullish.
Now, let’s examine the weekly chart.
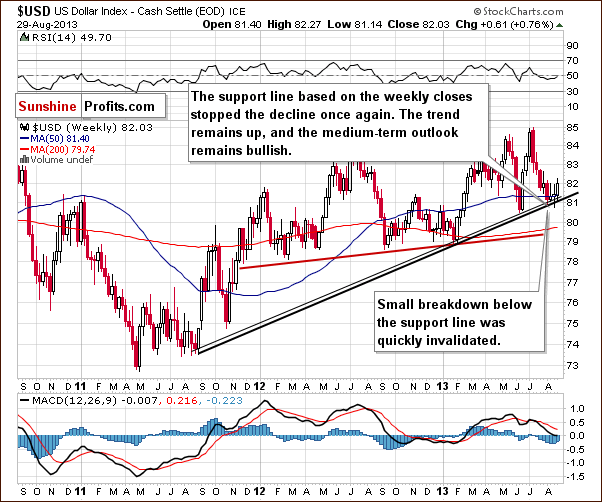
Despite the fact that the USD Index declined once again last week, the medium-term support line was not breached. Although we saw a small move below the upper support line, even this small breakdown was quickly invalidated, which is a bullish signal. These positive circumstances encouraged buyers to act and the dollar came back above the 82 level.
From this perspective, the medium-term uptrend is not threatened, and the situation remains bullish. Therefore, we can expect the dollar to strengthen further in the coming weeks. Looking at the above chart, it seems that the USD Index has started its rally and that this rally will be fueling declines in the precious metals market.
Now, let’s check the short-term outlook.
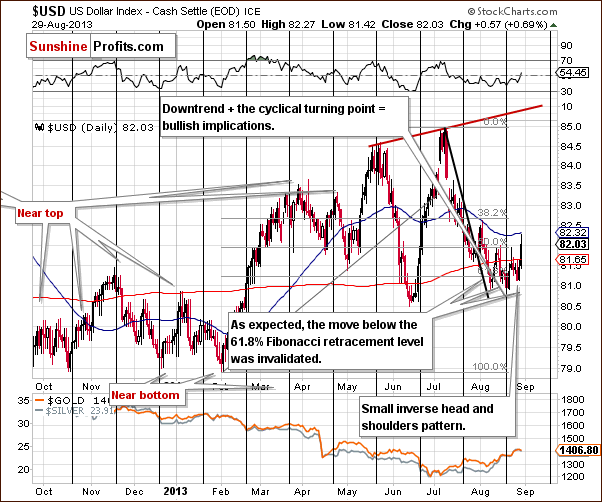
From this perspective, we see that the recent decline once again took the USD Index below the 61.8% Fibonacci retracement level based on the entire February – July rally.
Despite this decline, buyers managed to push the USD Index higher, and the short-term breakdown below the Fibonacci retracement level was invalidated.
When we take a closer look at the daily chart, we see a small inverse head and shoulders pattern underway (based on three August lows). As you see on the above chart, the U.S. currency has moved higher in the recent days and broke above the 82 level, which means that this bullish formation is confirmed.
Additionally, when we factor in the cyclical turning point (which we’re seeing after a monthly decline), the outlook here looks very bullish. In fact, from this perspective, we see that the USD Index already started to move higher right at the turning point.
Once we know the current situation in the US Dollar Index, let’s now take a look at the Euro Index.
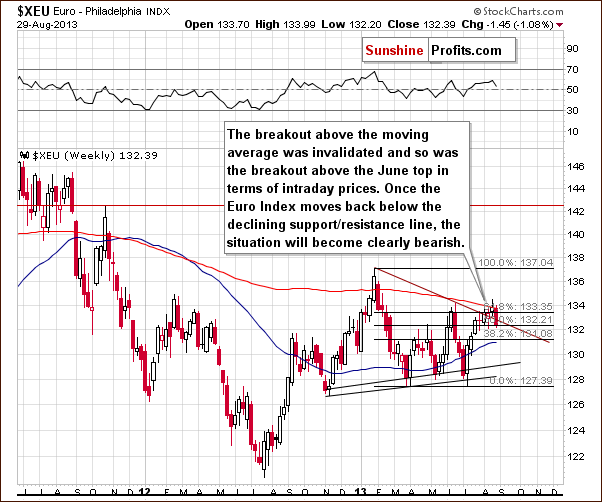
On the above chart, we see that the Euro Index attempted to move above the 200-week moving average in the previous week, but this attempt failed for the second time, and the breakout was invalidated.
Looking at the above chart we clearly see that the European currency dropped below the 61.8% Fibonacci retracement level based on the January - July decline. At this time we also see an invalidation of the breakout above the declining support/resistance line based on the January and June highs, which is also a bearish factor.
Let’s take a look at the gold market.
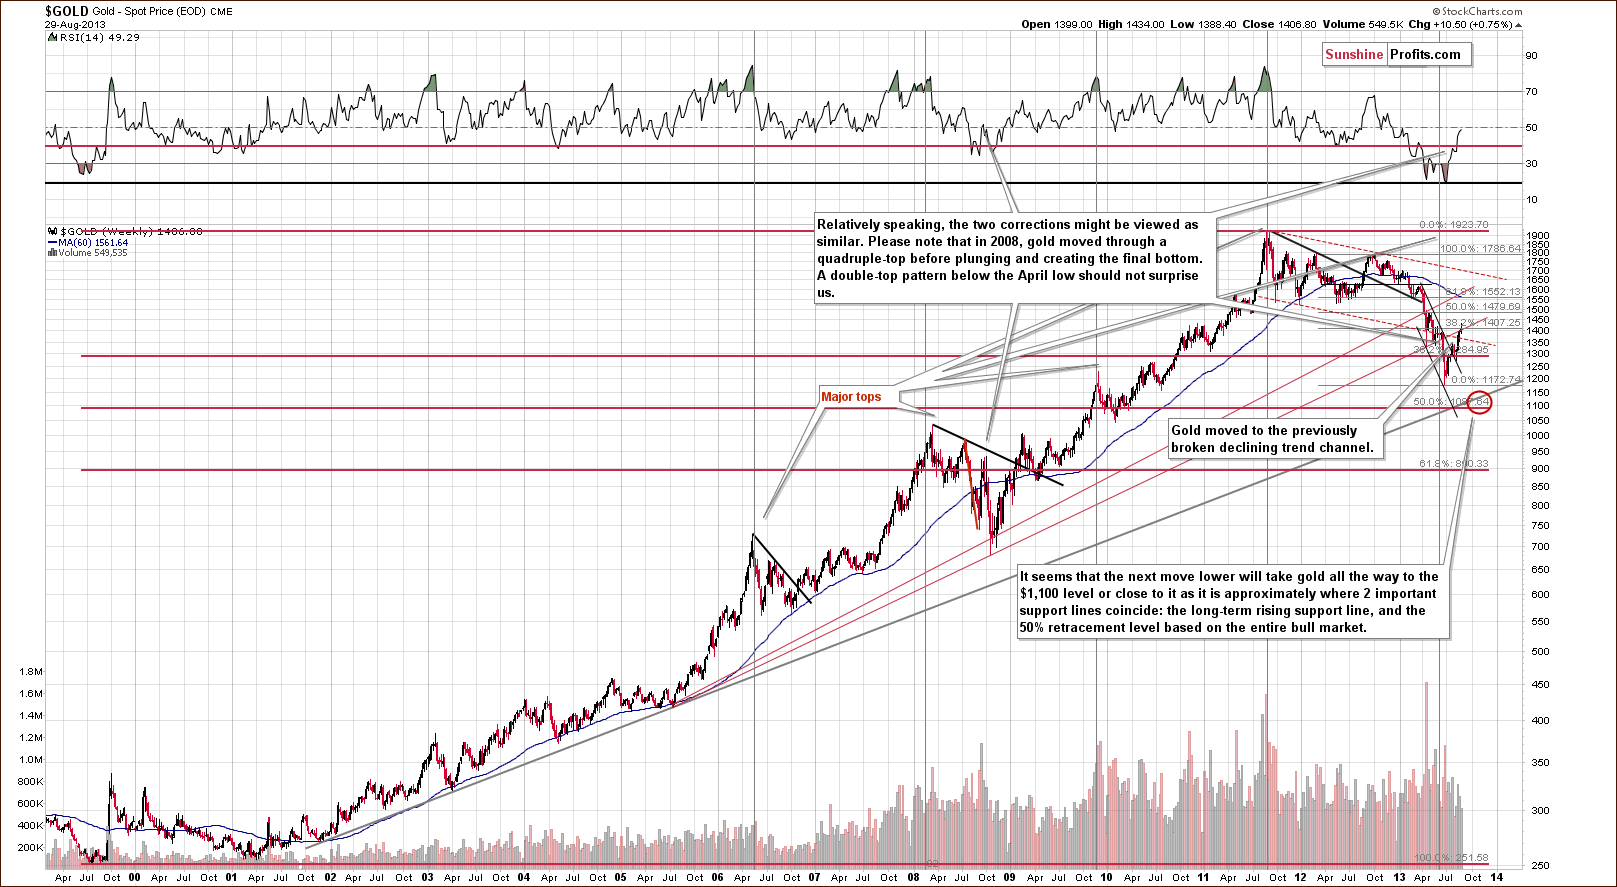
On the long-term gold chart, we see that the yellow metal has climbed up once again and reached the previously-broken rising support/resistance line based on the July 2005 low and the October 2008 bottom (on an intraday basis). At this point, it’s worth noting that this area is strengthened by the 38.2% Fibonacci retracement level based on the September 2012 - June 2013 decline. Although gold broke above this resistance zone at the beginning of the previous week, the breakout was invalidated in the recent days and the yellow metal dropped below $1,400 an ounce. On Tuesday we saw another attempt to move above the resistance levels, but gold didn’t even reach them.
From this perspective, the medium-term downtrend remains in place.
Now, let’s take a look at the medium-term picture to see more details.
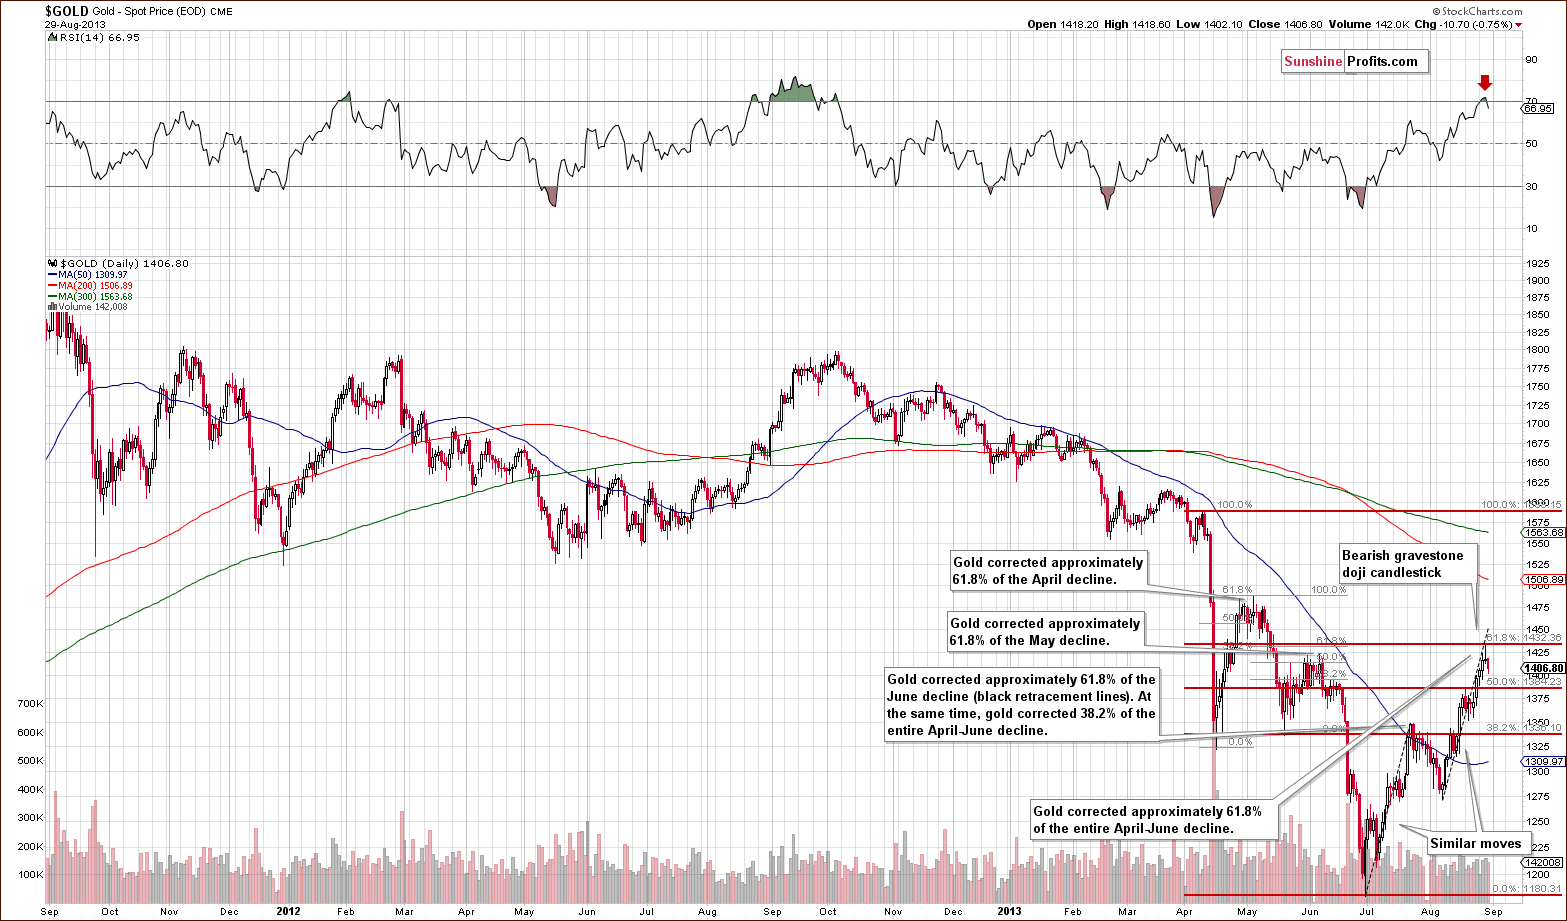
On the above chart, we see that gold continued its rally in the previous week and reached the 61.8% Fibonacci retracement level based on the entire April-June decline. Although the price of gold managed to break above its June top, this breakout was quickly invalidated.
Additionally, when we factor in the Fibonacci price projections, we see that the recent rally from the August 7 low to the August top is similar to the upward move seen in July. If history repeats itself, we will see a downward move – similar to the July-August decline.
From this point of view, it seems that the strong resistance range based on the June top and the 61.8% Fibonacci retracement level will keep the rally in check as it further strengthens the resistance created by the rising long-term line marked in red on the previous (long-term) chart.
Summing up, in the recent days the Euro Index has declined back below the declining red support line, which makes the outlook for the USD Index even more bullish. These circumstances will likely have bearish implications for the precious metals sector. With a bullish outlook in place for the dollar, it doesn’t seem likely that gold will have enough strength to move above the previously mentioned resistance levels. Therefore, despite the recent show of strength, the medium-term outlook for gold remains bearish.
Thank you.
Przemyslaw Radomski, CFA
Back