
Based on the January 4th, 2013 Premium Update. Visit our archives for more gold & silver analysis.
This week we've seen a decent rally in gold, silver and other precious metals and precious metals mining stocks, sparked off probably by the fiscal cliff deal. We have mentioned such a course of events many times and it turned out to be true. As is the case with any strong rally, there always comes a correction (or at least a consolidation) afterwards. The one that took place on Thursday was indeed of significant size but did not – in most cases – invalidate the rally. There were even cases that did not experience any correction at all, such as platinum that held remarkably well. Gold stopped at 200-day moving average, correcting around 72% of the rally.
There was some turmoil in today’s pre-market phase – gold and silver plunged dramatically, probably over the surprising information coming from the Fed about the possibility of ending the monetary stimulus. We doubt that this will really be the case, but it seems that this piece of information will manage to make those less convinced about the gold story to sell their holdings and this is what we've seen today before the market opened.
But it seems that this was taken as a good opportunity to either enter the market or add to their positions by gold and silver investors – in the pre-market phase gold went below $1,630 and silver declined below $29.30 and at the moment of writing these words they are both significantly higher – at around $1,648 and $29.8, respectively – lower than yesterday’s close but much higher than they were just a couple of hours ago. This only confirms the bullish outlook and could be viewed as a sign that the market doesn't believe that the Fed will actually stop pumping money into the economy.
There is one more interesting thing that should be taken into consideration when analyzing such universal commodities as precious metals, traded on many exchanges and in many currencies, namely their price and behavior from other perspectives than the U.S. dollar’s. This is why in today’s essay we will try to address the title and figure out what the price of gold in the upcoming weeks will be, accommodating all the information we can get from the charts of gold priced not only in USD but in other important currencies. We’ll see that the picture can change significantly with the change of the currency. Let us then jump straight into the technical part – we’ll start with the long-term chart of gold priced in U.S. dollars and then move on to other currencies (charts courtesy by http://stockcharts.com.)
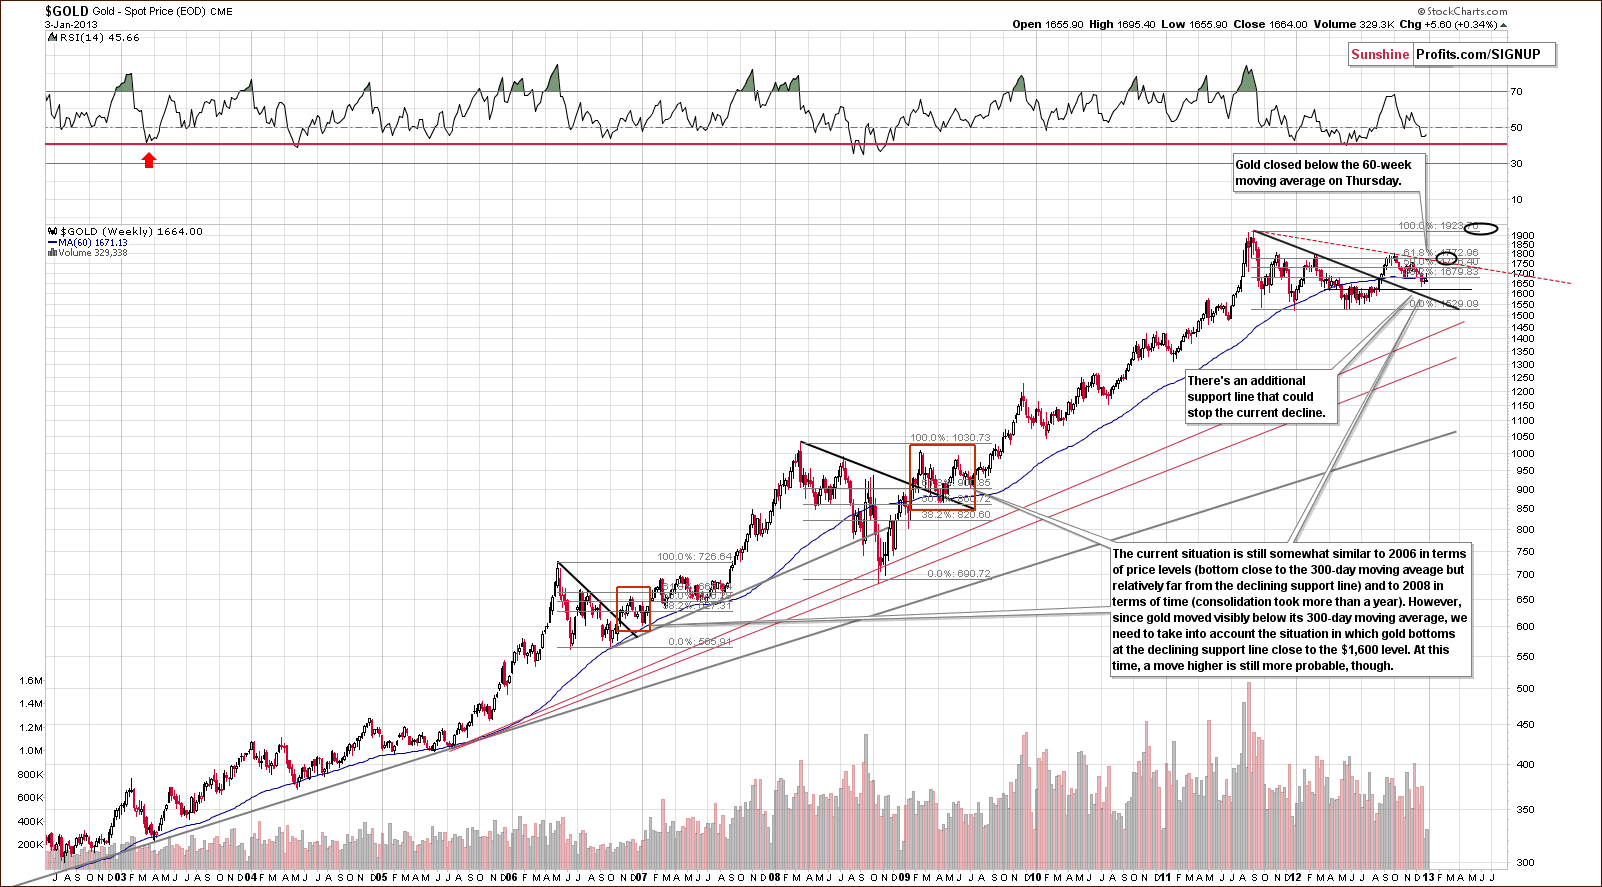
In gold’s very long-term chart, we do not see bullish implications this week. Gold’s price is no longer above the 60-week or 300-day moving average, so the situation has deteriorated this week. The situation remains bullish for the medium term, however, in spite of these developments. This is based on similarities with 2009 and late 2006-early 2007. Gold consolidated after breaking out above triangle patterns in both cases.
Let us now see how the recent developments looked like from the British Pound perspective.
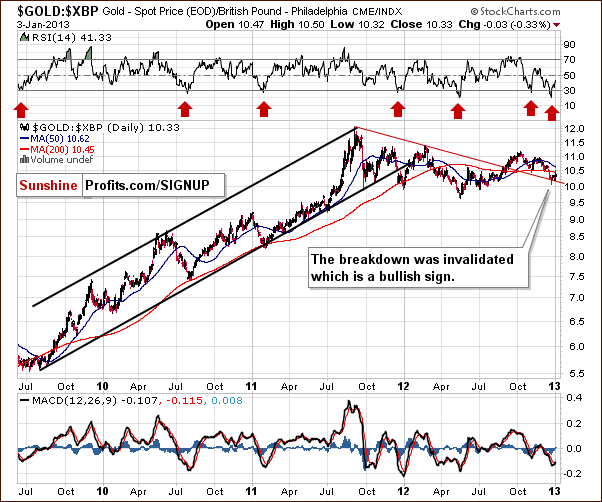
Thursday’s declines did not change a thing as far as critical support lines are concerned (based on Thursday’s closing prices). Breakdowns were invalidated in all cases and key support lines were not reached. In today’s chart of gold from the perspective of the British pound, the previous statements hold true as they do for many other currencies this week. Gold’s price here is exactly where it was one week ago.
Let us now move on to the Canadian Dollar perspective.
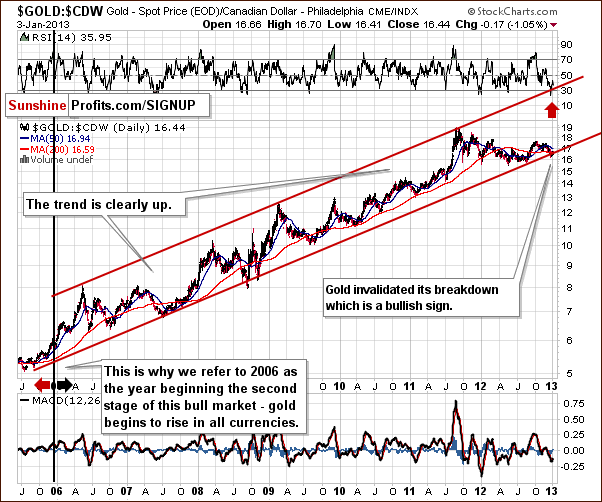
In this chart, the statements made in the previous section hold true as well here (again, based on Thursday’s closing prices). Gold priced in Canadian dollars declined by less than 1% (twelve cents) in the past week and the recent breakdown was invalidated.
Now, we’ll move on to the Japanese Yen perspective, where the situation is even more interesting.
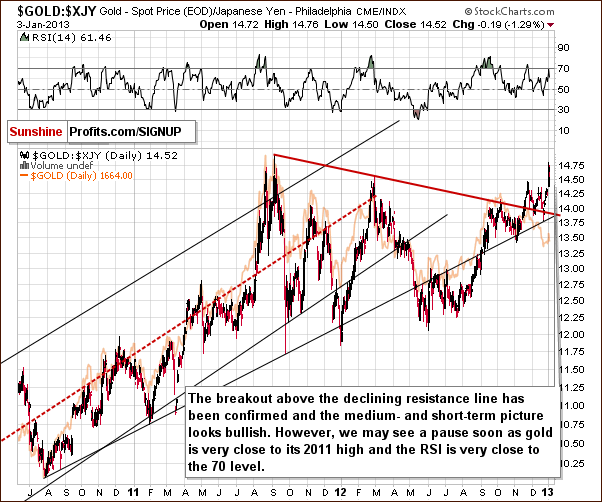
The situation is definitely not the same here. Gold rallied nearly to the level of its 2011 high. This was about 2.5 % above last Thursday’s close and gold priced in yen is now about 1.5% higher than a week ago.
To finish off, let’s have a glance at a chart that synthesizes the “non-USD” perspective, as it features gold price relative to an index of many foreign currencies.
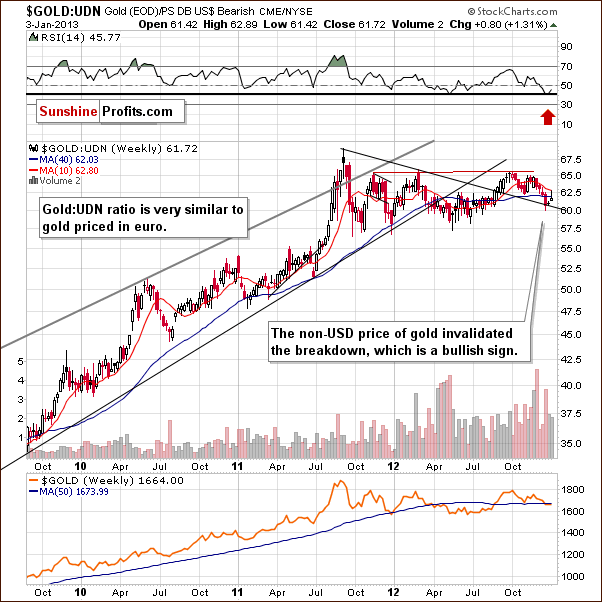
Here we see that the breakout above the medium-term declining resistance line has been confirmed and the breakdown invalidated. The medium-term trend remains bullish. More importantly, we see that this important ratio has some space before it moves to the declining support line, so perhaps it will not move below it today and the overall non-USD picture will remain bullish.
Summing up, the situation has deteriorated a bit for gold from the USD perspective on Thursday, and the situation became mixed based on Friday’s pre-market price moves. Even though the most part of these declines has been invalidated, the market is still lower than where it closed yesterday. The situation seen from the non-USD perspective remains favorable and this, plus the reversal seen just before markets opened today, makes the overall medium-term picture bullish.
Thank you for reading. Have a great weekend and profitable week!
Sincerely,
Przemyslaw Radomski, CFA
PS. Earlier today our subscribers received 2 Market Alerts and one big Premium Update - all loaded with relevant and timely information - you can access them by signing up here.
Back