
Without a doubt, the most important event this week will be Ben Bernanke's testimony before Congress. Today the Fed Chairman will give his semi-annual testimony on the economy before the House Financial Services Committee. He is scheduled to appear at 10 a.m. ET to deliver his comments and take questions, but his prepared remarks will be released at 8:30 a.m. ET. Investors are now focused on it and wondering if Bernanke will surprise the markets once again.
"We are not sure what to expect from Bernanke as he has made contrasting comments over the last few weeks. Gold is waiting for guidance from him," said Peter Fung, Head of Dealing at Hong Kong's Wing Fung Precious Metals.
Before we know if gold will be very sensitive to what happens after that testimony, I invite you to find out what's the current outlook for the yellow metal.
In my last essay we considered the price pattern of gold from the Fibonacci perspective and from the perspective of the Elliott wave principle. Since then, nothing has changed and the previously mentioned resistance zones and support levels are still valid.
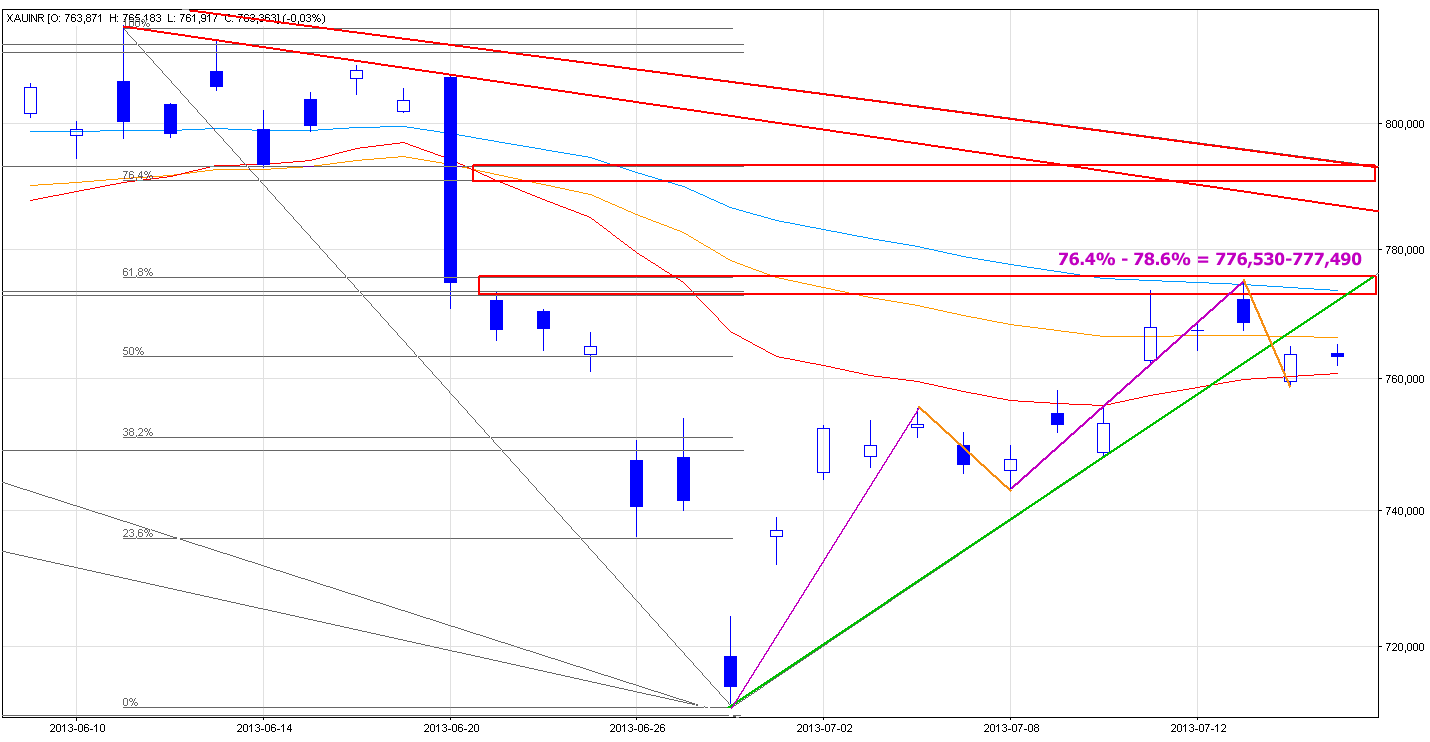
The nearest resistance zone is based on three Fibonacci retracements - the 23.6%, 38.2% and 61.8% levels (lower red rectangle). The next resistance zone is based on the 50% and 76.4% Fibonacci retracements and the June 14 bottom (higher red rectangle). In this area there is also the declining resistance line based on the June highs, which might be a bearish factor that can slow further growth.
The 45-day moving average, which was broken on June 20 once again, still serves as resistance.
What about support levels? Let’s take a look at the daily chart below.
As I wrote in my previous essay on gold priced in rupees:
(...) if the buyers are not able to get through this resistance zone, we should prepare for a decline. In this case the first target for the bears is the green rising support line.
As you see on the above chart, yesterday gold bears went short and triggered a correction. After a lower open, the price edged up slightly throughout the session. In spite of this growth, buyers didn’t manage to push the price above the previously mentioned green rising support line. What does this mean? It moved the action to the first resistance line. Today (at least at the moment when these words are written) we also see trading below this resistance line.
When we compare yesterday’s decline (upper orange line) to the corrective move from the July 4 top to the June 8 bottom (lower orange line), we clearly see that the Tuesday decline was deeper than the previous one. According to theory, since the buyers were not able to defeat the previously mentioned resistance line and the Monday top, we should prepare for further declines. The next support level is around last Wednesday’s bottom.
Before we take a closer look at the position of the indicators, let's go back to the Fibonacci patterns for a moment. In my previous essays you read about retracement levels and I’m sure you know well that the use of Fibonacci retracements can be a very simple and effective way to designate the key support and resistance levels. Today I want to introduce you to the Fibonacci price projections.
At the beginning let me thrown in a few sentences about them. They are based on three data points and compare swings in the same direction. I usually use the 76.4%-78.6% zone and the 100%, 127.2%, 150%, 161.8%, 173.2% and 200% ratios.
As you see on the daily chart there is the next resistance zone based on the Fibonacci price projection (purple lines) between the Rs 776,530 and the Rs 777,490 level. In spite of last week’s increases, buyers didn’t manage to push the price higher and the Monday top didn’t even reach this resistance zone which is a bearish factor for me.
Once we know the current situation in the daily chart, let’s take a closer look at the position of indicators.
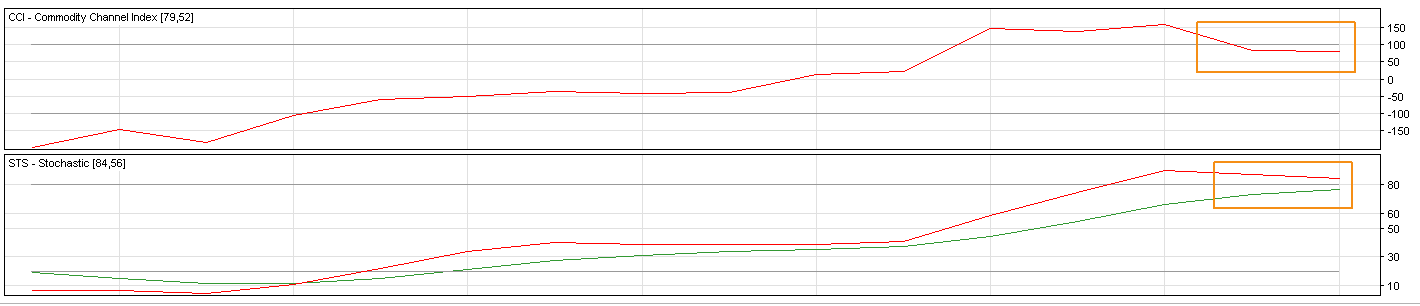
As you see the Commodity Channel Index was overbought at the end of last week and generated a sell signal yesterday. The Stochastic Oscillator is still overbought and is very close to generating a sell signal.
What is the investment scenario? Let's summarize.
Yesterday gold declined and lost 0.65%. Although the price edged up slightly throughout the session, Tuesday ended below the broken support line. Additional factors which prescribe caution are the positions of indicators and a possible corrective move deeper than the previous one. From my point of view, the outlook and trend remain bearish for the short term. In the immediate future, we still could see some strength, but both the Fibonacci perspective and the perspective of the Elliott wave principle suggest the next big move will likely be to the downside.
Thank you,
Nadia Simmons
