
Since my previous essay the short-term situation in gold has improved slightly. These positive changes have been fueled by a steady strengthening of the rupee against the dollar, which resulted in a rally to a more-than-1-week high.
The price of gold climbed to an over two-week high after U.S. Federal Reserve Chairman said its huge stimulus program would stay in place for some time. Globally, the yellow metal rose to almost $1,300 per ounce, which is the highest level since June 25.
What impact have these circumstances had on the gold's chart? Where are the nearest support zones and resistance levels? Let's take a closer look at the charts and find out what's the current outlook for gold priced in rupees.
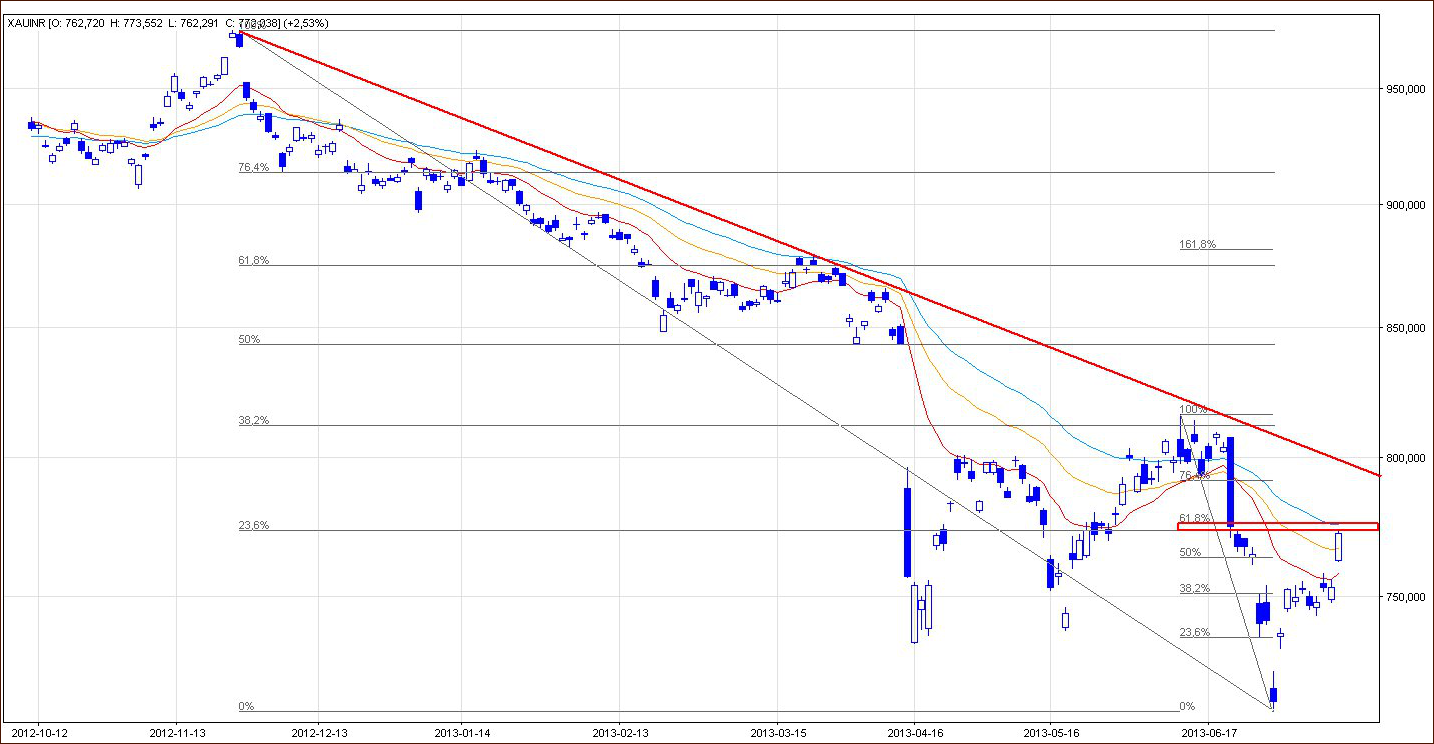
First of all, when we look at this daily chart we see that the price of gold is still below the major declining resistance line based on the November 2011 and March 2013 highs (the bold red line).
Although the bulls tried to push the price higher in June, this strong declining resistance line hasn't been reached. This led to a strong sell-off, which brought a new low on June 28. This time buyers still quite a lot potential for further growth before the resistance line stimulates the bears to action once again.
But is it the only one factor that may encourage gold bears to trigger a correction? Let's take the same chart and zoom in a little bit.
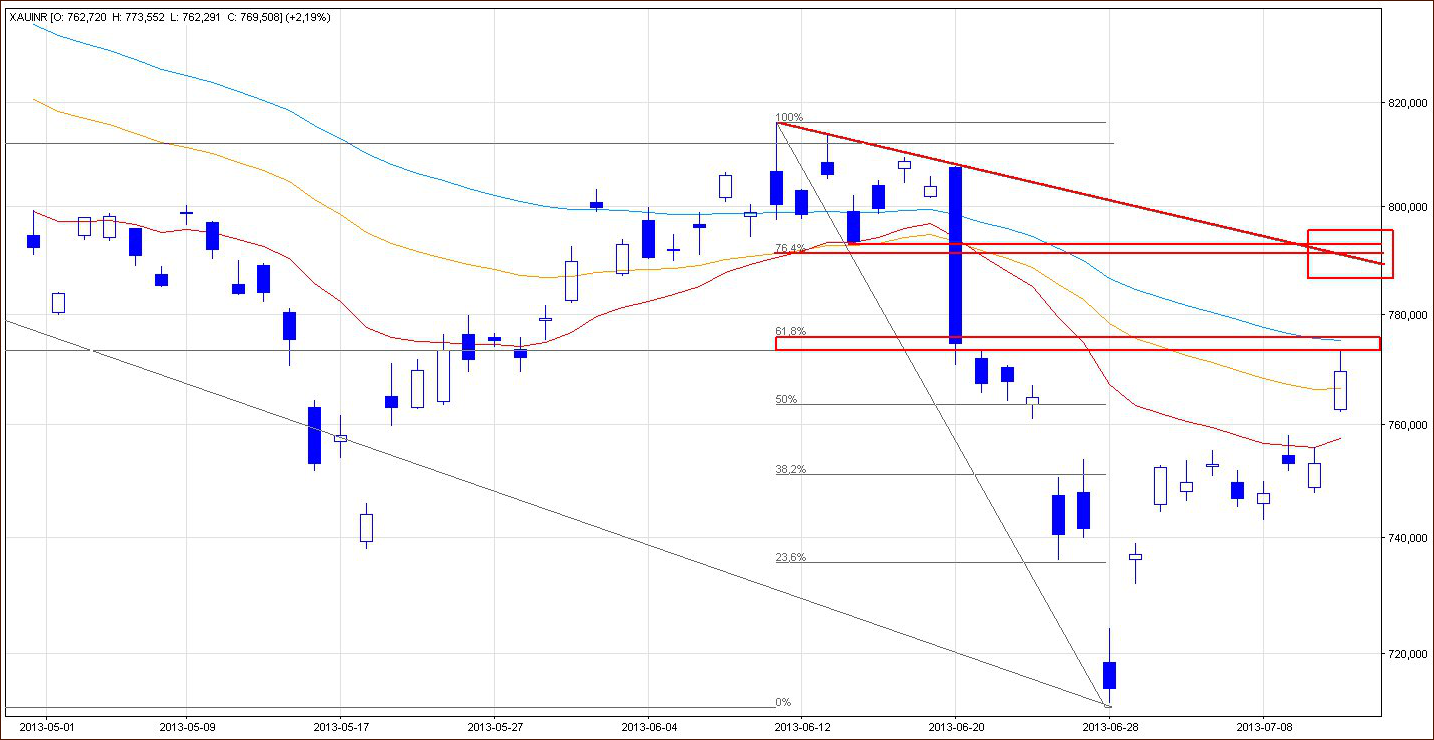
In this chart, we see that has gold continued its rally throughout the recent sessions and climbed up beyond the Rs 77,350 level.
Last time we took a look at the price of gold from the perspective of the Elliott wave principle. This time I want to introduce you to the Fibonacci point of view.
As we see in the first chart there were two obvious periods to which I applied the Fibonacci price retracements: the 2011 high to the 2013 low and the June high to the June low. By combining the two calculations - using ratios of 0.236 and 0.618 - we can see crystal clear that gold has reached its first resistance zone. When we figure in the 45-day moving average, which was broken on June 20 once again and now serves as resistance, we see that this area is very important. If the buyers are not able to get through this resistance zone, we should prepare for a decline. In this case the first target for the bears is around yesterday and Monday bottoms.
However, if buyers manage to break above this strong resistance zone, we might see a bullish scenario: a further rally to the next resistance zone based on the 76.4% Fibonacci retracement and the June 14 bottom. At this point, it's worth to mention the declining resistance line based on the June highs, which might be a bearish factor that can slow further growth.
What is the investment scenario? Let's summarize.
Gold has continued its rally but the move to the upside has not invalidated the most important resistance levels. From my point of view, the outlook and trend remain bearish for the short term. In the immediate future, we could see some strength, but the Fibonacci perspective suggests the next big move will likely be to the downside.
Thank you.
Nadia Simmons
Back