Visit our archives for more gold articles.
According to Reuters, last week India hiked the import duty on gold yet again to a record 10% and raised excise duty on the metal, as imports jumped in July despite the government's attempts to strangle supply and curb demand to rein in dollar spending.
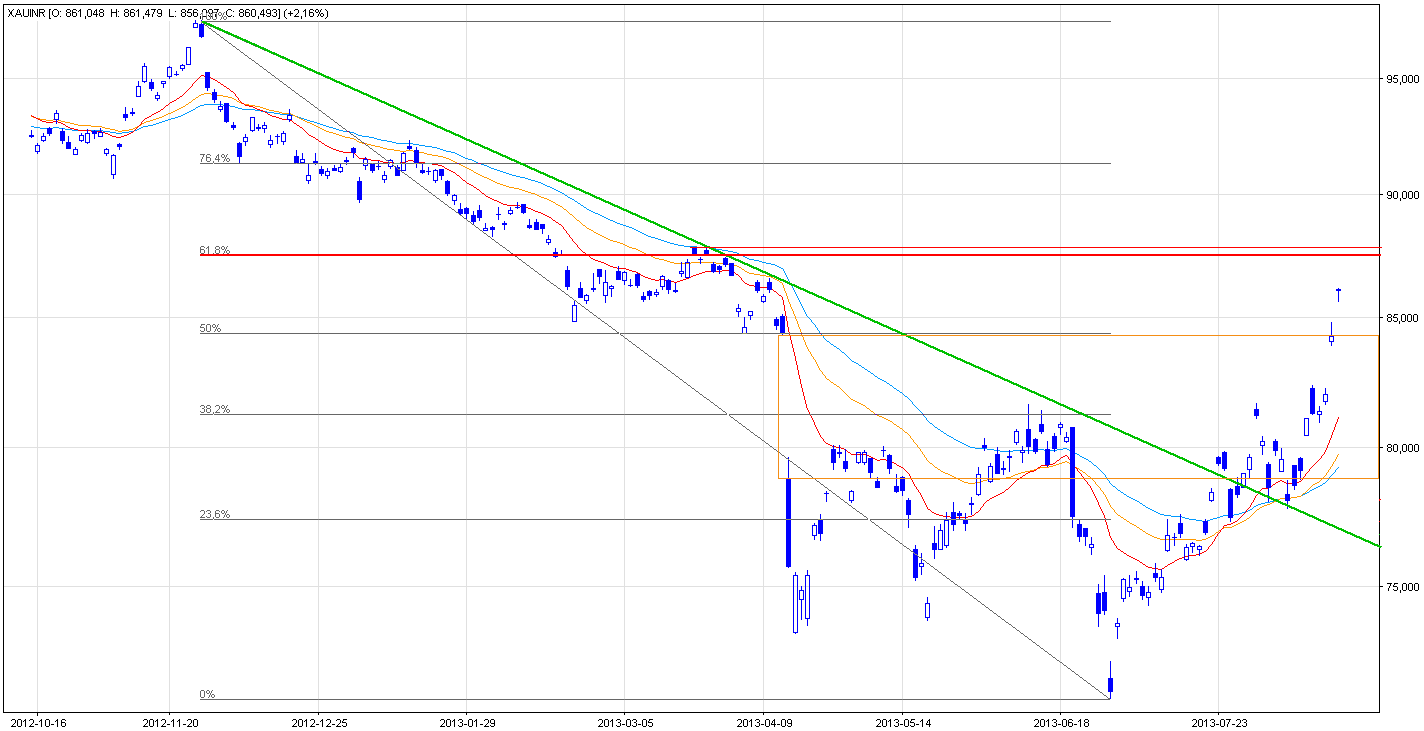
This decision resulted in a further rally and gold prices in India rose to their four-month high on Friday. Today, the yellow metal extended gains and climbed up to over Rs 86,000 per ounce. It’s gold’s highest level since April 10, 2013.
At this point, it’s worth to mention that the rally in precious metals began only after the rupee plunged to an all-time low of 61.65 against the American currency. This raised fears that the dollar-denominated metal would become costlier, and that supply would be restricted after the RBI prohibited inward shipment of gold coins.
What impact have these circumstances had on the gold's chart? Where are the nearest support zones and resistance levels? Let's take a closer look at the charts and find out what is the current outlook for gold priced in rupees.

On the above chart we see that the situation improved past week. Last Monday, the price climbed up and almost reached the July top.
In my previous essay, I wrote:
(…) If the bulls fail, we should prepare for a bearish scenario. In this case, if the price of gold drops below the recent decline's low, we may see a bearish double top formation.
Last Tuesday, after a higher open the yellow metal edged up and reached over Rs 82,000 per ounce. In this way, buyers prevented the bearish scenario. Although, gold gave up the gains and dropped below the July top, gold bulls didn’t give up and pushed the price higher.
Quoting my last week’s essay:
(…) the next resistance is at the Rs 84,298 level where the April's low is. Slightly above this level is also the 127.2% Fibonacci extension level, which, together with the above-mentioned bottom, forms a strong resistance zone.
As you see on the daily chart, Friday’s increases led gold’s price to its four-month high and the above-mentioned price target was reached. This positive event encouraged buyers and today the shiny metal climbed up once again and reached its new local top at Rs 86,147 per ounce.
Will this improvement last longer? What's next?
The nearest resistance level is the 150% Fibonacci extension level based on the decline from the June top to the June low (around Rs 86,817). Slightly above (around Rs 87,433 ) is also the 61.8% Fibonacci retracement level based on the entire decline from the 2012 top to the 2013 low, which together with the March top forms a strong resistance zone.
If these high levels encourage gold bears to go short and trigger a correction, the nearest support level is at the 23.6 Fibonacci retracement level based on the entire June-August rally (currently around Rs 82,585 level). Slightly below is the August 13 top and July peak, which together form a support zone.
Once we know the current technical situation, let’s take a look at the INR/USD chart and find out whether the previously mentioned relationship actually exists or not.

As you clearly see on the above chart, this relationship didn’t last earlier. After the May top we saw a strong decline which took the rupee to the June low slightly below the 165 level. At that time we didn’t see higher prices in gold priced in rupees. We also didn’t notice this relationship in early July.
For the first time gold responded to the INR/USD lower values at the end of July.
In the following days, we saw similar situations and I marked them on the chart with orange rectangles.
What's next? Before I summarize, let’s check where the nearest support could be.
As you see on the above chart, the rupee is approaching the green support line based on the March bottom and the June low. It is quite possible that this line will stop the decline.
When we factor in the Fibonacci price extensions, we know that the rupee dropped below the 150% extension level (close to 159 level). From this point of view there is still much room for further declines because the 161.8% extension level (around 158.89) is much lower than where the price is today.
Summing up, the recent weakness in the rupee against the dollar resulted in a rally to a more-than-4-month high. If the Indian currency reaches the green support line based on the March bottom and the June low, it is possible that this line will stop the decline, which may slow further growth in gold. However, if it is broken, the rupee may drop further against the dollar. If it happens and the previously-mentioned relationship remains in place, gold priced in rupees will likely reach its new local high.
If you'd like to stay up-to-date with our latest free commentaries regarding gold, silver and related markets, please sign up today.
Thank you.
Nadia Simmons
Back
