
Since my previous essay the short-term situation in gold has improved. Earlier this week the yellow metal climbed up and hit its highest level in more than a month after the central bank linked imports to export volumes. According to Reuters, the Reserve Bank of India (RBI) moved to tighten gold imports again on Monday, making them dependent on export volumes with an eye to reducing a record current account deficit, but offered relief to domestic sellers by lifting restrictions on credit deals. Banks and authorized agencies will now have to ensure that at least 20 per cent of imported gold is made available for exports, the Reserve Bank said. Importers will be required to keep 20 per cent of the consignment with Customs bonded warehouses, the central bank added.
Despite this growth, the higher prices didn’t last long. The yellow metal gave up the gains and dropped sharply on Wednesday and Thursday. Where did this corrective move take gold’s prices? What impact did these circumstances have on gold’s chart? Did they change the outlook for the yellow metal? Where are the nearest support zones and resistance levels? Let's take a closer look at the charts and find out what's the current outlook for gold.
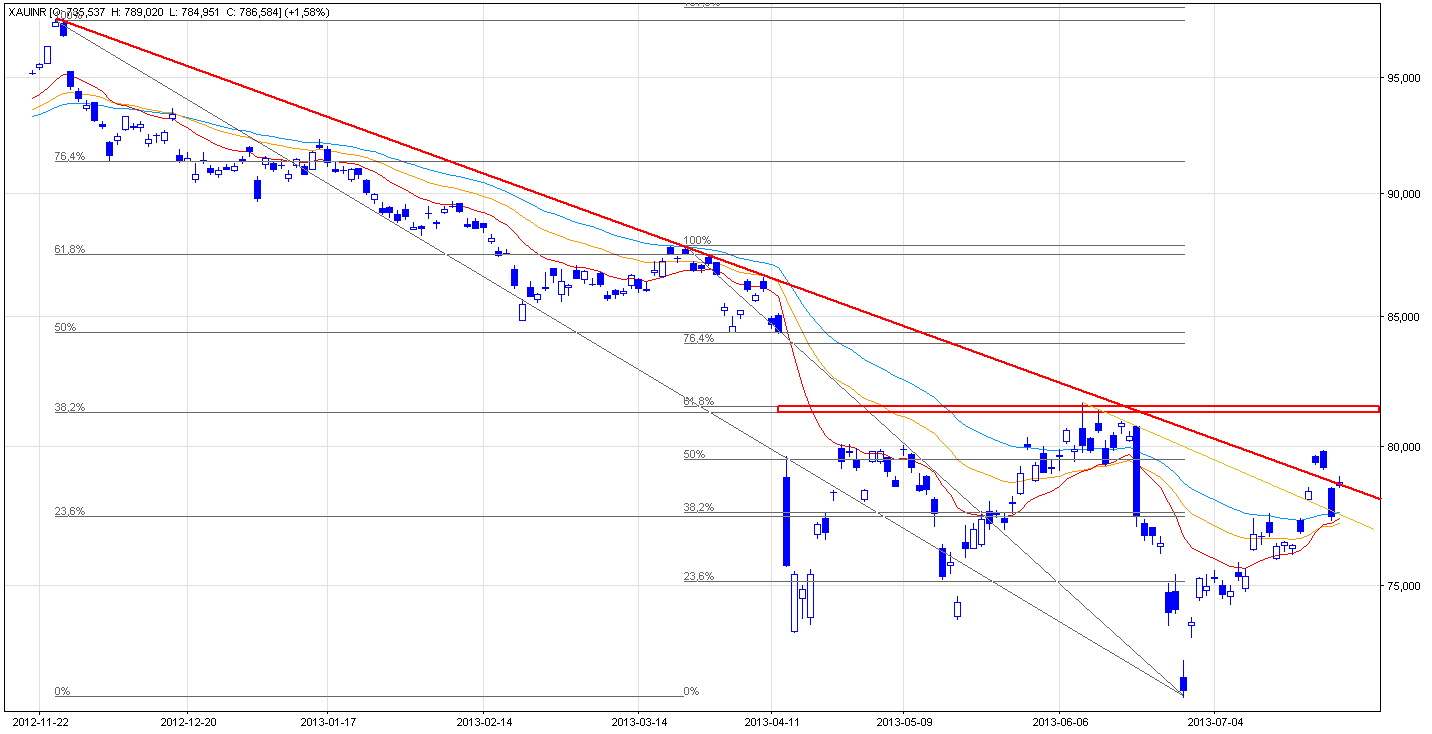
On the above chart we see that the price of gold has gone up. On Monday, after a higher open, the price edged up slightly throughout the session. In this way, the first strong resistance zone based on three Fibonacci retracements - the 23.6%, 38.2% and 61.8% levels was broken. There was also a breakout above the declining resistance line (based on the June highs) and the 45-day moving average, which serves as support now.
In the following days, the combination of the Reserve Bank of India’s statement and the already mentioned positive circumstances pushed the yellow metal to over Rs 79,860 per ounce which was its highest level in more than a month. In this way, gold bulls broke above the downtrend declining resistance line and the next resistance zone based on the 50% Fibonacci retracements and the June 14 bottom.
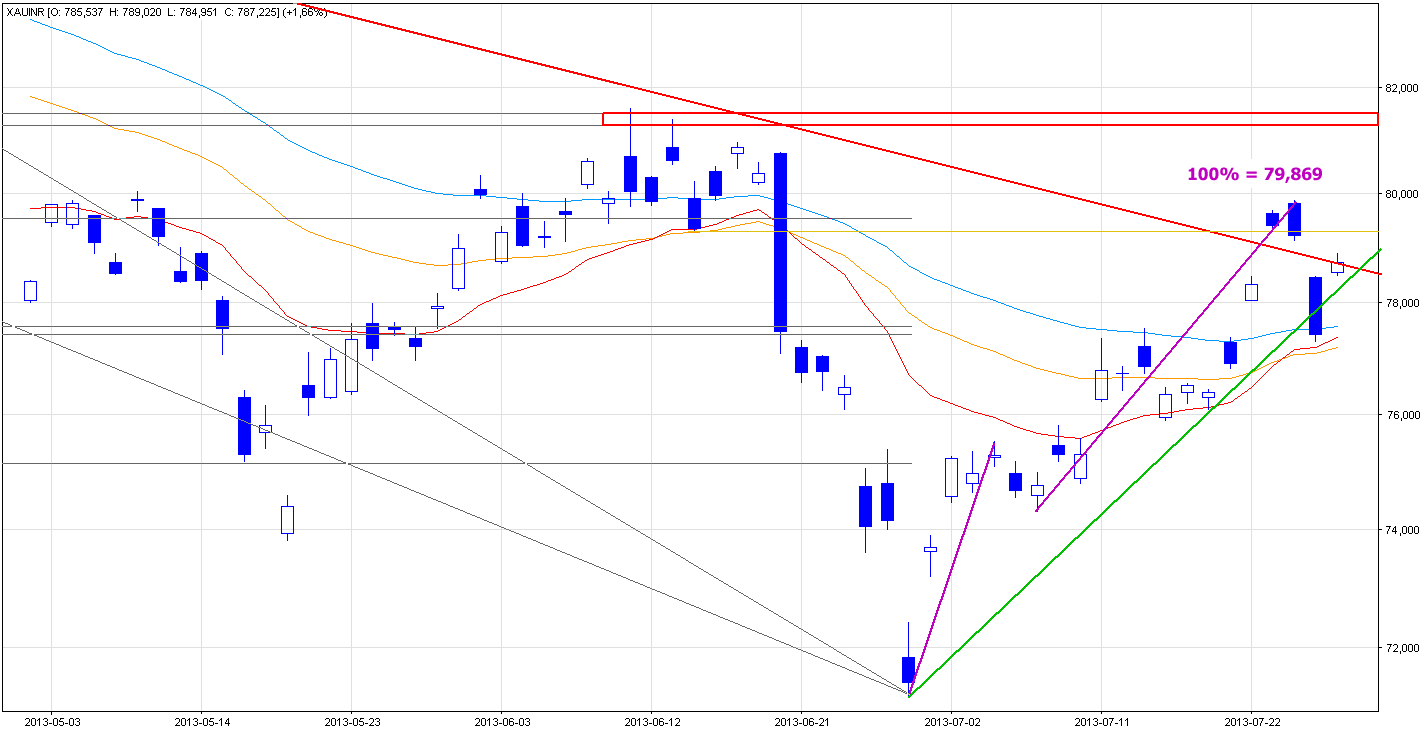
In spite of this growth, buyers didn’t manage to push the price above the psychological barrier of Rs 80,000 per ounce. Gold gave up the gains and dropped sharply on Wednesday and Thursday. That deeper corrective move took prices below the 45-day moving average and the rising support line based on the June’s bottom and the July 18 low once again. We can see it on the chart below more clearly.
At this point, it’s worth to mention the Fibonacci price projections.
As I wrote in my previous essay on gold priced in rupees:
(…)the Fibonacci price projections. (…) are based on three data points and compare swings in the same direction. I usually use the 76.4%-78.6% zone and the 100%, 127.2%, 150%, 161.8%, 173.2% and 200% ratios.
As you see on the above chart there is a strong resistance levels based on the 100% Fibonacci price projections (purple lines) at Rs 79,869. On Tuesday buyers managed to push the price higher and gold reached slightly below this resistance level. This event encouraged gold bears to go short and, as I previously mentioned, resulted in a sharp decline in the following days.
Today, after a higher open, the price increased above the previously-broken support line. Despite this growth gold is still trading below the red declining resistance line (at least at the moment when these words are being written).
If buyers manage to push the price above this line we might see a bullish scenario: further growth to at least the Tuesday top. However, if they fail, gold bears will likely trigger another corrective move. In this case, the first support is around the yesterday bottom. The next one is around Rs 76,000 (last week’s lows).
Once we know the current situation from the daily chart, let’s take a closer look at the position of indicators.
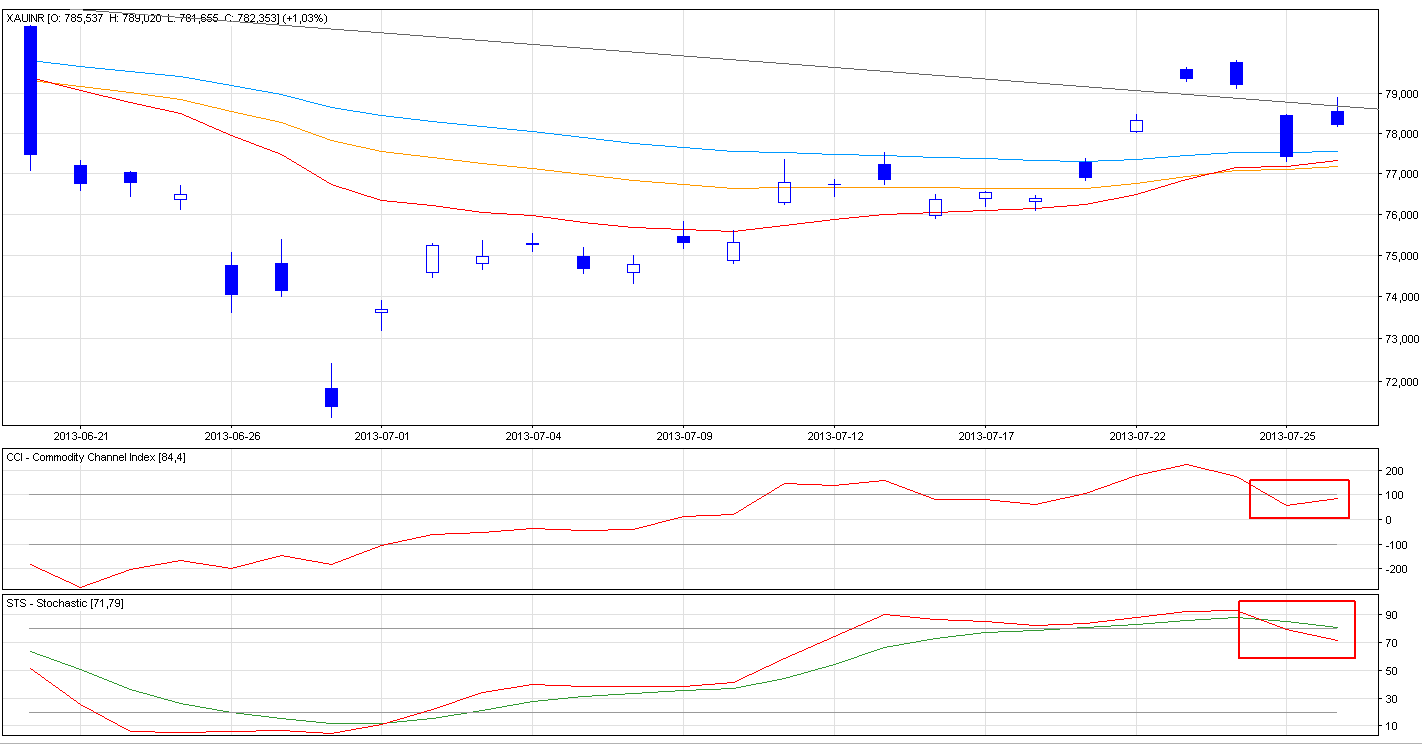
As you see, both the Commodity Channel Index and the Stochastic Oscillator generated sell signals yesterday, which is a bearish factor for me.
What’s next? Let's summarize.
Earlier this week the yellow metal climbed up and hit its highest level in more than a month. Although the price broke above two strong resistance zones, the breakout above the downtrend declining resistance line was invalidated. Another bearish factor is a strong resistance level based on the 100% Fibonacci price projection which stopped buyers on Tuesday. Additional factors which prescribe caution are the positions of indicators. Connecting the dots, from my point of view, the outlook and trend remain bearish for the short term. The Fibonacci perspective suggests that the next big move will likely be to the downside.
Thank you,
Nadia Simmons
