
Visit our archives for more gold articles.
Yesterday, gold prices on the global market rallied above $1,430 an ounce to 3.5 month highs as rising tensions over Syria sparked safe-haven demand.
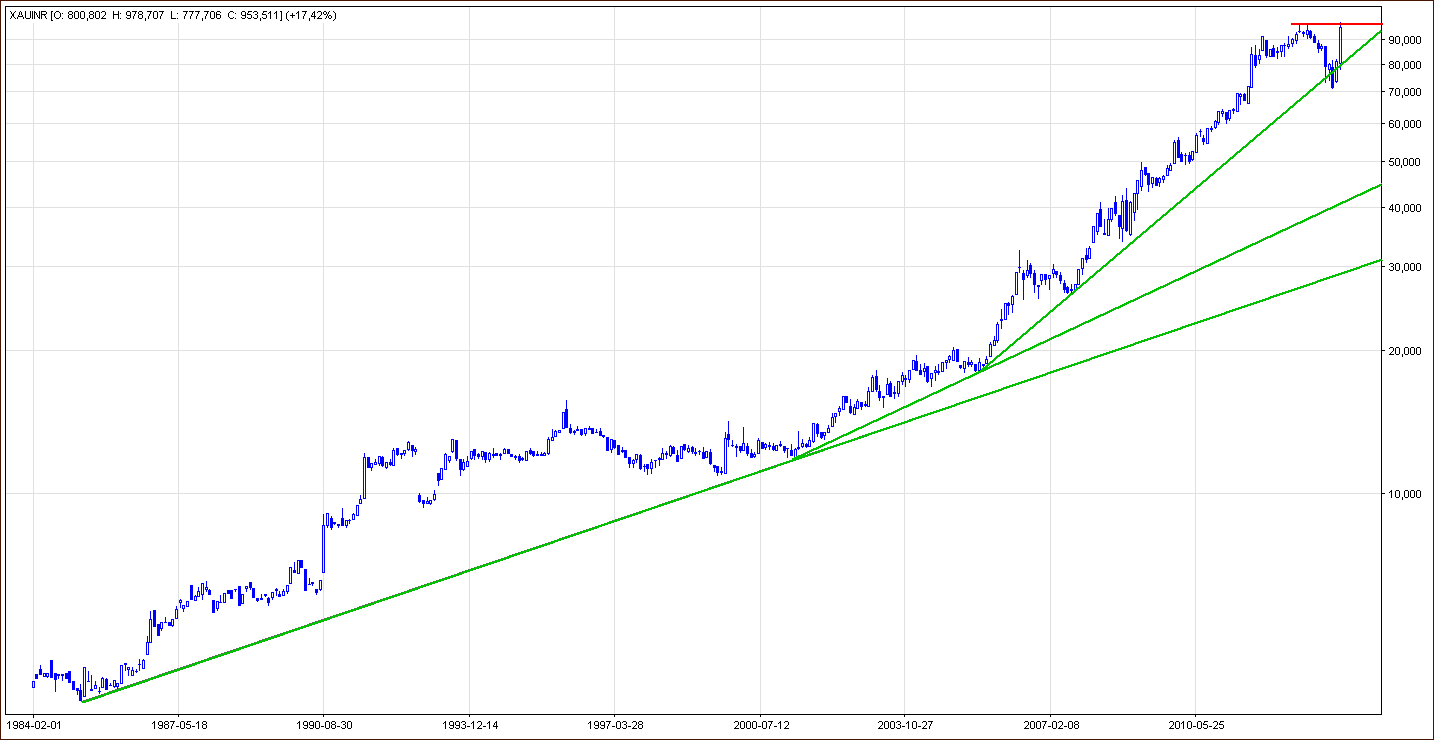
On the domestic market, gold prices hit record highs at 97,870 Indian rupees per ounce, as the rupee slumped to a record low versus the dollar.
According to Reuters, the rupee has lost more than 16 percent against the dollar so far in 2013, causing chaos in the domestic economy. Imports are costlier and the current account deficit is expected to rise. Rising fuel costs (due to currency depreciation) and inefficient supply chain management will ensure that inflation won't go down in a hurry.
What impact have these circumstances had on the gold's chart? Where are the nearest support zones and resistance levels? Let's take a closer look at the charts and find out what the current outlook for gold priced in rupees is.
Let's take the same chart and zoom in a little to see more details.
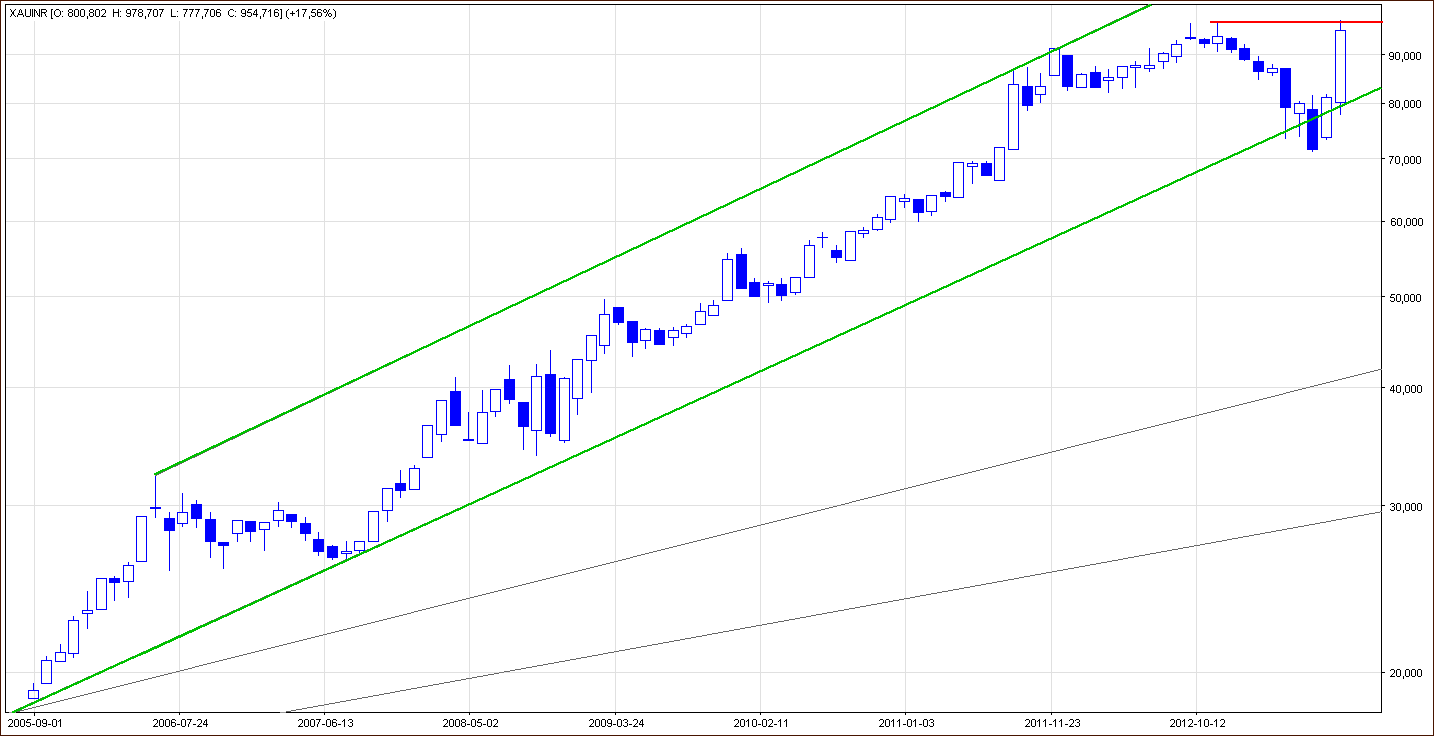
As you see on the monthly chart, the recent decline took the yellow metal below the lower border of the rising trend channel. Despite this downward movement, gold bulls managed to push the price of gold higher in July and the monthly candlestick closed in the range of the rising trend channel. In this way, the breakdown was invalidated. This positive event encouraged buyers to act and resulted in a sharp rally, which pushed the price of gold to its highest level since 1985.
When we take a look at the charts, we see that the price of gold has risen nearly 18% in August. This is gold's biggest monthly climb since July 1991.
Now, let's move on to the weekly chart and check the nearest support and resistance levels for the medium term.
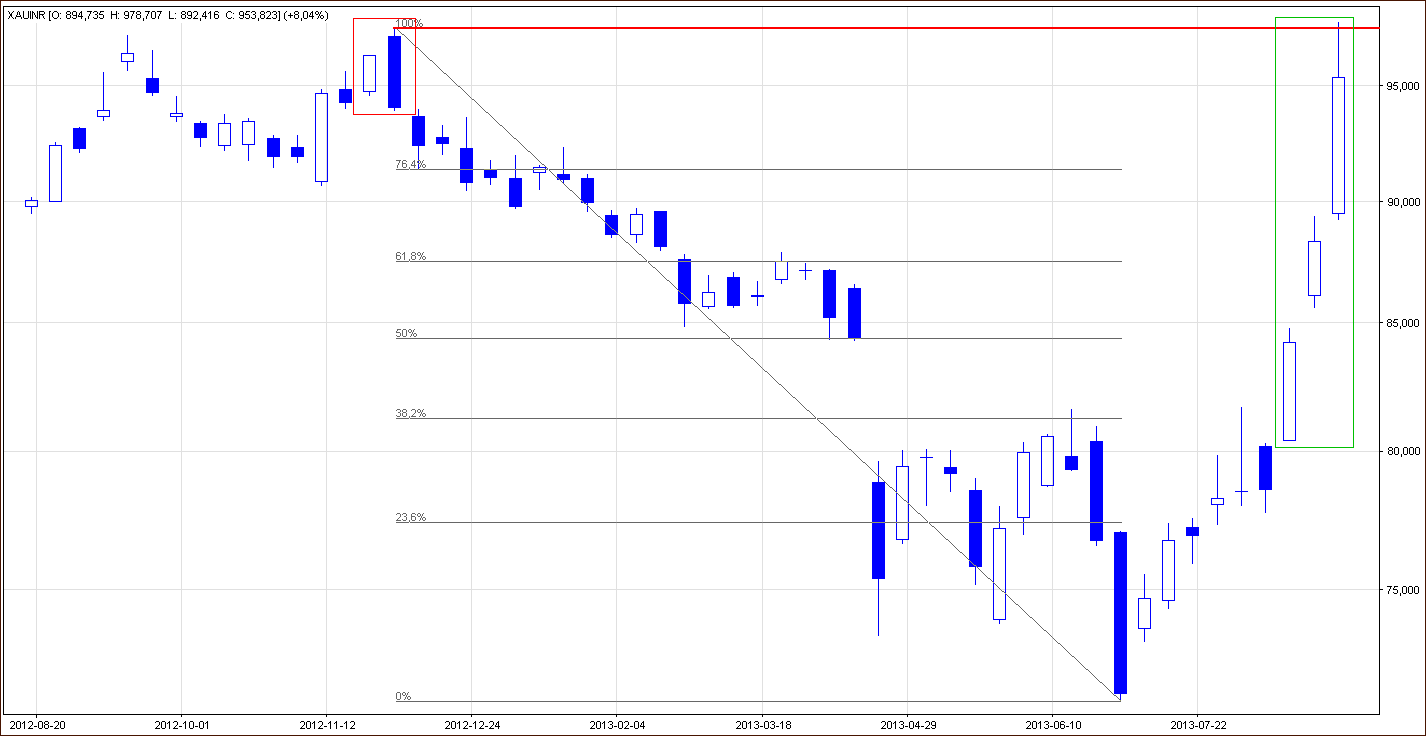
Looking at the above chart, we see that gold broke above all the Fibonacci retracement levels and touched the November 2012 top. However, from this perspective the breakout above this resistance level is not confirmed.
When we factor in the bearish engulfing pattern from 2012 we see that this strong resistance level may encourage gold bears to trigger a correction. In this case, the nearest medium-term support level is around Rs 89,241.
However, if the gold bulls do not fail and initiate further increases, the next price target for buyers will be above the Rs 100,00 level. Please note that the 113% Fibonacci extension level is at Rs 100,959 and the next one (the 127.2% level) is at Rs 104,762.
Once we know the current medium-term situation, let's examine the short-term chart.
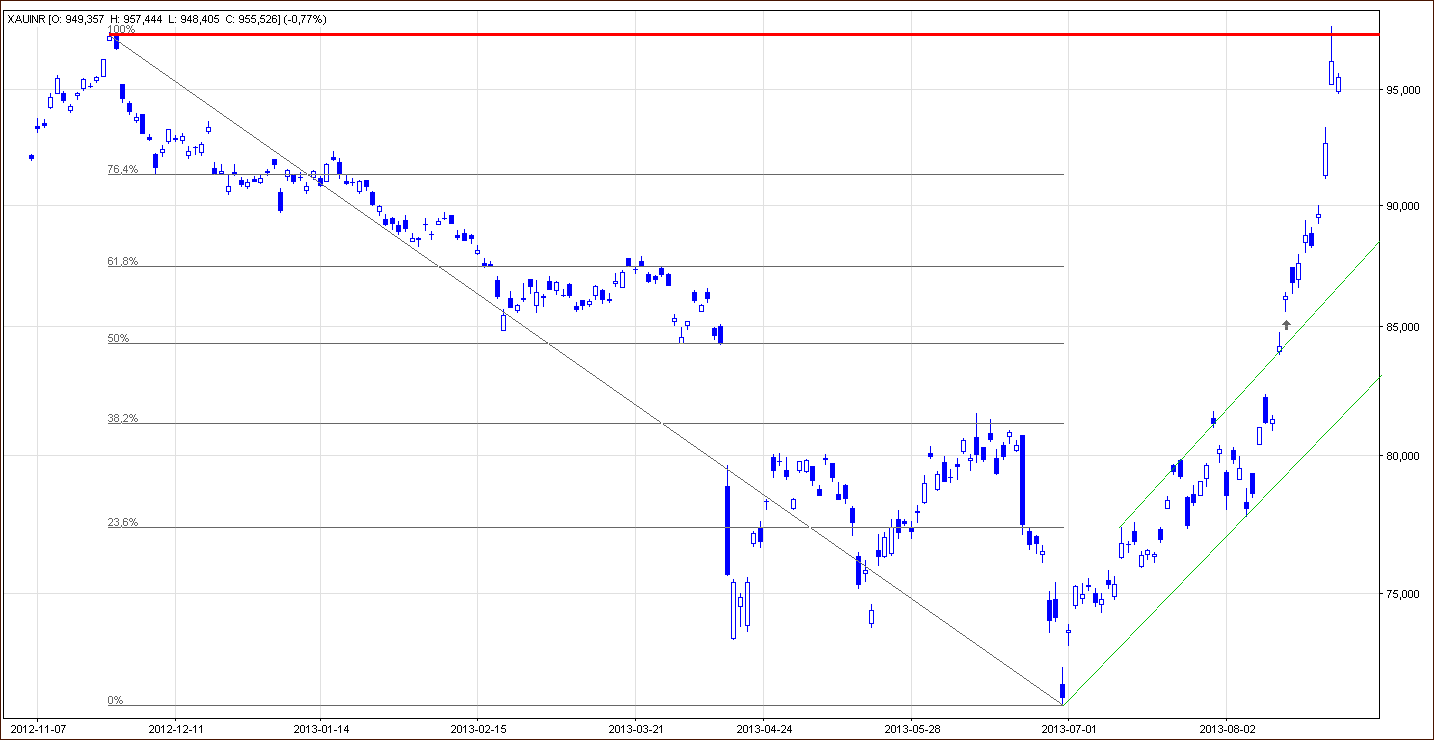
On the above chart we clearly see that the situation improved past week. Last Monday, after a higher open the yellow metal edged up and reached over Rs 86,000 per ounce.
Quoting my last week's gold analysis:
The nearest resistance level is the 150% Fibonacci extension level based on the decline from the June top to the June low (around Rs 86,817). Slightly above (around Rs 87,433 ) is also the 61.8% Fibonacci retracement level based on the entire decline from the 2012 top to the 2013 low, which together with the March top forms a strong resistance zone.
As you see on this daily chart, on Tuesday the above-mentioned resistance zone slowed further increases. Despite this little pause, gold bulls didn't give up and managed to push the price higher in the following days. Another small pause appeared around the next psychological barrier at Rs 90,000.
However, the proximity to this important resistance level didn't trigger a corrective move. Although we saw a small consolidation at the end of last week, gold bears showed their weakness and the yellow metal continued its rally.
Earlier this week, the buyers showed strength and broke above the previously mentioned psychological barrier at Rs 90,000. This positive circumstances encouraged them to push gold higher and the 76.4% Fibonacci retracement level was broken.
Yesterday, after another higher open, the yellow metal continued its sharp rally and reached the November 2012 top. As you see on the above chart there was a small breakout above this level, however, it has not been confirmed.
Will this improvement last longer? What's next?
As I previously wrote, if the gold bulls do not fail and initiate further increases, the next price target for buyers will be above the Rs 100,00 level. But what if investors take profits and trigger a correction?
When you take a look at the chart below, you will see support levels based on the Fibonacci retracement levels.
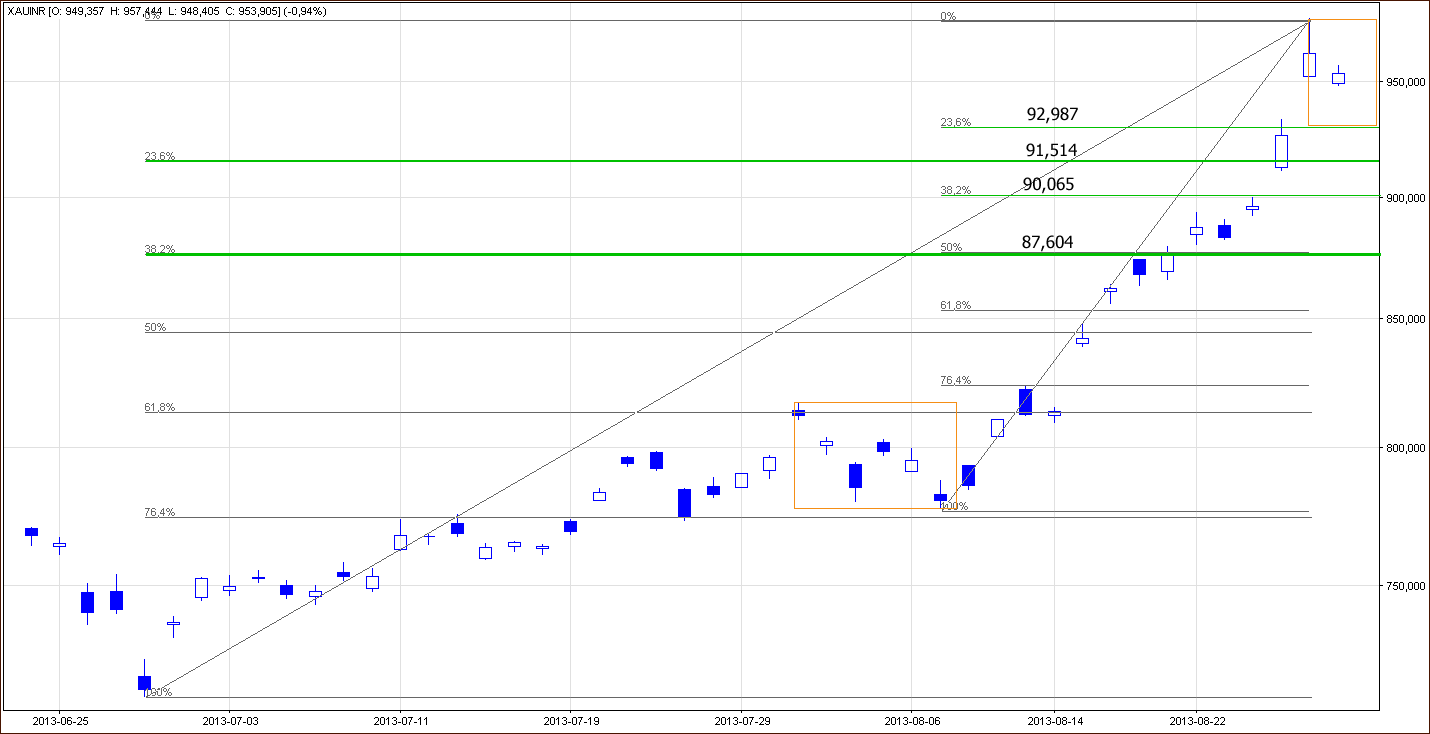
The nearest one is at the 23.6% Fibonacci retracement level based on the upward move from the August low to the August top (around the Rs 92,987 level). The second one is at the 23.6% Fibonacci retracement level based on the entire June-August rally (around the Rs 91,514 level).
Summing up, in the previous week gold rose nearly 5%. This week, the yellow metal extended gains and reached its highest level since 1985. Today, gold gave up the gains and lost 0.77%. Despite this small decline the uptrend is not threatened. Even if the sellers manage to reach the first 23.6% Fibonacci retracement level, the corrective move will be similar to the previous one. Therefore, the outlook for gold priced in rupees is bullish.
If you'd like to stay up-to-date with our latest free commentaries regarding gold, silver and related markets, please sign up today.
Thank you.
Nadia Simmons
Back