
On Monday, the Federal Reserve Bank of San Francisco published a report, which indicated that central bank is growing closer to raise interest rates. As a result, the US Dollar Index, which tracks the performance of the greenback against a basket of six other major currencies, climbed to a 14-month high. Since then, ongoing expectations that U.S. interest rates will be rise sooner rather than later have been supportive for the U.S. dollar, making crude oil and gold more expensive for holders of other currencies.
Yesterday, the price of light crude bounced off an eight-month low and climbed to almost $94 per barrel, supported by expectations that the EIA weekly report will show another drop in crude oil supplies and inventories at a key storage hub of Cushing, Okla. would stay low for longer than previously expected. Meanwhile, today’s government data disappointed market participants and crude oil hit a fresh multi-month low. What’s next? Is it possible that the gold-to-oil ratio will give us some interesting clues? Let’s examine charts and find out (charts courtesy of http://stockcharts.com).
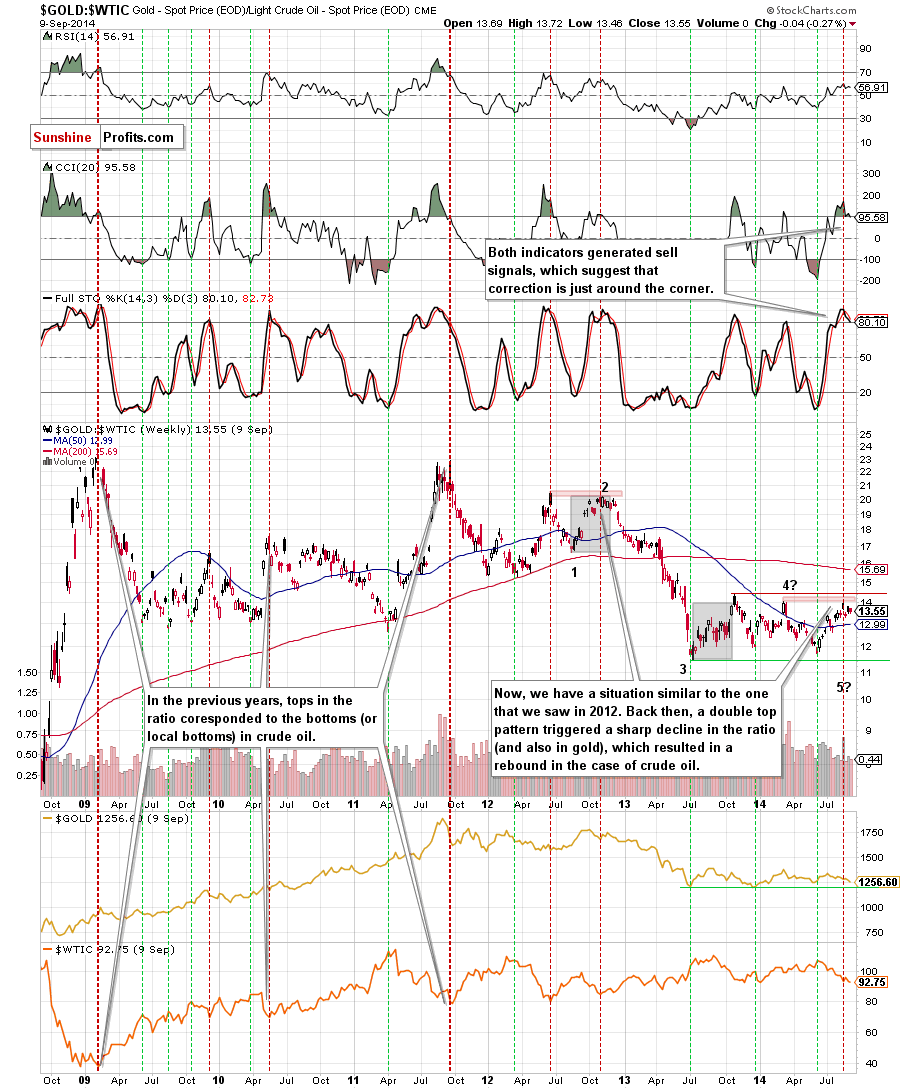
Looking at the above chart, we see that now we have a similar situation to the one that we saw in 2012 (we marked it with red). Back then, a double top pattern triggered a sharp decline in the ratio, which resulted in a rebound in crude oil. Based on that event, we think that we’ll see a drop in the ratio in the coming weeks – especially when we factor in the fact that the CCI and Stochastic Oscillator generated sell signals. On top of that, this bearish scenario is also reinforced by the current Elliott’s waves structure.
In our opinion, during the last year, the ratio was trading in the wave 4 (it was bigger than the wave 2 and has a different structure, which is in line with the Elliott Wave Theory). Therefore, it seems to us that the wave 5 is still ahead us. What does it mean for crude oil? As you see on the above chart, in the previous years, local tops in the ratio corresponded to the bottoms in crude oil. We saw such situations in February and December 2009, September 2011, June and October 2012. Taking into account the fact that history repeated itself in all these cases, we think that another decline in the ratio will trigger an upward move in light crude.
And what about gold? In 2011 lower values of the ratio have translated to declines in this commodity. We also saw such price action since November 2012 until June 2013 and later at the end of the previous year. In March, the local top in the ratio corresponded to the 2014 high in gold and the ratio’s local bottom in June appeared more or less at the same time as the bottom of the previous bigger correction in the commodity. All the above provides us with bearish implications and suggests that the final bottom in gold is still ahead us.
Thank you.
Nadia Simmons
Forex & Oil Trading Strategist
Forex Trading Alerts
Oil Investment Updates
Oil Trading Alerts
