
Earlier today, the U.S. dollar improved as a drop in the number of new unemployment claims suggested continued improvement in the labor market. The Labor Department said in its report that initial claims for jobless benefits decreased by 15,000 to a seasonally adjusted 330,000 in the week ended Jan. 4 (while economists had expected 335,000 new claims for the week). What impact did it have on major currency pairs? If you want to know our take on this question, we invite you to read our today's Forex Trading Alert.
Forex Trading Positions - Summary:
EUR/USD
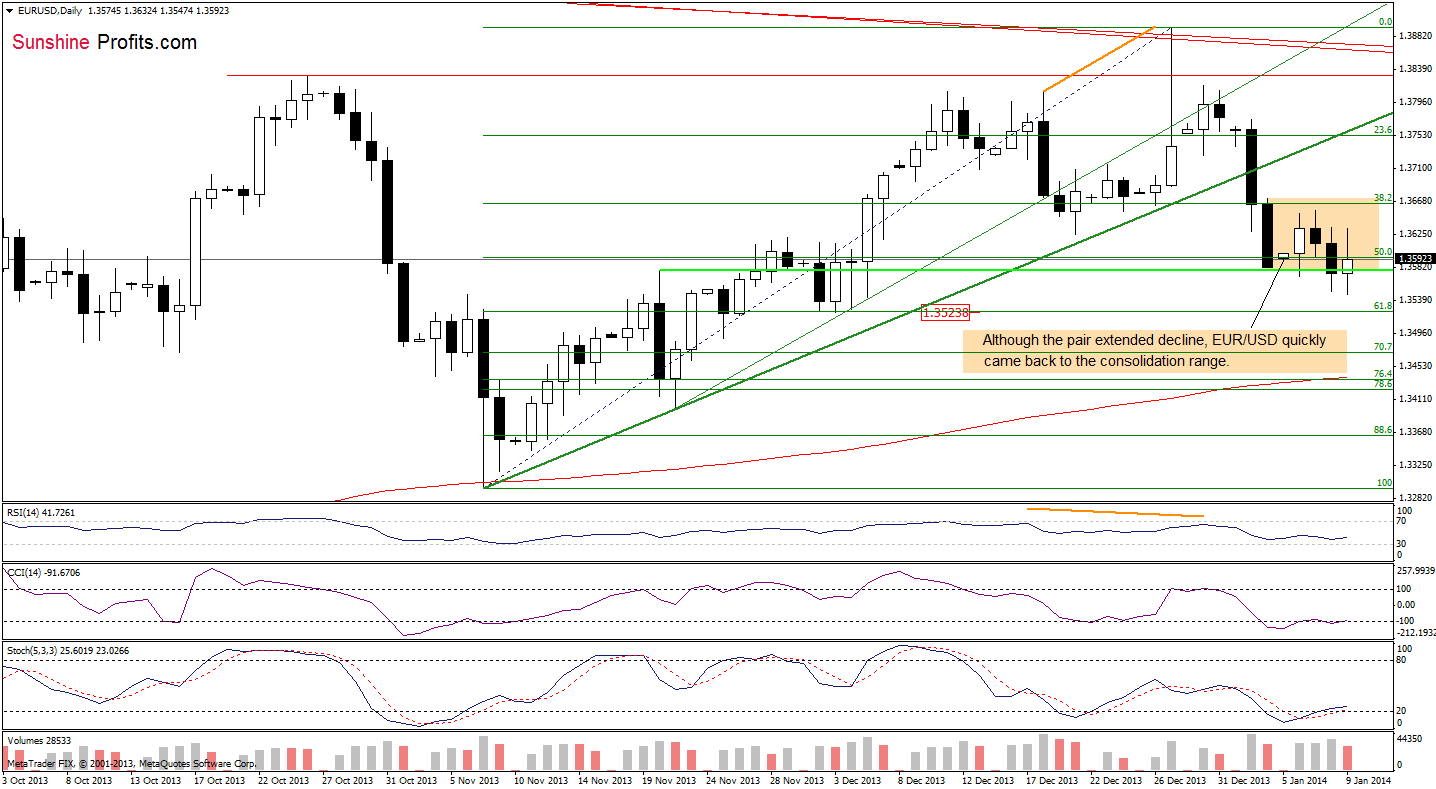
On the above chart, we see that we had another small breakdown below the lower border of a consolidation range earlier today. Despite this drop, it was quickly invalidated, which is a positive sign (as a reminder, we saw similar price action yesterday). From this perspective, we can sum up the recent days in one simple sentence: although a lot has happened nothing, nothing significant has happened. The main reason, which likely triggered such volatility is the medium-term rising support line (marked with orange) on the weekly chart below.
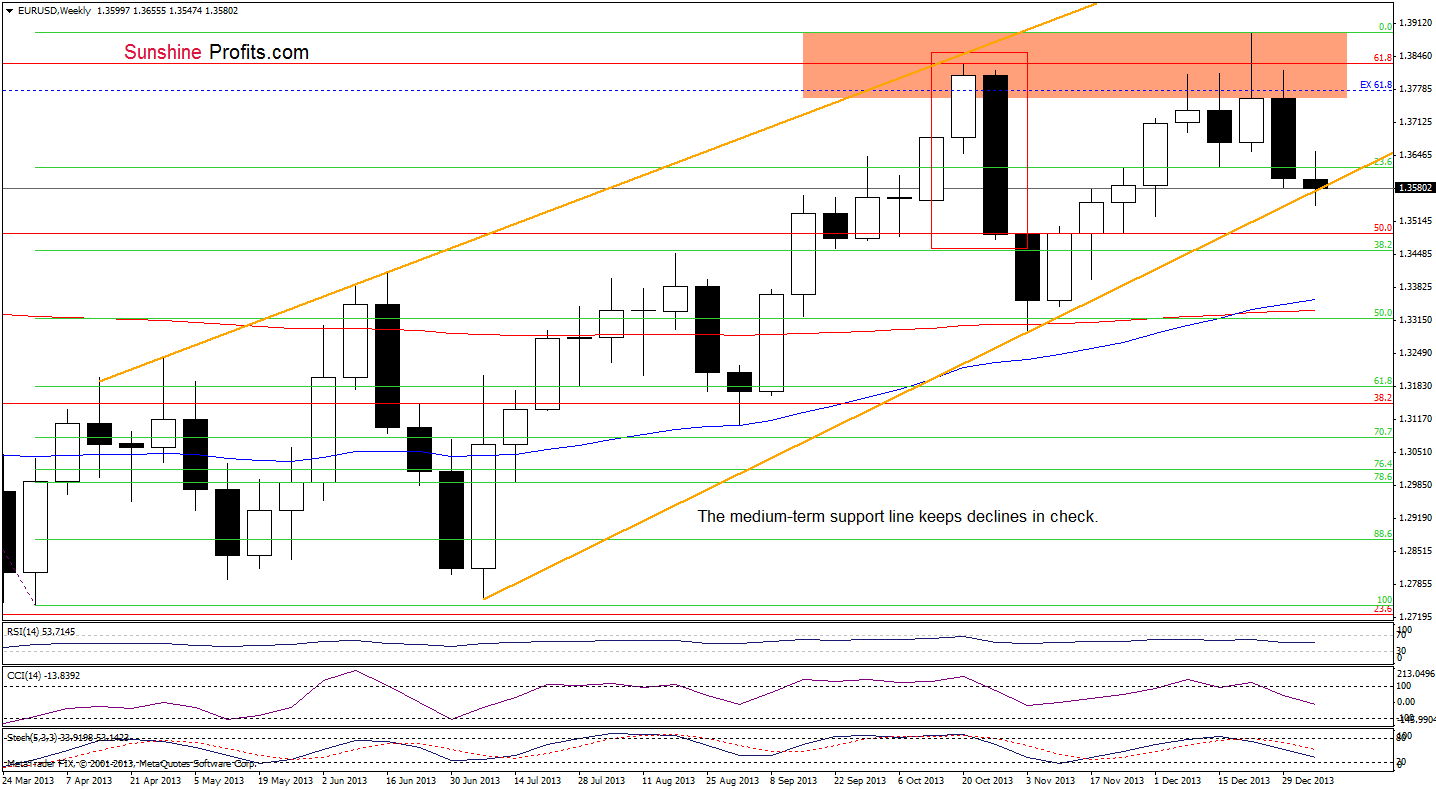
As you see on the above chart, although EUR/USD broke below the medium-term support line, the breakdown was quickly invalidated, which shows the importance of this line. If it is broken, the current decline will likely accelerate and the first downside target will be the 38.2% Fibonacci retracement level based on the entire March-December rally (around 1.3457).
Before we summarize this section, please note that buy signals generated by the CCI and Stochastic Oscillator remain in place. Additionally, the RSI remains at its lowest level since Nov. 20. Back then, such a low reading of the indicator had a positive impact on the euro, which improved against the U.S. dollar. Nevertheless, the medium-term support line is much more important at the moment.
Very short-term outlook: mixed
Short-term outlook: mixed with bearish bias
MT outlook: mixed
LT outlook: bearish
Trading position (short-term): we do not suggest opening any trading positions at the moment. We will keep you informed should anything change, or should we see a confirmation/invalidation of the above.
GBP/USD
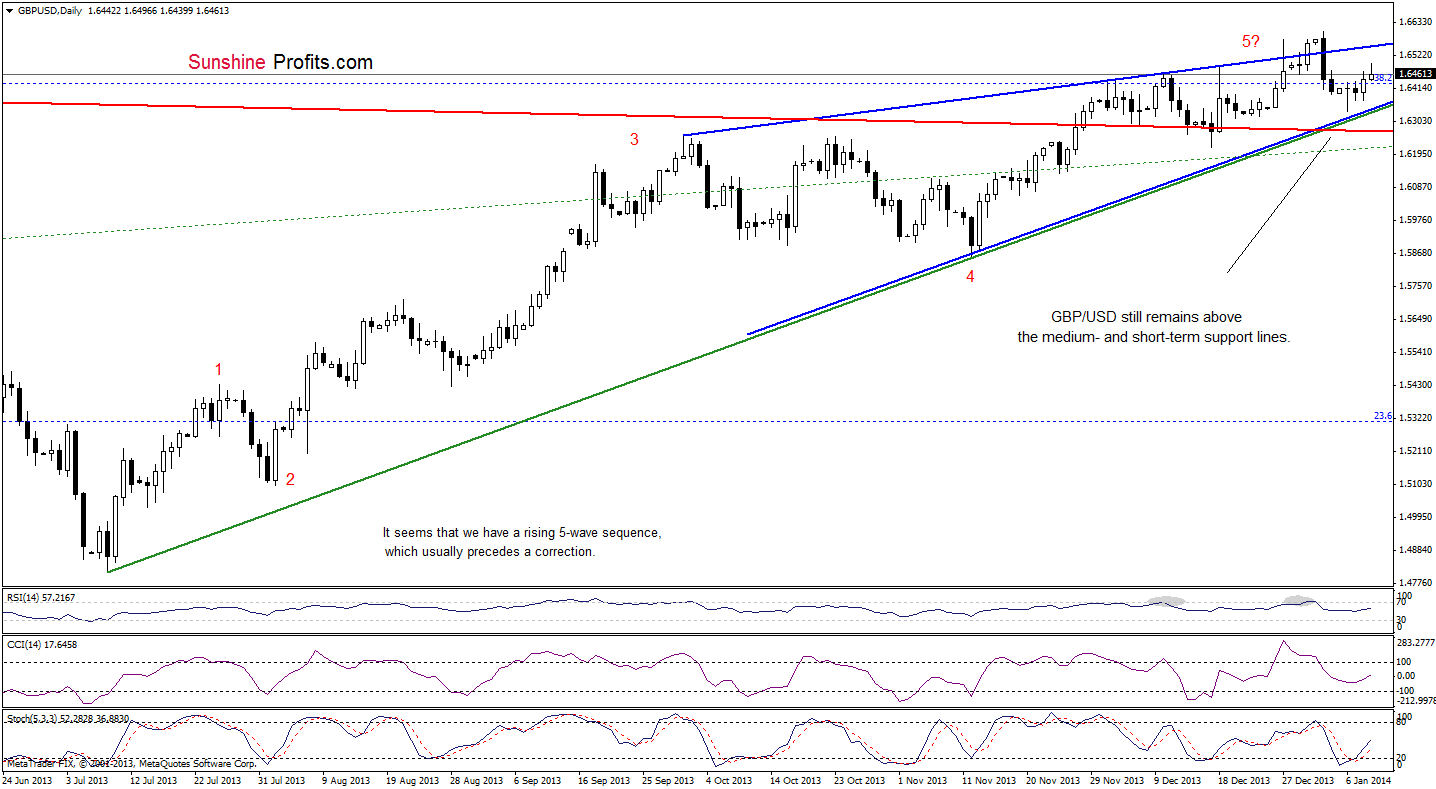
On the above chart, we see that GBP/USD has gone up once again, but overall, the situation hasn’t changed much from this perspective. The pair still remains above both support lines (the green short-term rising support line and the red long-term support line), which keep declines in check. This is a positive sign for the pound and further improvement should not surprise us.
Please note that the pair remains in a rising wedge (marked with blue) and it seems that the breakout above the upper border of this formation (or the breakdown below the lower border) will trigger a bigger upside (or downside) move.
Very short-term outlook: mixed
Short-term outlook: bullish
MT outlook: bullish
LT outlook: mixed
Trading position (short-term): we do not suggest opening any trading positions at the moment. We will keep you informed should anything change, or should we see a confirmation/invalidation of the above.
USD/JPY
Quoting our previous Forex Trading Alert:
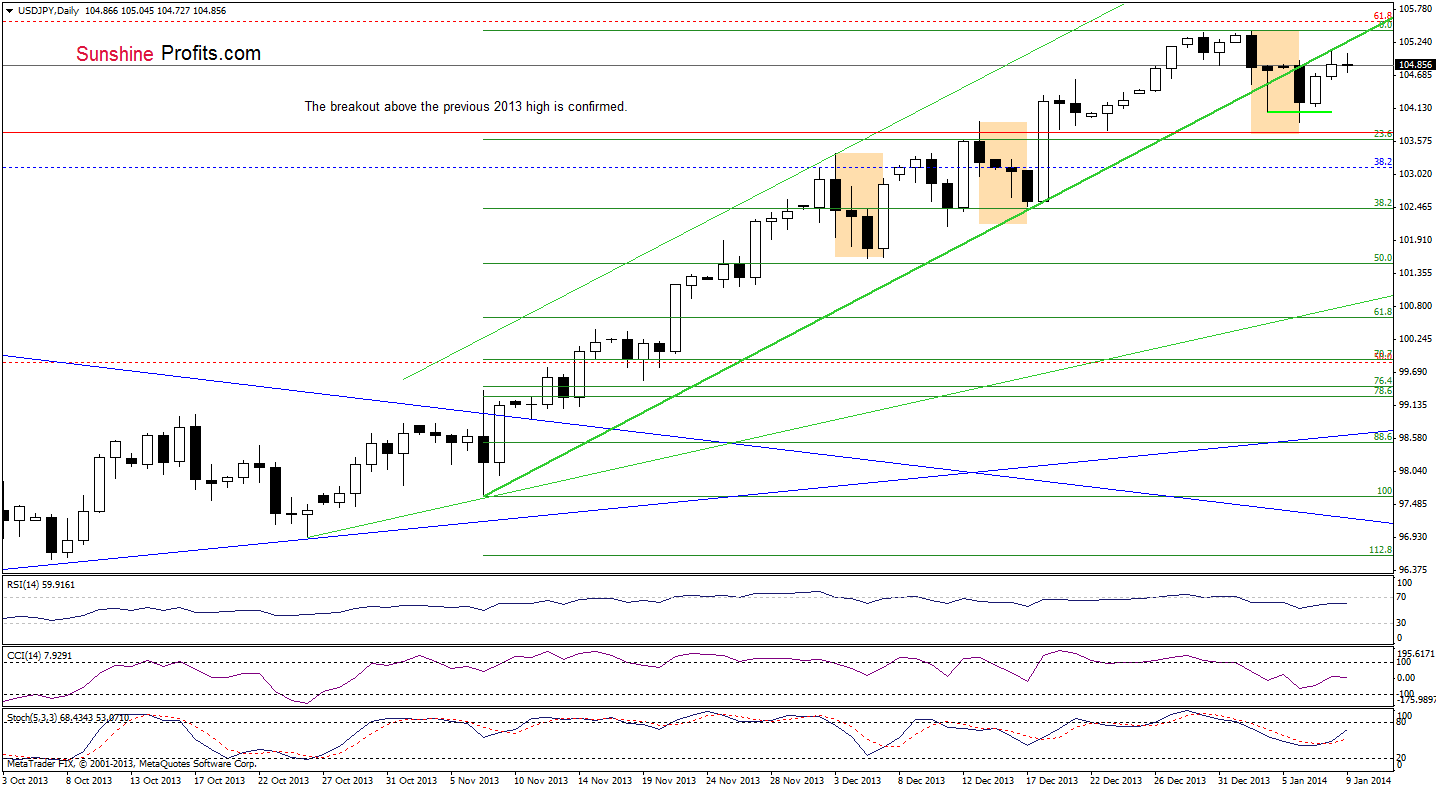
(…) if the buyers fail, the current increase might be nothing more than a verification of the breakdown. In this case, such price action would likely trigger another corrective move and the first downside target would be Monday’s low.
Looking at the above chart, we see that USD/JPY still remains below the previously-broken short-term rising line and the breakdown is confirmed (we saw three consecutive daily closes below this line), which is a negative signal.
Taking the above into account, we may see further deterioration in the coming day (or days). Nevertheless, we should keep in mind that even if the pair drops to 103.67, the current correction will be similar to the previous ones and the uptrend will not be threatened.
Very short-term outlook: mixed with bearish bias
Short-term outlook: bullish
MT outlook: bullish
LT outlook: bearish
Trading position (short-term): we do not suggest opening any trading positions at the moment. We will keep you informed should anything change, or should we see a confirmation/invalidation of the above.
USD/CAD
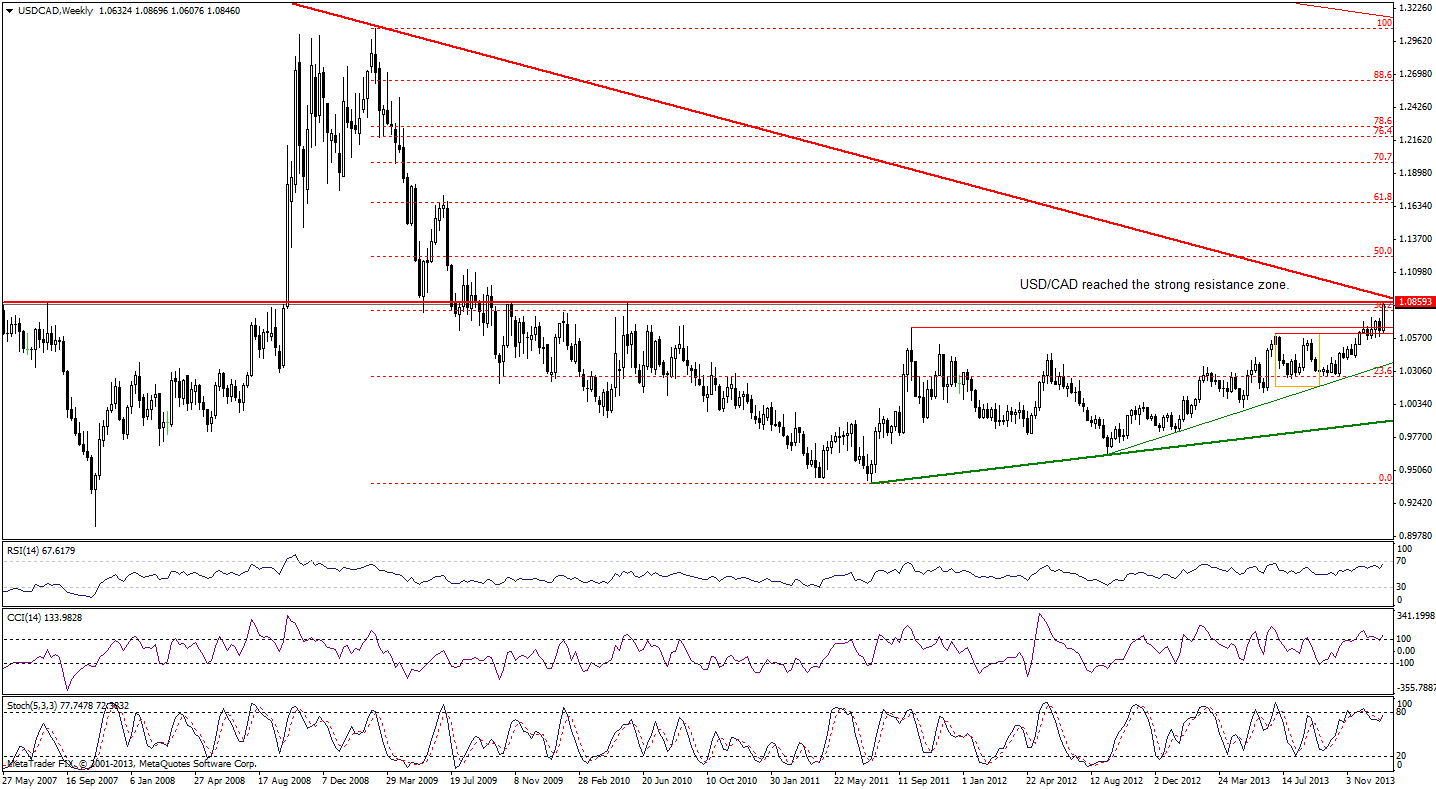
Today we’ll start our analysis of USD/CAD with the weekly chart. Looking at the above chart, we see that the pair almost reached the strong resistance zone created by the November 2009 and May 2010 highs (slightly above the 38.2% retracement) and the long-term declining resistance line. This negative combination may encourage sellers to act – especially when we take into account the position of the RSI, which almost reached the level of 70. On top of that, there are negative divergences between both other indicators and the exchange rate, which is another bearish signal that prescribes caution.
Connecting the dots, even if the pair climbs a bit higher, the space for further growth will likely be limited in near future by the long-term declining resistance line.
Let’s zoom our picture, and take a closer look at the daily chart.
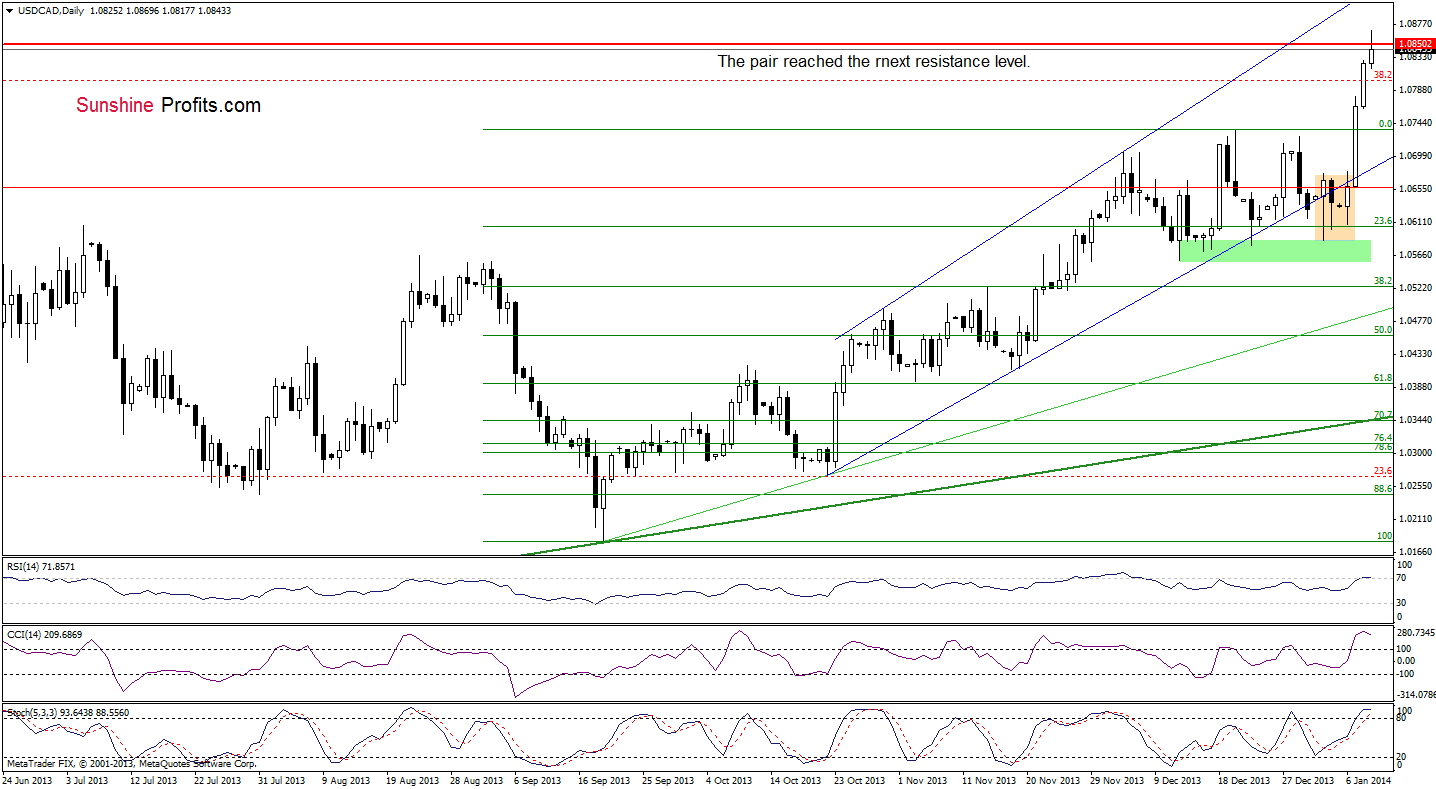
On the above chart, we see that the pair continued its rally today and reached the next resistance level created by the November 2009 and May 2010 highs. Despite this increase, we clearly see that the bodies of the consecutive candlesticks are getting smaller, which suggests that the strength of the buyers waned in the recent days. Additionally, the RSI rose above the level of 70 and both other indicators are overbought, which prescribes caution and may trigger a correction in the near future.
Very short-term outlook: bullish
Short-term outlook: bullish
MT outlook: bullish
LT outlook: bearish
Trading position (short-term): we do not suggest opening any trading positions at the moment. We will keep you informed should anything change, or should we see a confirmation/invalidation of the above.
USD/CHF
In our last Forex Trading Alert, we wrote:
(…) we should keep in mind that the RSI approached the level of 70 and both other indicators are overbought (additionally the Stochastic Oscillator generated a sell signal). Therefore, a pause or a pullback in the near future should not surprise us.
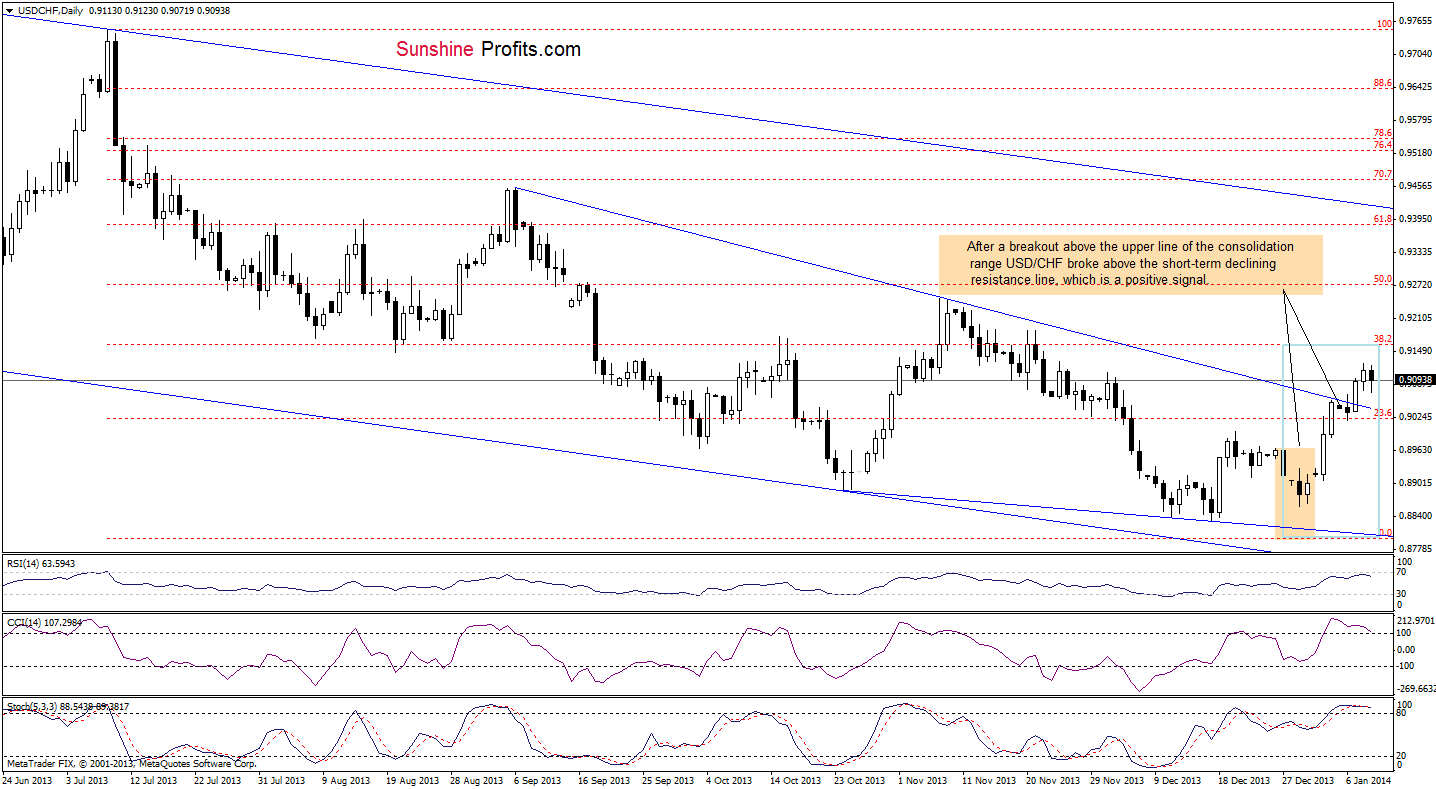
Looking at the above chart, we see that we had such price action earlier today. Although we saw a small drop during the European session, the pair still remains above the previously-broken short-term declining resistance line based on the September and November highs. As we wrote yesterday, the nearest upside target for the buyers is the 38.2% Fibonacci retracement level based on the Jul. - Dec. decline.
Please note that the RSI still remains slightly below the level of 70 and both other indicators are overbought. A sell signal generated by the Stochastic Oscillator remains in place. Additionally, we can notice a negative divergence between the CCI and the exchange rate, which is a negative sign.
Taking all the above into account, further deterioration (or a bigger pause) in the near future should not surprise us.
Very short-term outlook: mixed
Short-term outlook: bearish
MT outlook: bearish
LT outlook: bearish
Trading position (short-term): we do not suggest opening any trading positions at the moment. We will keep you informed should anything change, or should we see a confirmation/invalidation of the above.
Thank you.
Nadia Simmons
Forex & Oil Trading Strategist
Oil Investment Updates
Oil Trading Alerts
