
Earlier today, the U.S. dollar improved as U.S. retail sales and core retail sales suggested continued improvement in the U.S. economy. The Commerce Department said that U.S. retail sales rose 0.2% last month (beating expectations for a 0.1% increase), while core retail sales, which exclude automobile sales, climbed 0.7% in December (above forecasts for a 0.4% increase). What impact did it have on major currency pairs? If you want to know our take on this question, we invite you to read our today's Forex Trading Alert.
Forex Trading Positions - Summary:
EUR/USD
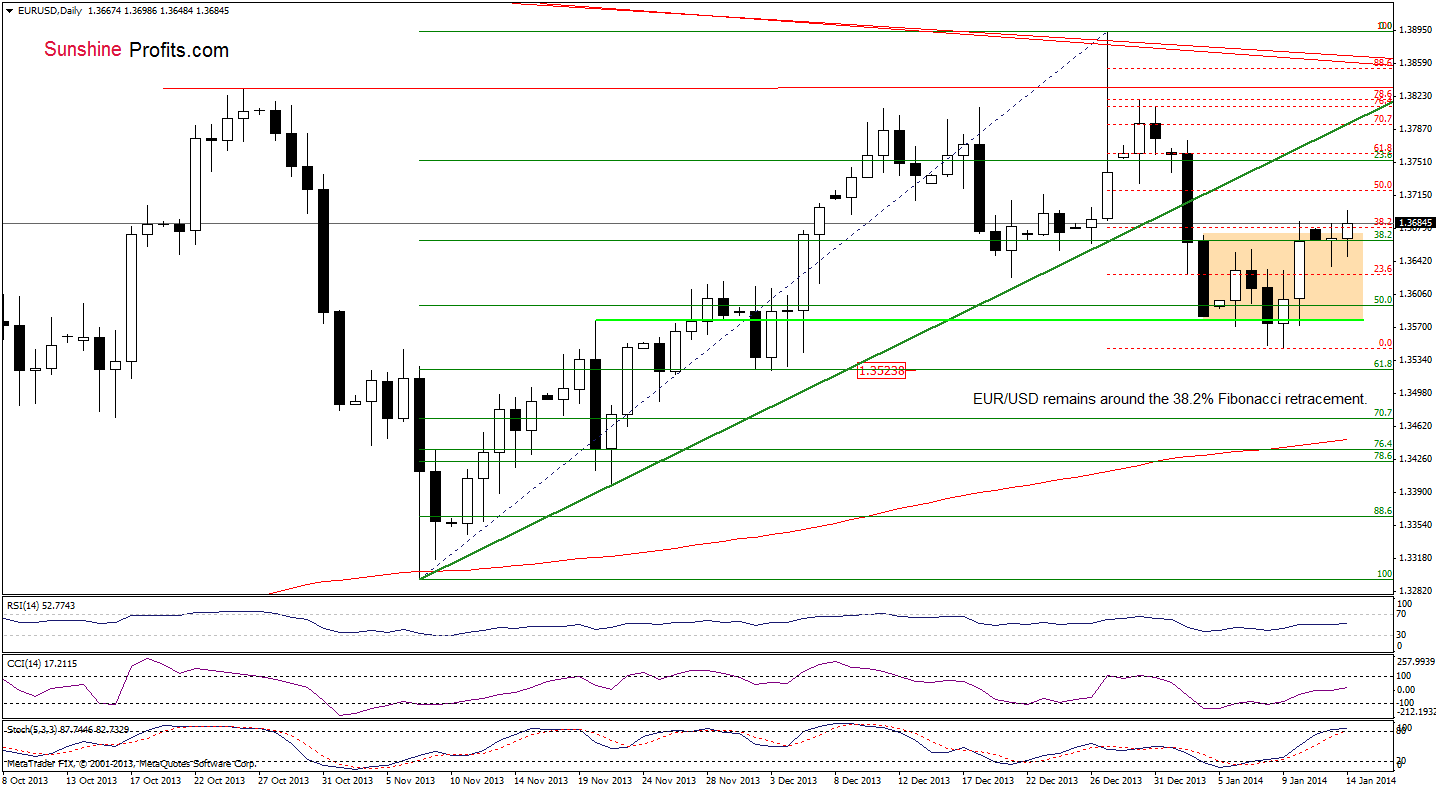
On the above chart, we see that EUR/USD is trading in a narrow range slightly below the 38.2% Fibonacci retracement level based on the recent decline. What we’re seeing right now could become the right shoulder of the bearish head-and-shoulders formation. Actually, it seems quite likely that it will be completed, as the currency pair has already verified the breakdown below the rising support line. At this time, however, the situation is unclear and we will wait for this above-mentioned move lower, and perhaps a confirmation of the head-and-shoulders pattern, before suggesting opening short positions. On the other hand, another move higher, and a clear invalidation of the pattern would be a bullish factor, and something that would make us suggest going long (unless something else happened as well which could nullify this signal).
Very short-term outlook: mixed
Short-term outlook: mixed with bearish bias
MT outlook: mixed
LT outlook: bearish
Trading position (short-term): we do not suggest opening any trading positions at the moment. We will keep you informed should anything change, or should we see a confirmation/invalidation of the above.
GBP/USD
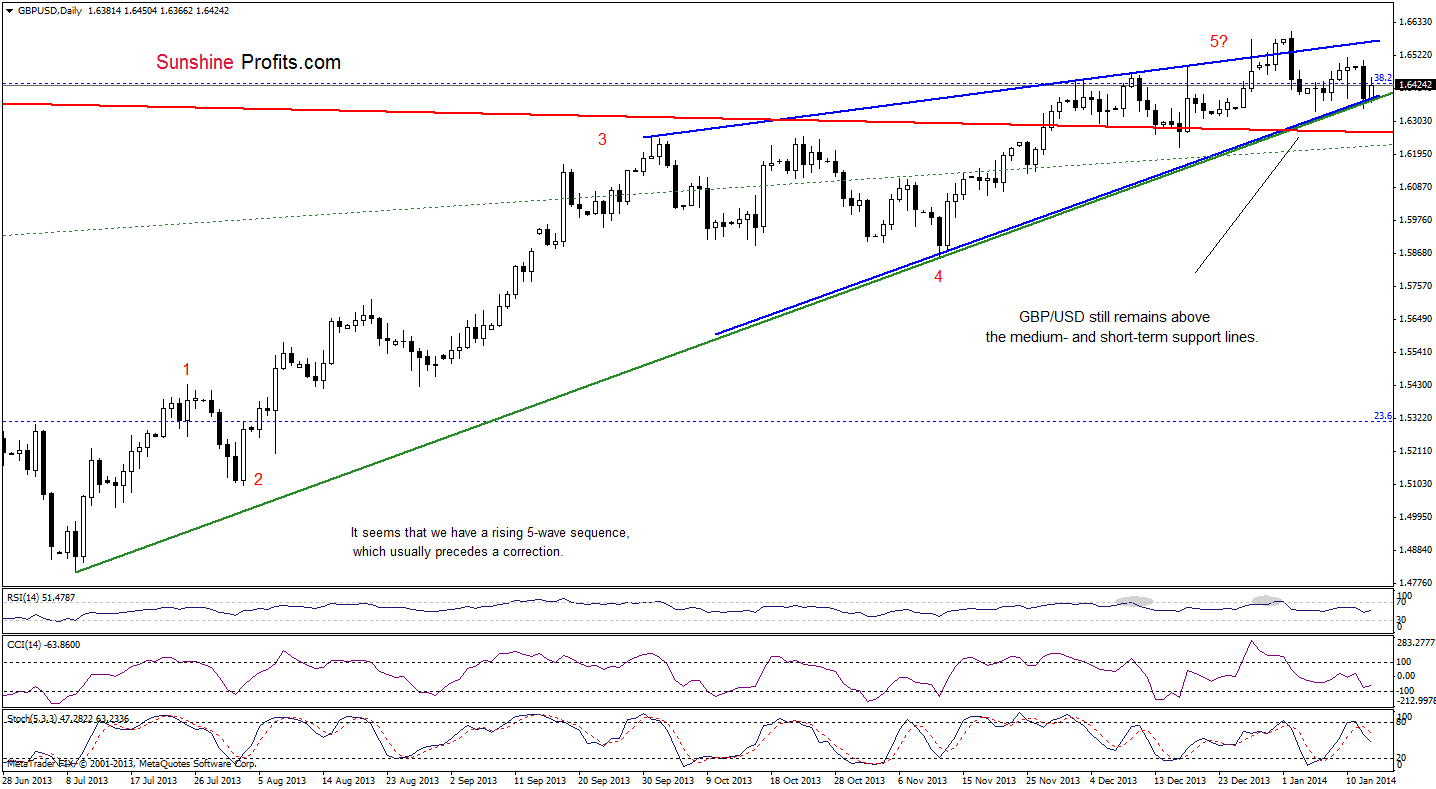
On the above chart, we see that after yesterday’s decline to the short-term rising support line (which is also the lower border of a rising wedge) GBP/USD rebounded and erased most of Monday’s drop. Despite this increase, the situation hasn’t changed much from this perspective as the pair still remains above both support lines (the green short-term rising support line and the red long-term support line), which keep declines in check.
As a reminder, the pair also remains in a rising wedge (marked with blue) and it seems that the breakout above the upper border of this formation (or the breakdown below the lower border) will trigger a bigger upside (or downside) move.
Very short-term outlook: mixed
Short-term outlook: bullish
MT outlook: bullish
LT outlook: mixed
Trading position (short-term): we do not suggest opening any trading positions at the moment. We will keep you informed should anything change, or should we see a confirmation/invalidation of the above.
USD/JPY
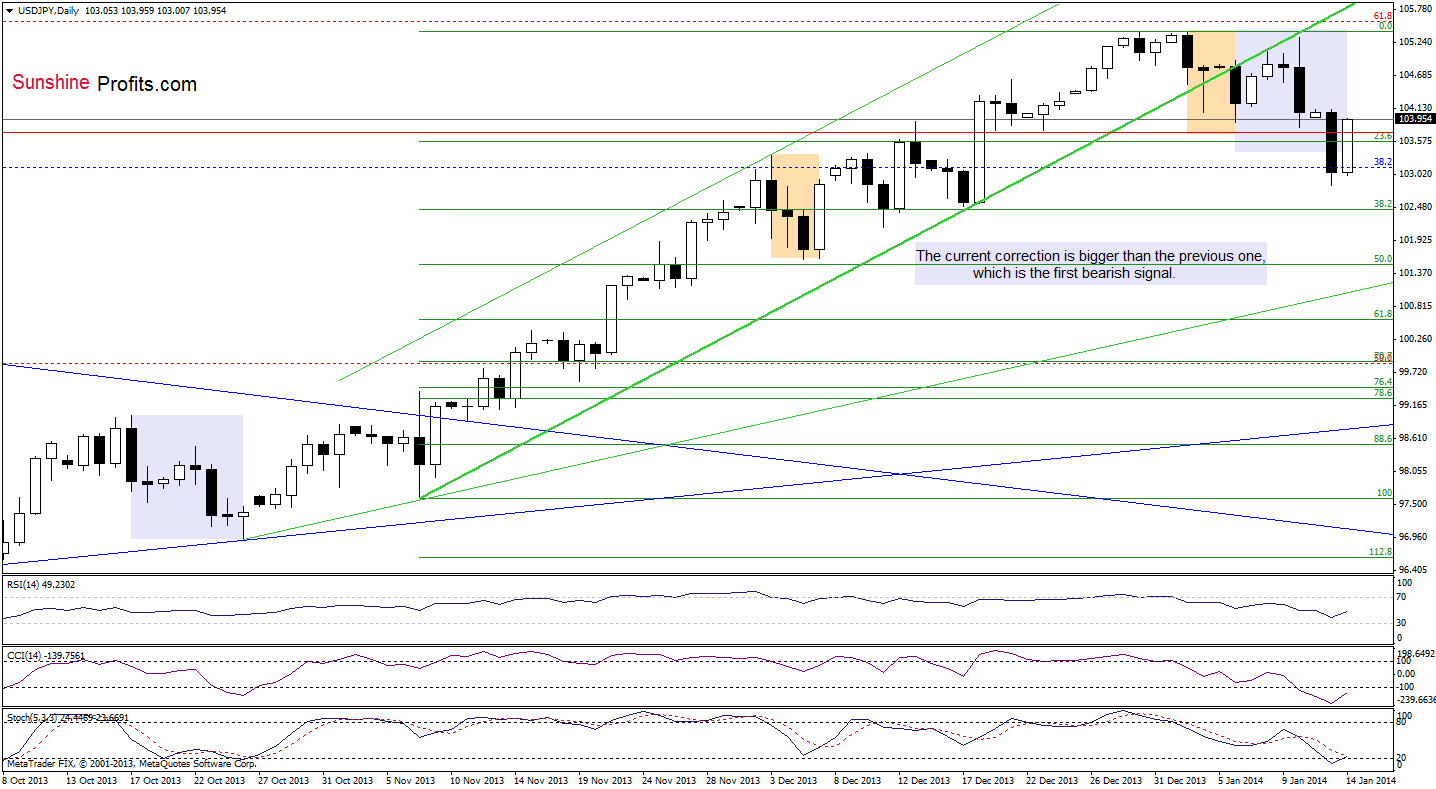
On the above chart, we see that although USD/JPY increased and corrected most of Monday’s drop it still remains below the previously-broken short-term rising line (the breakdown is confirmed) and the short-term outlook remains bearish. At this time we also see a correction to the previous intra-day lows without invalidating this breakdown. With two confirmed breakdowns it does seem that the next move will be to the downside. However, today’s move up is quite strong and if we invalidate the breakdown below intra-day lows, the outlook will quickly become bullish. Therefore while we are very close to opening a short position here, we will wait for an additional confirmation.
Very short-term outlook: bearish
Short-term outlook: mixed
MT outlook: bullish
LT outlook: bearish
Trading position (short-term): we do not suggest opening any trading positions at the moment. We will keep you informed should anything change, or should we see a confirmation/invalidation of the above.
USD/CAD
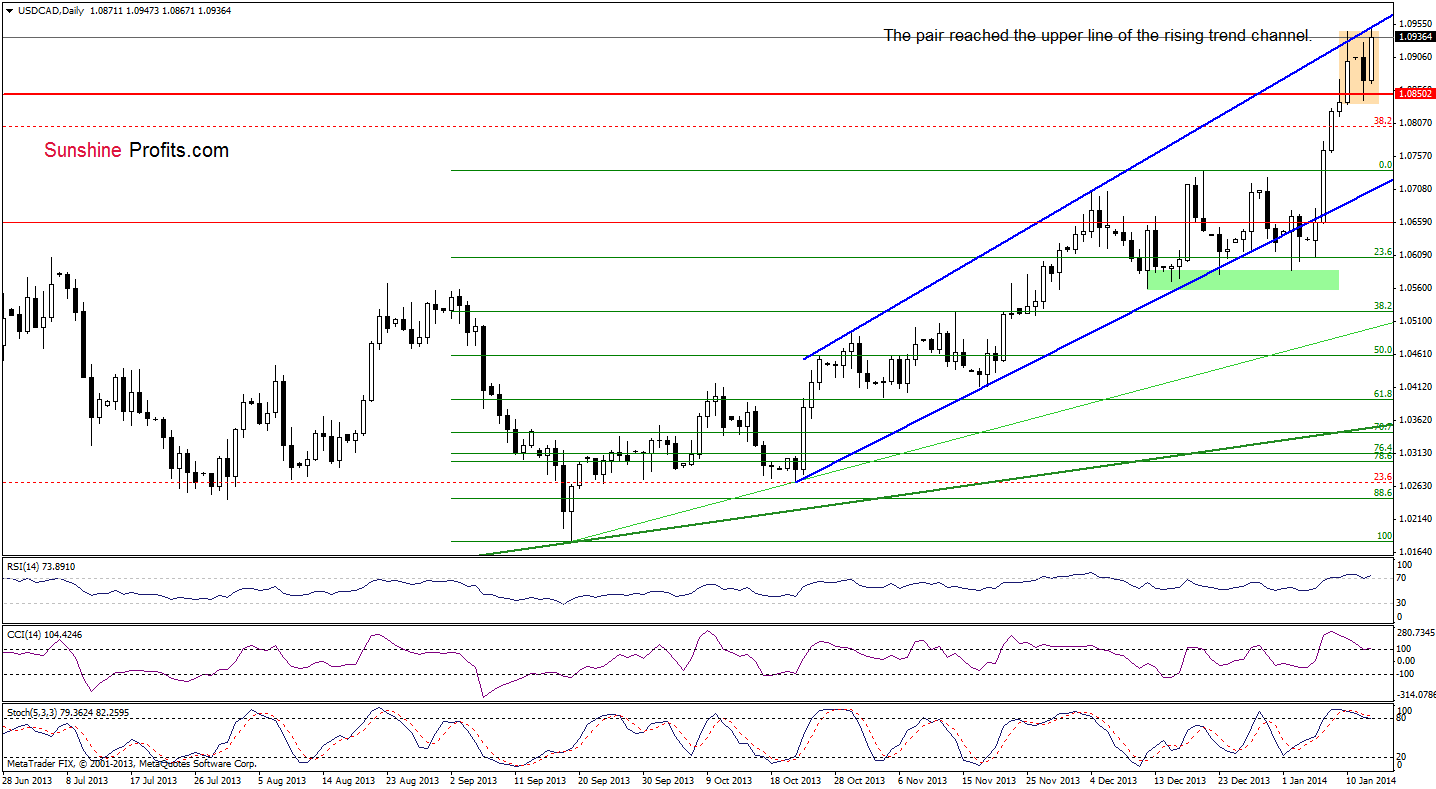
Looking at the above chart, we see that USD/CAD extended gains and hit a fresh four-year high. Despite this improvement, the pair remains slightly below the upper line of the rising trend channel, which intersects with the long-term declining resistance line seen on the weekly chart. These two strong resistance lines in combination with the position of the indicators will likely encourage sellers to act and stop further improvement.
Quoting our last Forex Trading Alert:
(…) the RSI and two other indicators are overbought and there are negative divergences between the CCI, Stochastic Oscillator and the exchange rate, which is a bearish signal. Taking these facts into account we may see a reverse of the current rally in the coming day (or days).
Very short-term outlook: mixed
Short-term outlook: bullish
MT outlook: bullish
LT outlook: bearish
Trading position (short-term): we do not suggest opening any trading positions at the moment. We will keep you informed should anything change, or should we see a confirmation/invalidation of the above.
USD/CHF
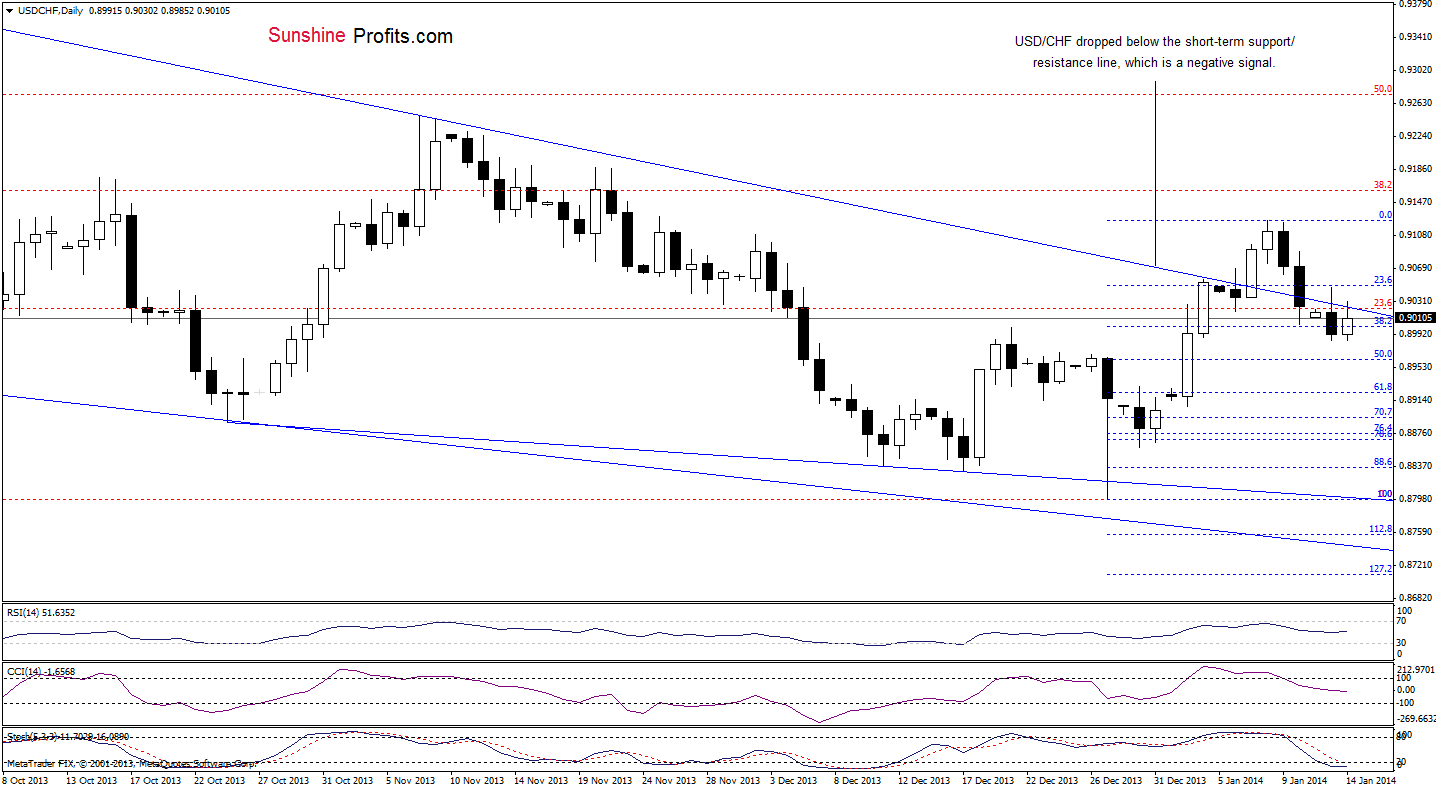
On the above chart, we see that although there was an attempt to invalidate the breakdown below the short-term declining resistance line the buyers failed and USD/CHF is still trading slightly below this line.
If the invalidation of the breakdown was more visible and not followed by a daily upswing, we would be probably suggesting opening short positions right now, but given the most recent move higher, the situation seems unclear once again.
With the preceding downswing, the pair reached the 38.2% Fibonacci retracement level based on the recent rally. Taking this support into account, we may see an upward corrective move, which will be more likely if the pair invalidates the breakdown below the short-term support/resistance line. In this case, the upside target will be Wednesday’s high.
On the other hand, if this support doesn’t encourage the buyers to act, we will likely see further deterioration (at least) to the upper line of the recent consolidation range (around 0.8965), which intersects with the next Fibonacci retracement.
Very short-term outlook: mixed
Short-term outlook: bearish
MT outlook: bearish
LT outlook: bearish
Trading position (short-term): we do not suggest opening any trading positions at the moment. We will keep you informed should anything change, or should we see a confirmation/invalidation of the above.
Thank you.
Nadia Simmons
Forex & Oil Trading Strategist
Forex Trading Alerts
Oil Investment Updates
Oil Trading Alerts
