
Earlier today, the greenback extended gains against major currencies as U.S. producer price inflation rose at the strongest rate in six months in December. Data showed that producer price inflation rose 0.4% last month, (which is the biggest increase since June), recovering from a 0.1% decline in November. Meanwhile, core PPI was up 0.3% in December, compared to expectations for a monthly increase of 0.1%. What impact did it have on major currency pairs? If you want to know our take on this question, we invite you to read our today's Forex Trading Alert.
Forex Trading Positions - Summary:
- EUR/USD: open short position with stop-loss level at 1.3699 only if EUR/USD close below 1.3588
- GBP/USD: short position (stop-loss level: 1.6515)
- USD/JPY: none
- USD/CAD: none
- USD/CHF: long position (stop-loss level: 0.8985)
- AUD/USD: none
EUR/USD
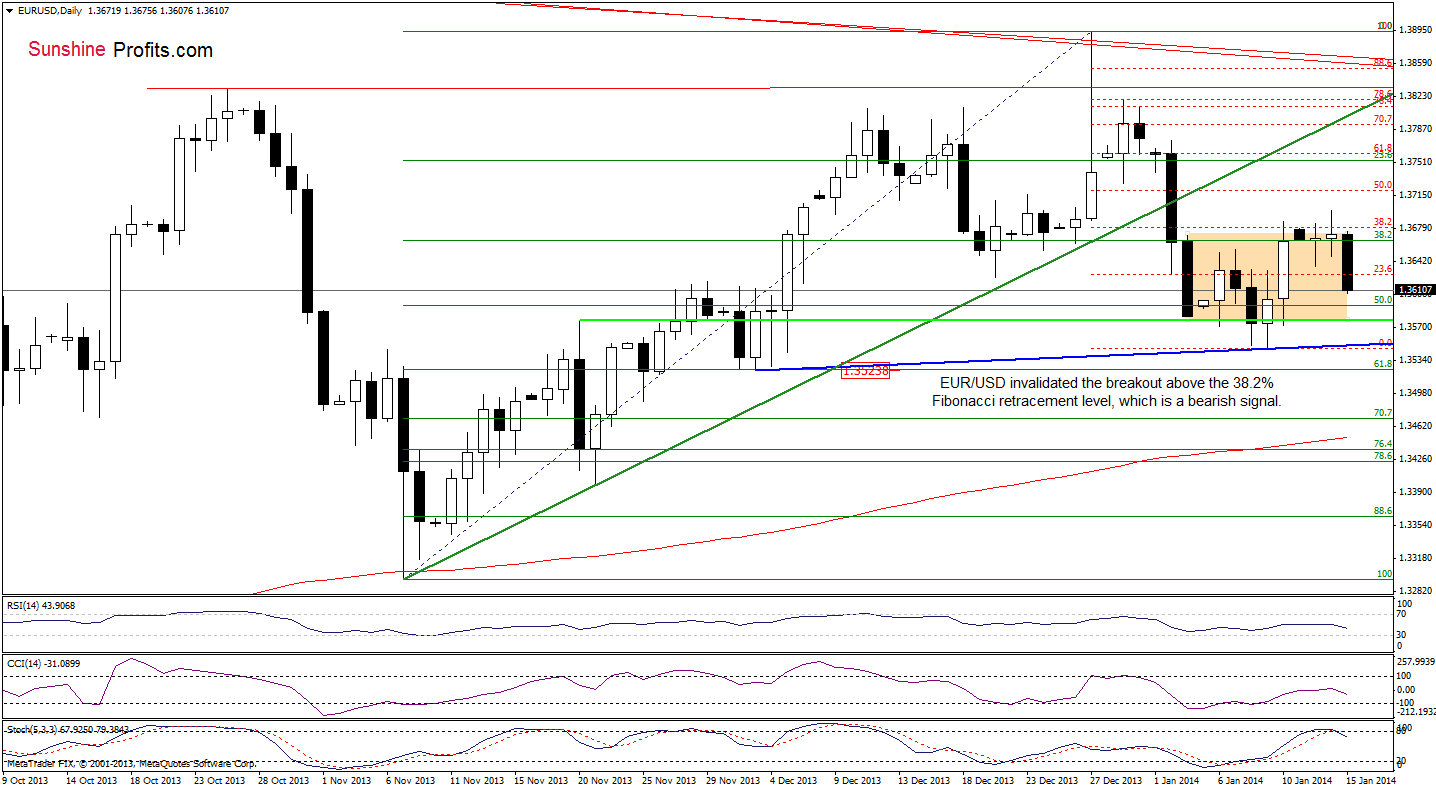
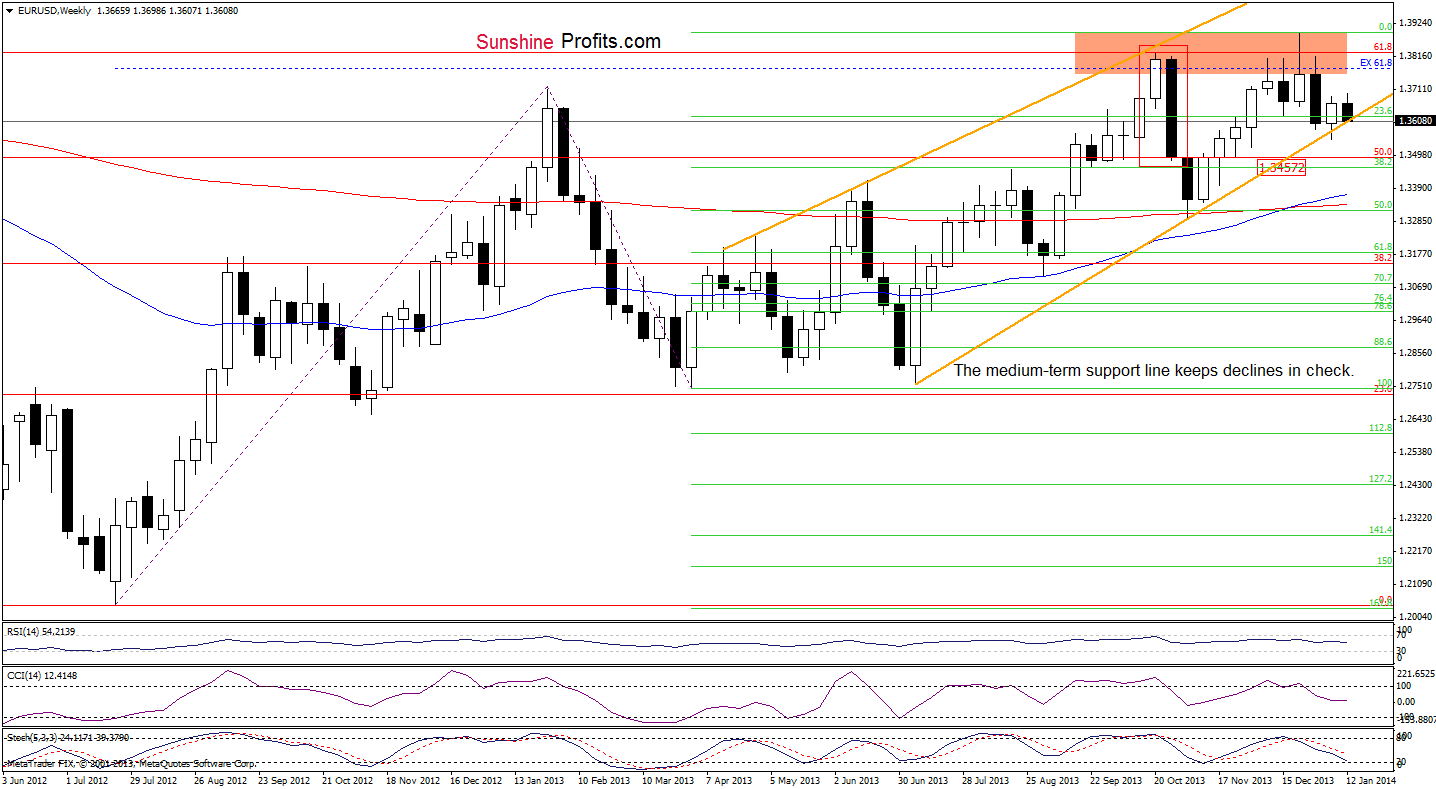
On the above chart, we see that EUR/USD invalidated the breakout above the 38.2% Fibonacci retracement level based on the recent decline. This was a bearish signal, which triggered a quite sharp decline during the European session. In this way, the pair erased over 50% of earlier gains and reached the medium-term rising support line (seen on the weekly chart) once again. You can see this price action more clearly on the chart below.
In our Forex Trading Alert on Monday we wrote:
(…) as long as the pair remains above the medium-term rising support line the space for further declines is limited. However, if it is broken, the current decline will likely accelerate and the first downside target will be the 38.2% Fibonacci retracement level based on the entire March-December rally (around 1.3457).
Looking at the current situation on the above charts, it seems that a bigger downward move is just around the corner. If the pair drops lower and breaks below the above-mentioned medium-term rising support line (an additional confirmation of the bearish scenario would be a breakdown below the previous week’s low), we will likely see further deterioration and suggest opening short positions.
As mentioned earlier, the first downside target will be the 38.2% Fibonacci retracement level, however, taking into account the importance of the medium-term rising support line, it seems that the correction will be deeper and we could see a downward move to around 1.3349.
The above bearish scenario is in tune with what we wrote in our yesterday’s Forex Trading Alert:
(…) what we’re seeing right now could become the right shoulder of the bearish head-and-shoulders formation. Actually, it seems quite likely that it will be completed, as the currency pair has already verified the breakdown below the rising support line. At this time, however, the situation is unclear and we will wait for this above-mentioned move lower, and perhaps a confirmation of the head-and-shoulders pattern, before suggesting opening short positions.
Very short-term outlook: bearish
Short-term outlook: mixed with bearish bias
MT outlook: mixed
LT outlook: bearish
Trading position (short-term): if the pair closes the day below the medium-term support line, we will suggest opening short positions. The stop-loss level for this position is at 1.3699. The first downside price target is around 1.3457. We will keep you informed should anything change, or should we see a confirmation/invalidation of the above.
GBP/USD
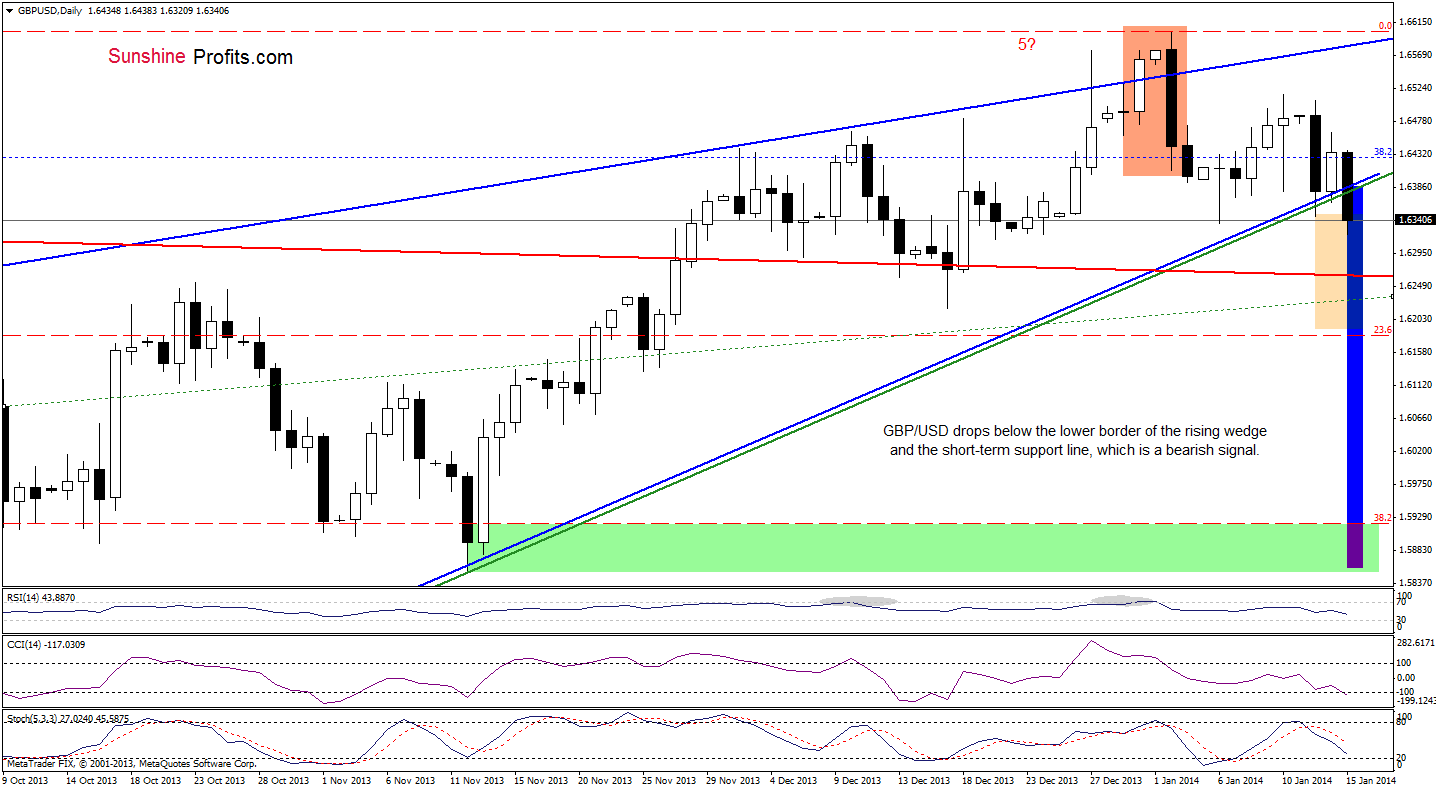
Looking at the above chart, we see that recent days have formed a consolidation. As you see on the daily chart, the pair dropped below Monday’s low (we also saw a drop below the lower border of the rising wedge), which will likely trigger further deterioration and the price target for the pattern will be slightly above the 23.6% Fibonacci retracement level based on the entire Jul.-Jan. rally (marked with a lighter rectangle). This bearish scenario is quite likely – especially when we factor in sell signals generated by the indicators and a possible rising 5-wave sequence (in our opinion wave 5 may be already over).
Please note that the breakdown below the lower border of the rising wedge will likely trigger a bigger corrective move (and we will likely see a breakdown below the red long-term support line). If that is the case, the price target for this formation will be slightly below the 38.2% Fibonacci retracement level based on the entire Jul.-Jan. rally (marked in dark blue).
Very short-term outlook: bearish
Short-term outlook: mixed with bearish bias
MT outlook: bullish
LT outlook: mixed
Trading position (short-term): we suggest opening short positions. The stop-loss level for this position is at 1.6515. The first downside price target is around 1.6190. We will keep you informed should anything change, or should we see a confirmation/invalidation of the above.
USD/JPY
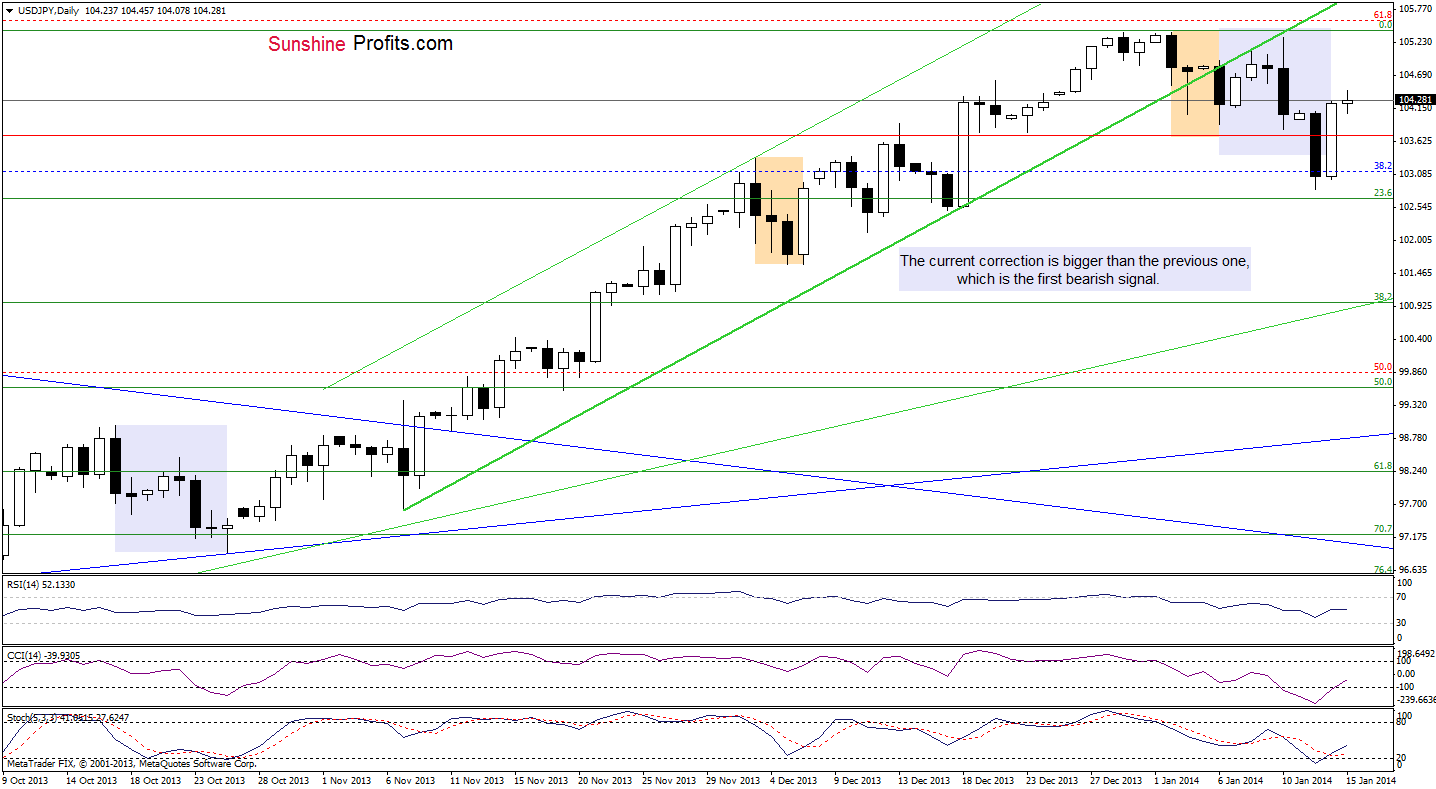
Looking at the above chart, we see that USD/JPY extended yesterday’s strong rally and invalidated the breakdown below intra-day lows, which is a bullish signal. In this case, we could see further improvement and the first price target will be Friday’s high. As you see on the above chart, the CCI and Stochastic Oscillator generated buy signals, which supports the above assumption.
Nevertheless, we should keep in mind that although the pair increased, it still remains below the previously-broken short-term rising line (the breakdown is confirmed), which will likely stop further improvement (similarly to what we saw in the previous week). On top of that, slightly below this line is the 61.8% Fibonacci retracement level, which supports the sellers. Connecting the dots, even if we see a continuation of a rally, the space for further growths seems limited.
Very short-term outlook: mixed
Short-term outlook: mixed
MT outlook: bullish
LT outlook: bearish
Trading position (short-term): we do not suggest opening any trading positions at the moment. We will keep you informed should anything change, or should we see a confirmation/invalidation of the above.
USD/CAD
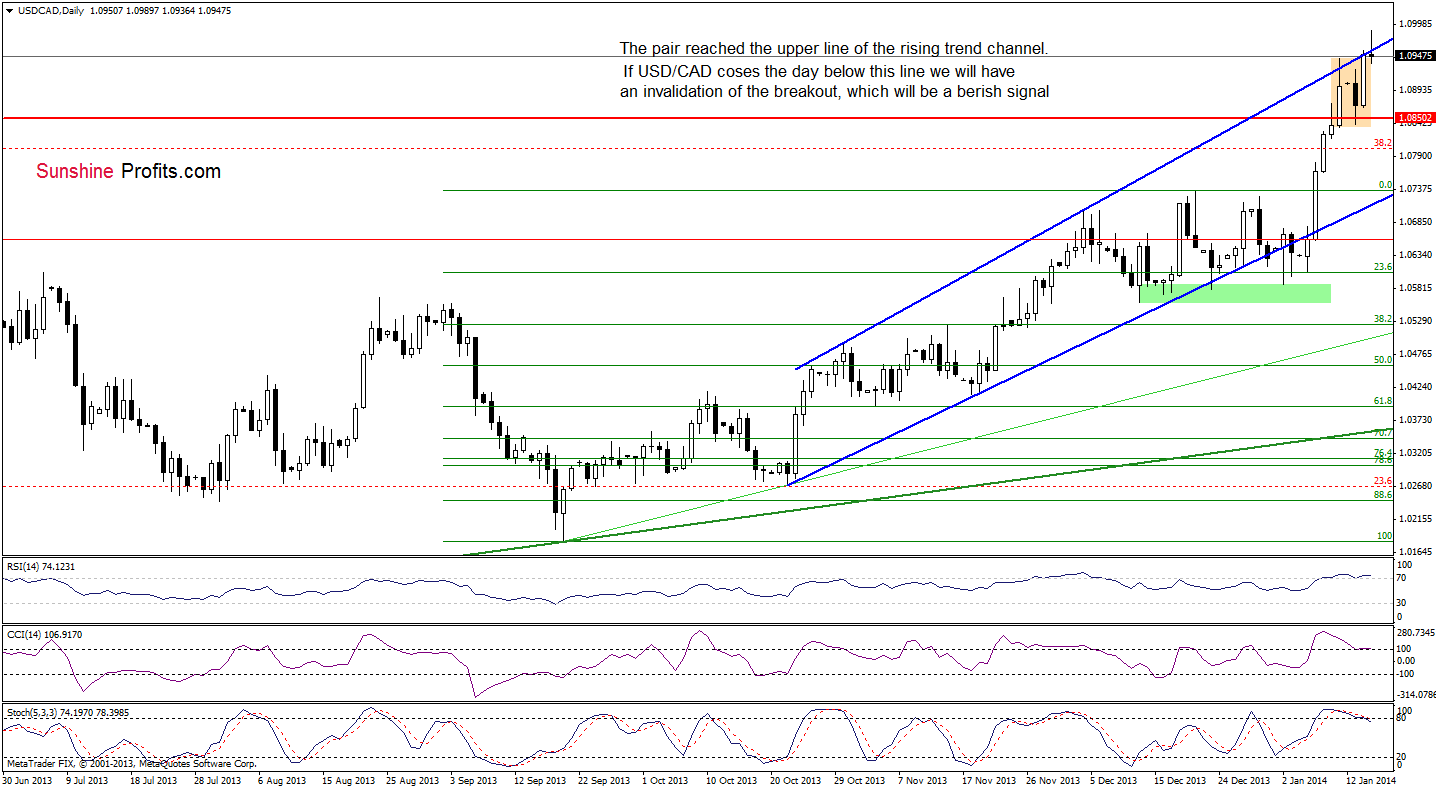
Looking at the above chart, we see that USD/CAD extended gains once again and hit a fresh four-year high. Despite this improvement, the pair slipped slightly below the upper line of the rising trend channel, which is not a positive signal. Therefore, if USD/CAD closes the day below this line, we will have an invalidation of the breakout, which will be a bearish signal. Please note that such price action in combination with the position of the indicators will likely encourage the sellers to act and stop further improvement.
As a reminder, the RSI and two other indicators are overbought and there are negative divergences between the CCI, Stochastic Oscillator and the exchange rate, which is a bearish signal. Taking these facts into account, we may see a reversal of the current rally in the coming day (or days).
Very short-term outlook: mixed
Short-term outlook: bullish
MT outlook: bullish
LT outlook: bearish
Trading position (short-term): we do not suggest opening any trading positions at the moment. We will keep you informed should anything change, or should we see a confirmation/invalidation of the above.
USD/CHF
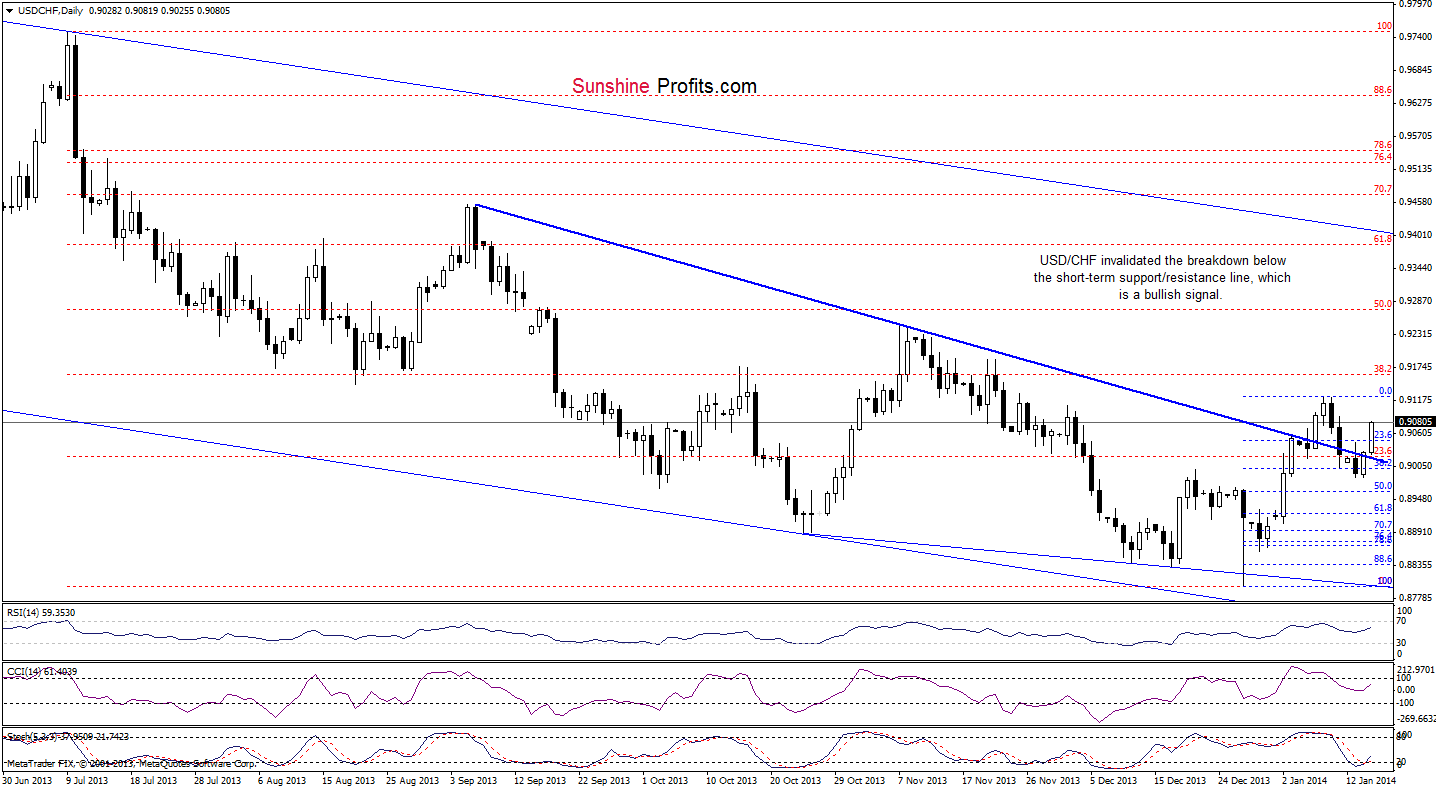
Quoting our last Forex Trading Alert:
(…) the pair reached the 38.2% Fibonacci retracement level based on the recent rally. Taking this support into account, we may see an upward corrective move, which will be more likely if the pair invalidates the breakdown below the short-term support/resistance line. In this case, the upside target will be Wednesday’s high.
Looking at the above chart, we see that the pair rebounded after reaching the 38.2% Fibonacci retracement. From this perspective, the recent correction is still shallow and supports the bullish case. As you see on the above chart, with this upswing USD/CHF invalidated the breakdown below the short-term declining support/resistance line. As a reminder, an invalidation of the breakdown is a bullish sign. Therefore, further improvement should not surprise us and, as mentioned earlier, the first upside target will be Wednesday’s high. However, taking into account the above, it seems that we may see an upward move to the 38.2% Fibonacci retracement level.
Very short-term outlook: bullish
Short-term outlook: bearish
MT outlook: bearish
LT outlook: bearish
Trading position (short-term): we suggest opening long positions. The stop-loss level for this position is at 0.8985. The upside price target is around 0.9160. We will keep you informed should anything change, or should we see a confirmation/invalidation of the above.
AUD/USD
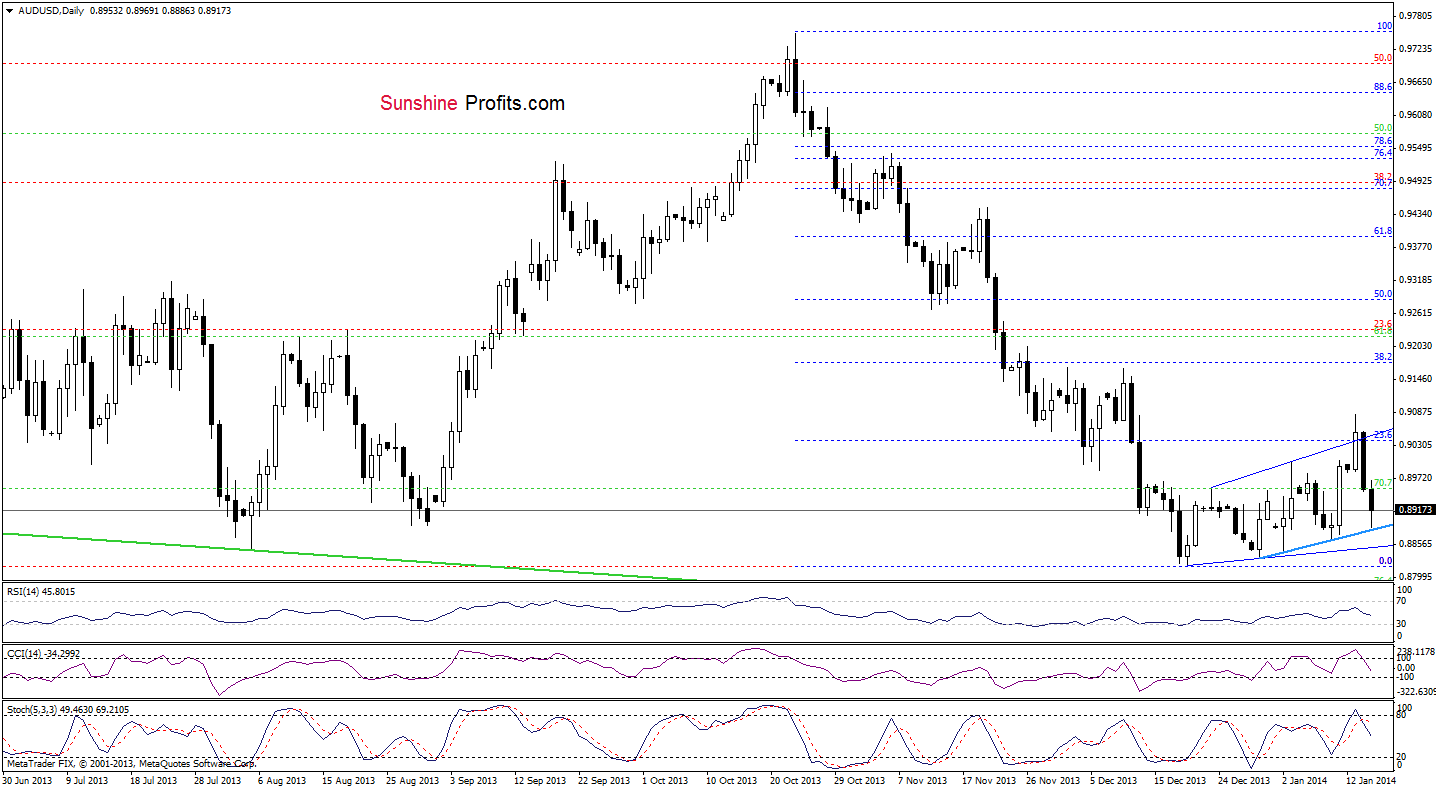
Looking at the above chart, we see that AUD/USD extended its decline after the breakdown below the 23.6% Fibonacci retracement level. Similarly to what we wrote earlier today, an invalidation of the breakout is a bearish signal. Therefore, from this perspective, it seems that we will see further deterioration – especially when we take into account the fact that the pair has corrected less than 30% of the entire decline and that sell signals have been generated by the CCI and Stochastic Oscillator.
However, we should keep in mind that the pair reached the very short-term support line with the recent downswing, therefore, we may see a pause or an upward correction from here. Please note that if the pair breaks below this support line, we will likely see further deterioration and the first downside target will be the December low.
Very short-term outlook: bearish
Short-term outlook: bearish
MT outlook: mixed
LT outlook: bearish
Trading position (short-term): we do not suggest opening any trading positions at the moment. We will keep you informed should anything change, or should we see a confirmation/invalidation of the above.
Thank you.
Nadia Simmons
Forex & Oil Trading Strategist
Oil Investment Updates
Oil Trading Alerts
