
Earlier today, the U.S. dollar improved as the ADP nonfarm payrolls report showed that the U.S. private sector added the largest number of jobs since November 2012 last month. Additionally, demand for the U.S. currency increased ahead of the minutes of the December Federal Reserve's policy meeting. What impact did it have on major currency pairs? If you want to know our take on this question, we invite you to read our today's Forex Trading Alert.
Forex Trading Positions - Summary:
EUR/USD
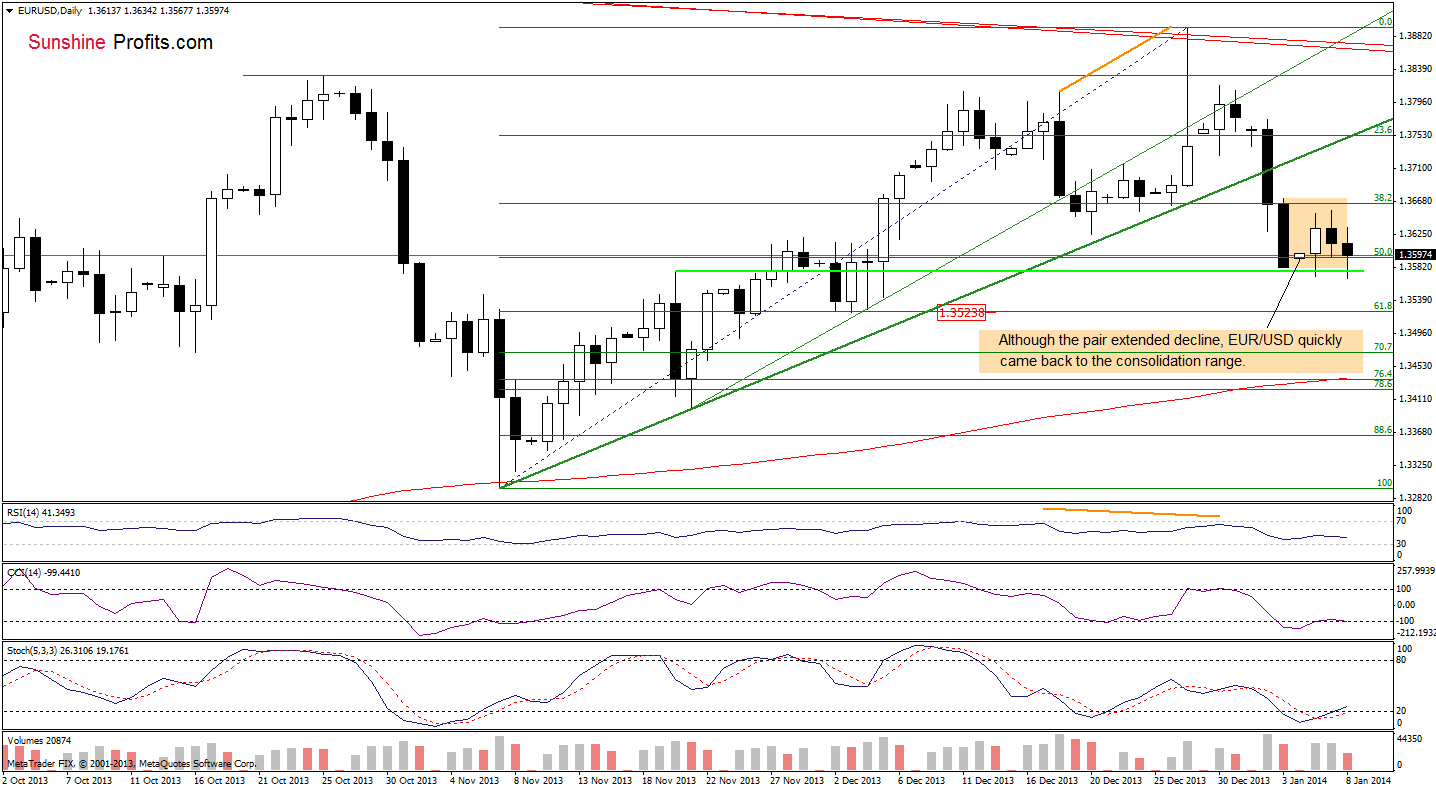
On the above chart, we see that although we saw a small breakdown below the lower border of a consolidation range earlier today, it was quickly invalidated, which is a positive sign. Additionally, the CCI and Stochastic Oscillator generated buy signals. From this perspective, if the buyers win, we will likely see an upswing to the previously-broken short-term rising resistance line. However, if the pair closes the day below yesterday’s low, we will likely see further deterioration and, in this case, the first downside target will be around 1.3524 where the 61.8% Fibonacci retracement level intersects with the Dec. 3 low.
Very short-term outlook: mixed
Short-term outlook: mixed with bearish bias
MT outlook: mixed
LT outlook: bearish
Trading position (short-term): we do not suggest opening any trading positions at the moment. We will keep you informed should anything change, or should we see a confirmation/invalidation of the above.
GBP/USD
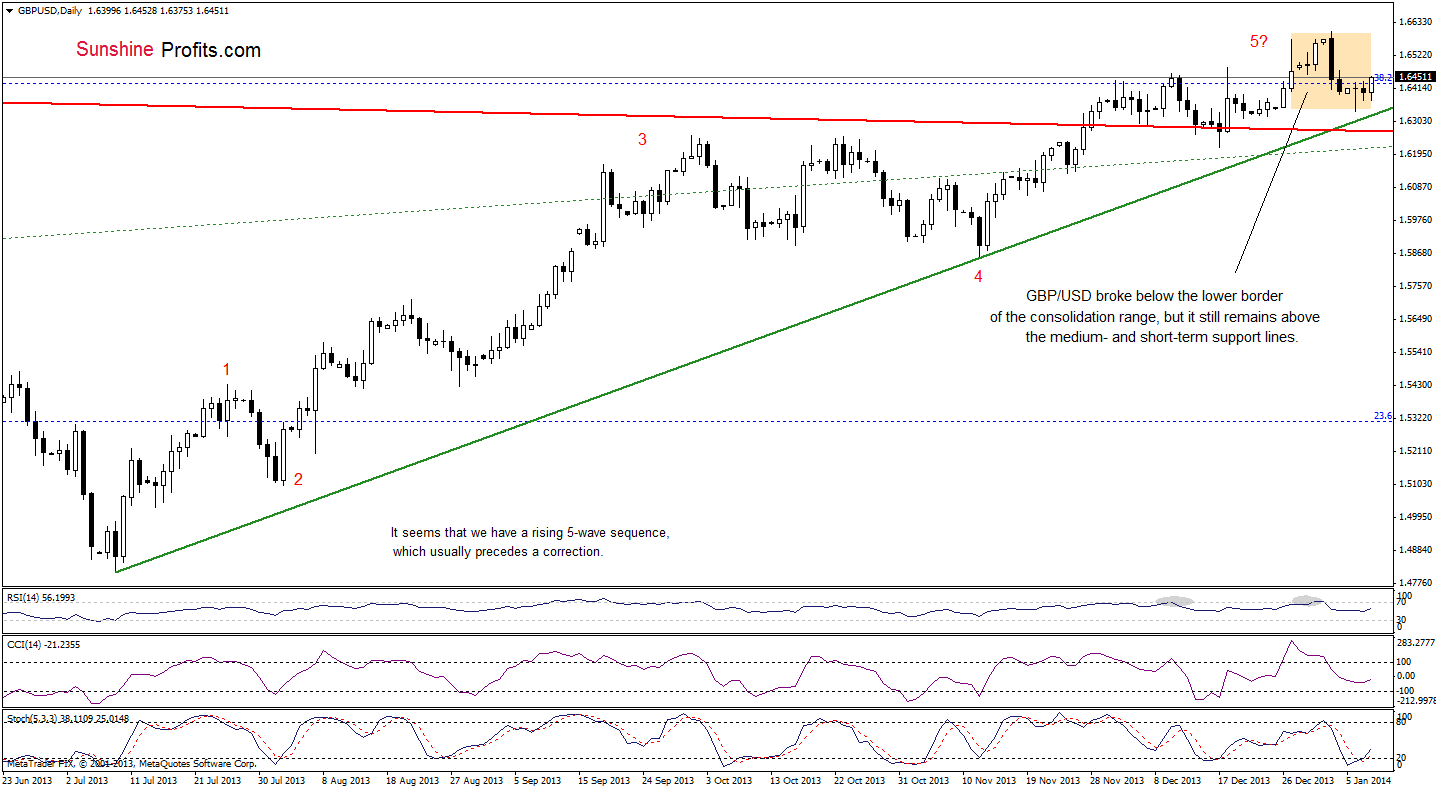
On the above chart, we see that GBP/USD has gone up, but overall, the situation hasn’t changed much from this perspective. The pair still remains above both support lines (the green short-term rising support line and the red long-term support line), which keep declines in check. This is a positive sign for the pound and further improvement should not surprise us.
Very short-term outlook: mixed
Short-term outlook: bullish
MT outlook: bullish
LT outlook: mixed
Trading position (short-term): we do not suggest opening any trading positions at the moment. If the pound drops below the red long-term support line, we will consider opening speculative short positions. We will keep you informed should anything change, or should we see a confirmation/invalidation of the above.
USD/JPY
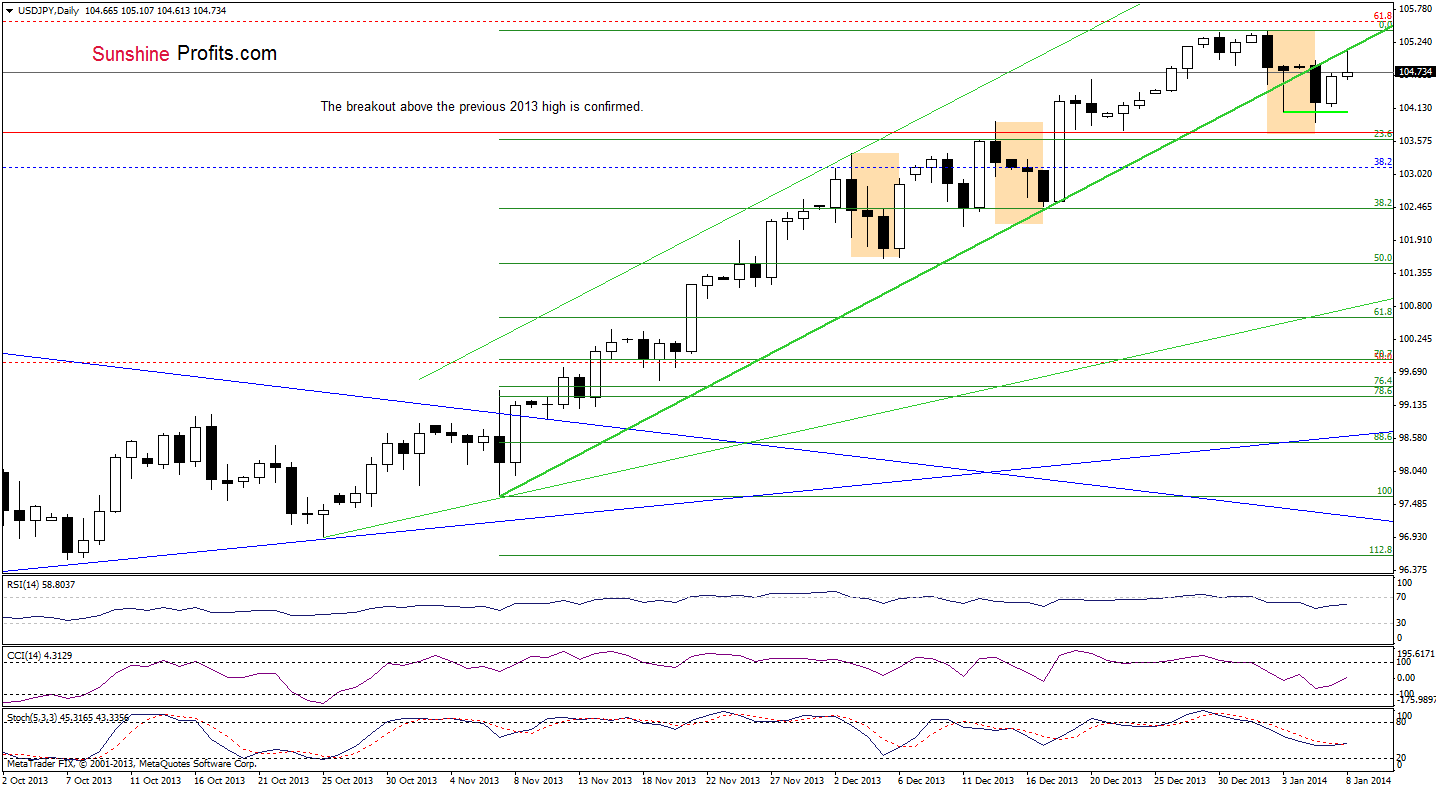
Looking at the above chart, we see that USD/JPY extended its gains and reached the previously-broken short-term rising line. If the pair comes back above this line, we will likely see further improvement and an upward move to at least the annual high. However, if the buyers fail, the current increase might be nothing more than a verification of the breakdown. In this case, such price action would likely trigger another corrective move and the first downside target would be Monday’s low.
Please note that even if the pair drops to 103.67, the current correction will be similar to the previous ones and the uptrend will not be threatened.
Very short-term outlook: mixed
Short-term outlook: bullish
MT outlook: bullish
LT outlook: bearish
Trading position (short-term): we do not suggest opening any trading positions at the moment. We will keep you informed should anything change, or should we see a confirmation/invalidation of the above.
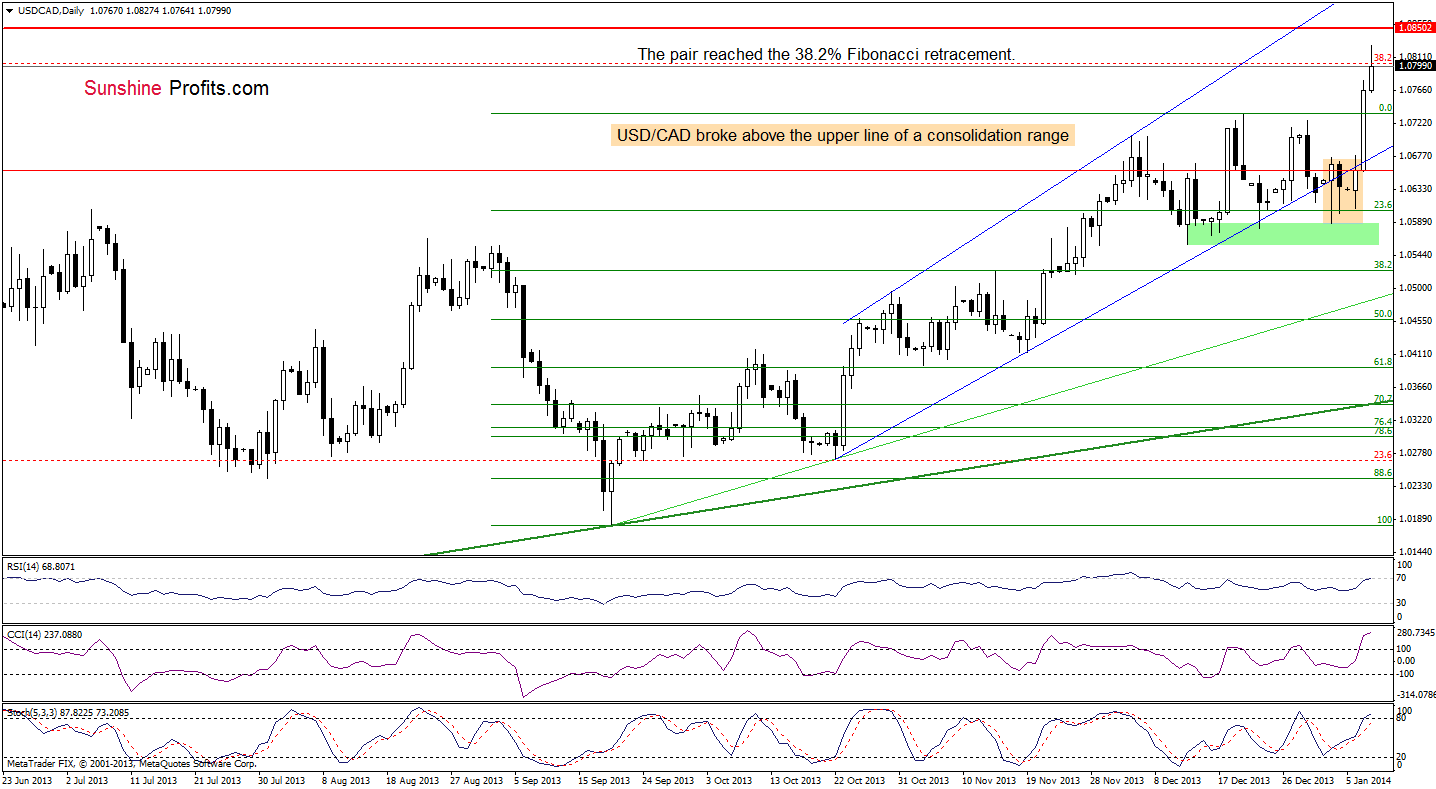
USD/CAD
Quoting our previous Forex Trading Alert:
(…) USD/CAD extended its gains and not only broke above the Dec. 30 high, but also hit a new annual high. From this perspective, the situation is bullish and if the buyers do not fail, the next upside target will be the 38.2% Fibonacci retracement level (around 1.0802).
On the above chart, we see that the pair continued its rally today and reached the 38.2% Fibonacci retracement level, which is a positive signal. Nevertheless, USD/CAD declined after that and remains below this resistance at the moment. At this point, the position of the indicators is worth mentioning. The RSI almost reached the level of 70 and both other indicators are overbought, which prescribes caution. Additionally, the next resistance level created by the November 2009 and May 2010 highs is slightly above the 38.2% retracement, which may encourage the sellers to act and trigger a correction in the near future.
Very short-term outlook: bullish
Short-term outlook: bullish
MT outlook: bullish
LT outlook: bearish
Trading position (short-term): we do not suggest opening any trading positions at the moment. We will keep you informed should anything change, or should we see a confirmation/invalidation of the above.
USD/CHF
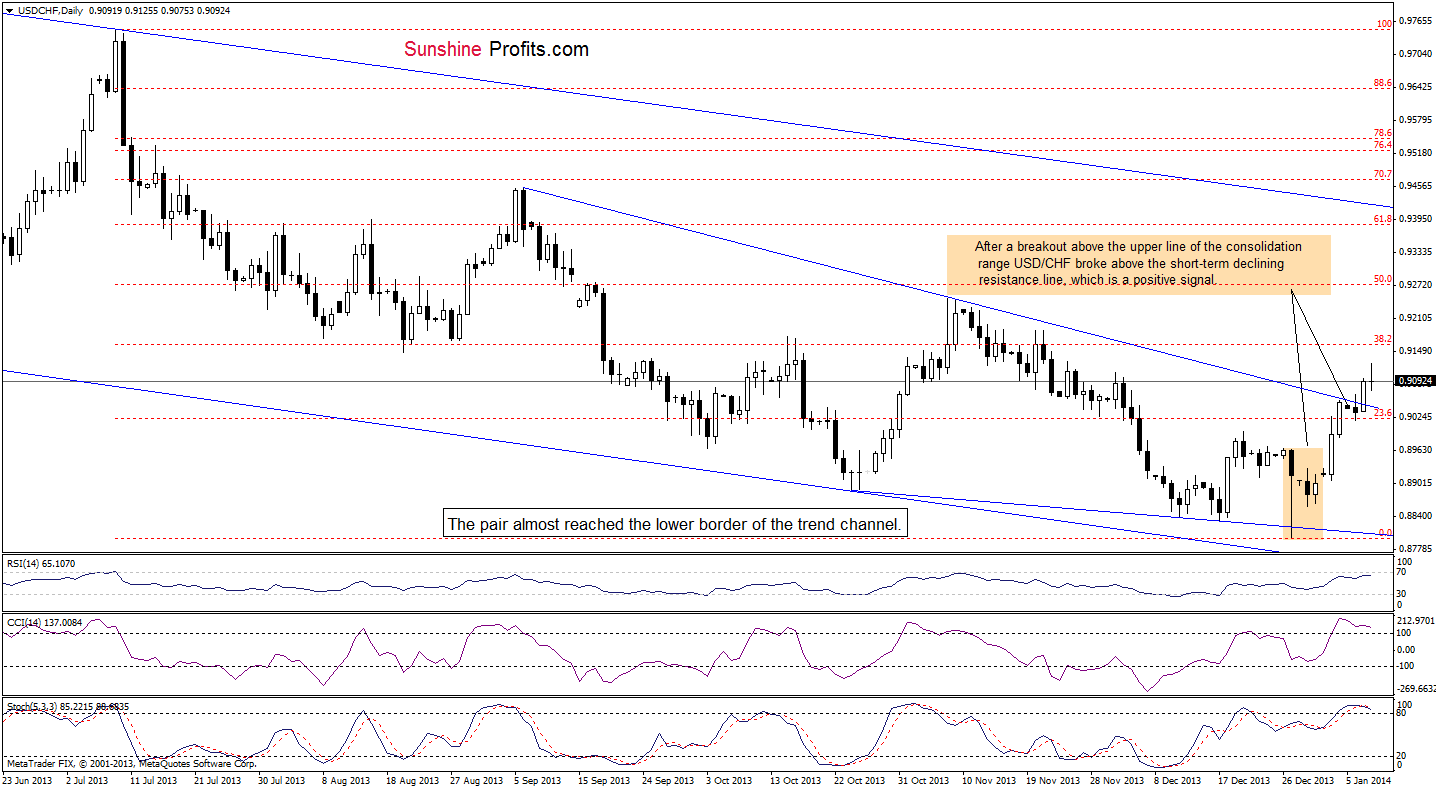
Looking at the above chart, we see that the situation has improved once again as USD/CHF extended its gains above the short-term declining resistance line based on the September and November highs. As we wrote yesterday, the nearest upside target for the buyers is the 38.2% Fibonacci retracement level based on the Jul. - Dec. decline.
Nevertheless, we should keep in mind that the RSI approached the level of 70 and both other indicators are overbought (additionally the Stochastic Oscillator generated a sell signal). Therefore, a pause or a pullback in the near future should not surprise us.
Very short-term outlook: mixed with bullish bias
Short-term outlook: bearish
MT outlook: bearish
LT outlook: bearish
Trading position (short-term): we do not suggest opening any trading positions at the moment. We will keep you informed should anything change, or should we see a confirmation/invalidation of the above.
Today’s Forex Trading Alert marks the end of the trial period for this service and also marks the start of the pre-sale week. Because of that, I would like to summarize the recent days. In the period since the first alert was published (Dec. 30) we haven’t suggested opening any speculative positions, as the situation seemed to be too uncertain to go short or long on the short-term basis. Nevertheless, from today’s point of view, it seems that interesting breakthroughs are just around the corner (for instance note the unconfirmed breakout on the USD/CHF chart).
The pre-order period starts today and will last for the next 7 days. During this time, you will still be receiving Forex Trading Alerts for free, just as you have so far, but we have something extra for those of you who have decided they want to subscribe to the paid service. If you subscribe within the next 7 days, before the paid service is launched, you’ll save 20% on your first order.
Compared with the regular price for Forex Trading Alerts, you will save $7.99 on the monthly subscription, $21.99 on the quarterly subscription, and $79.99 on the yearly subscription. Additionally, we will extend your subscription period by one week so that the pre-order time doesn’t affect your subscription. It’s 20% off for early birds:
Forex Trading Alerts – Pre-Sale, 20% Off for Early Birds
Since we’re starting to take pre-orders, I would like to thank you for the time you have spent reading my thoughts on the market. Once the paid service has kicked off, we will occasionally post bits and pieces from the alerts for free, but most of this service will be reserved for our subscribers. Stay tuned for more info on the market.
Finishing today’s alert, I would like to thank you for the time you have spent reading my analysis of the currency market. Once the paid service has kicked off, we will post bits and pieces from the alerts for free from time to time, but most of this service will be reserved for our subscribers.
Thank you.
Nadia Simmons
Forex & Oil Trading Strategist
Oil Investment Updates
Oil Trading Alerts
