
Earlier today, the greenback moved lower against major currencies as data showed that the U.S. economy added only 74,000 jobs in December (compared to expectations for a 196,000 increase), while the U.S. private sector added only 87,000 jobs last month, disappointing expectations for a 195,000 rise. What impact did it have on major currency pairs? If you want to know our take on this question, we invite you to read our today's Forex Trading Alert.
Forex Trading Positions - Summary:
EUR/USD
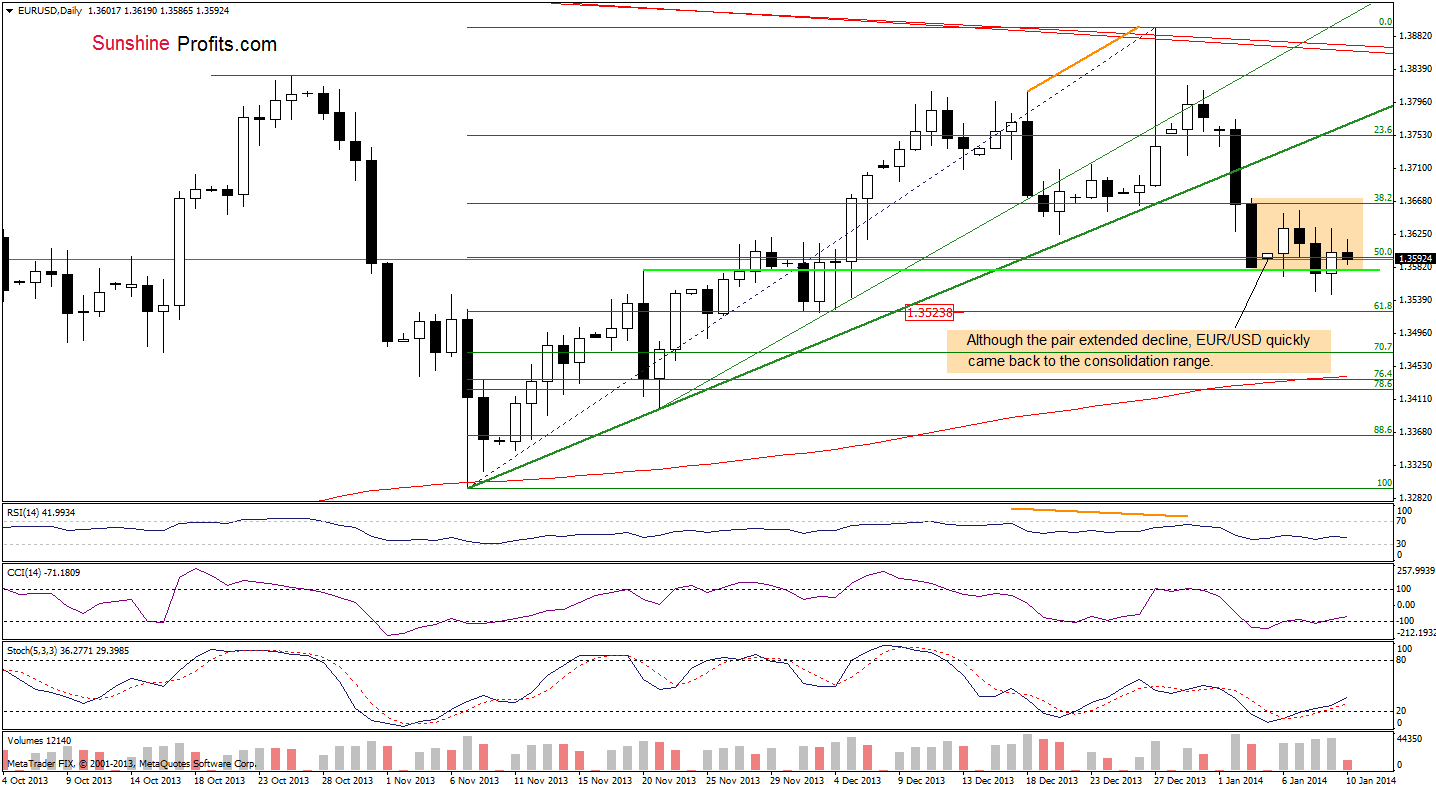
On the above chart, we see that the situation hasn’t changed much as EUR/USD remains in a consolidation range. Therefore, what we wrote in our last Forex Trading Alert remains up-to-date also today.
(…) the main reason, which likely triggered such volatility is the medium-term rising support line (marked with orange) on the weekly chart (…) although EUR/USD broke below the medium-term support line, the breakdown was quickly invalidated, which shows the importance of this line. If it is broken, the current decline will likely accelerate and the first downside target will be the 38.2% Fibonacci retracement level based on the entire March-December rally (around 1.3457).
(…) buy signals generated by the CCI and Stochastic Oscillator remain in place. Additionally, the RSI remains at its lowest level since Nov. 20. Back then, such a low reading of the indicator had a positive impact on the euro, which improved against the U.S. dollar.
Very short-term outlook: mixed
Short-term outlook: mixed with bearish bias
MT outlook: mixed
LT outlook: bearish
Trading position (short-term): we do not suggest opening any trading positions at the moment. We will keep you informed should anything change, or should we see a confirmation/invalidation of the above.
GBP/USD
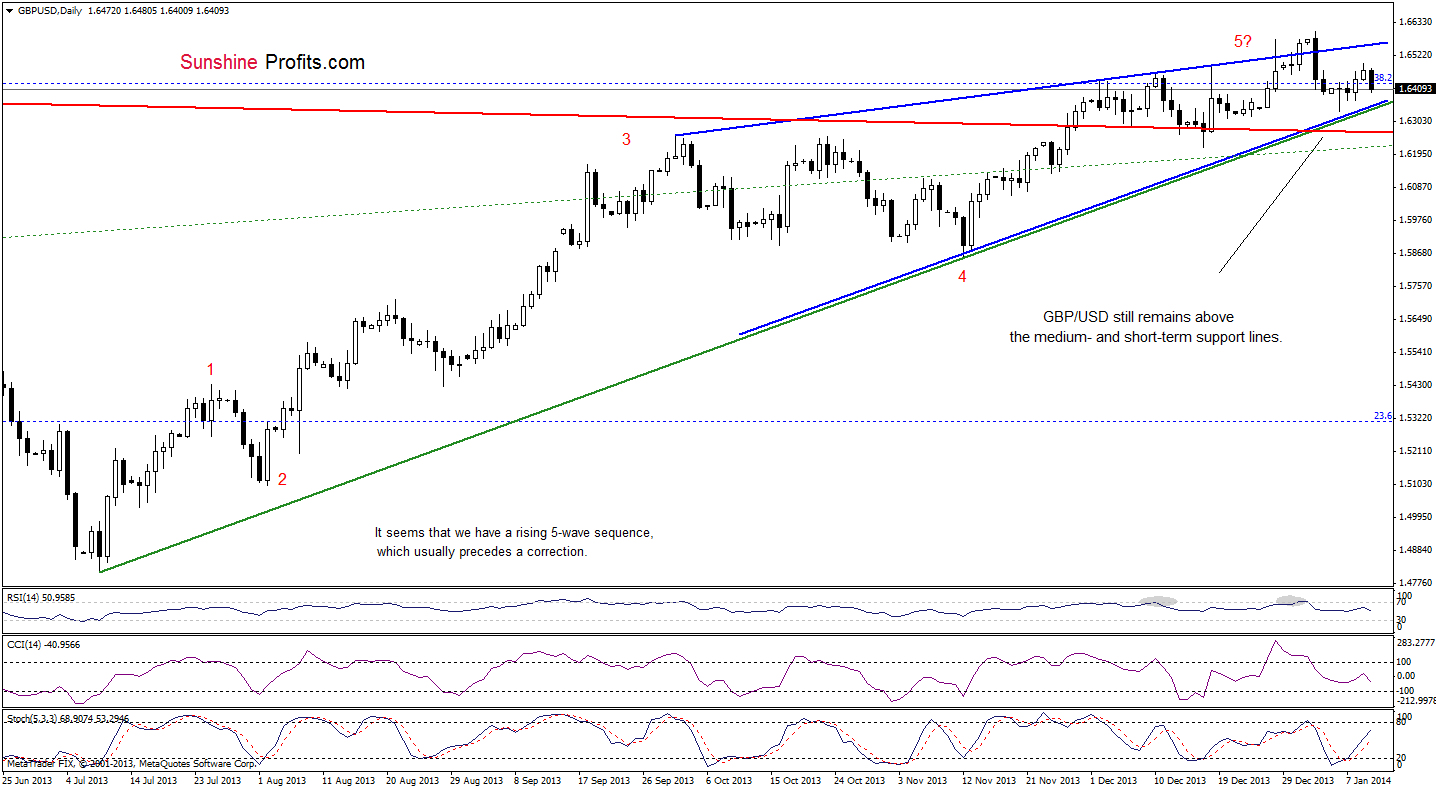
On the above chart, we see that GBP/USD reversed course and declined earlier today. Despite this drop, the situation hasn’t changed much from this perspective and what we wrote in our previous Forex Trading Alert remains up-to-date.
(…) the pair still remains above both support lines (the green short-term rising support line and the red long-term support line), which keep declines in check.
Please note that the pair remains in a rising wedge (marked with blue) and it seems that the breakout above the upper border of this formation (or the breakdown below the lower border) will trigger a bigger upside (or downside) move.
Very short-term outlook: mixed
Short-term outlook: bullish
MT outlook: bullish
LT outlook: mixed
Trading position (short-term): we do not suggest opening any trading positions at the moment. We will keep you informed should anything change, or should we see a confirmation/invalidation of the above.
USD/JPY
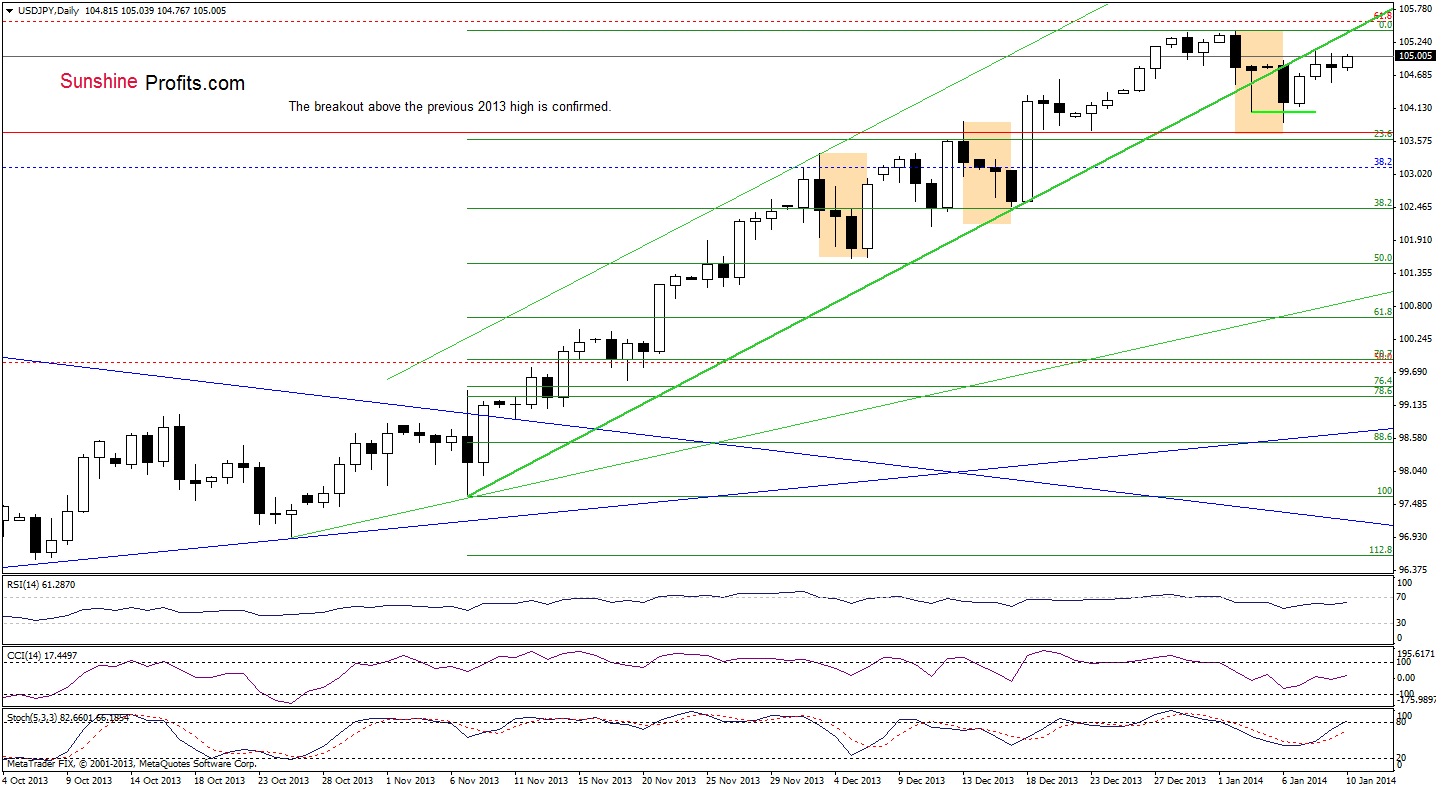
On the above chart, we see that the situation hasn’t changed much. Although USD/JPY increased earlier today, it still remains below the previously-broken short-term rising line (the breakdown is confirmed). From this perspective, it seems that as long as the pair remains below this resistance, the space for further growth is limited and further deterioration in the coming day (or days) should not surprise us.
Nevertheless, we should keep in mind that even if the pair drops to 103.67, the current correction will be similar to the previous ones and the uptrend will not be threatened.
Very short-term outlook: mixed with bearish bias
Short-term outlook: bullish
MT outlook: bullish
LT outlook: bearish
Trading position (short-term): we do not suggest opening any trading positions at the moment. We will keep you informed should anything change, or should we see a confirmation/invalidation of the above.
USD/CAD
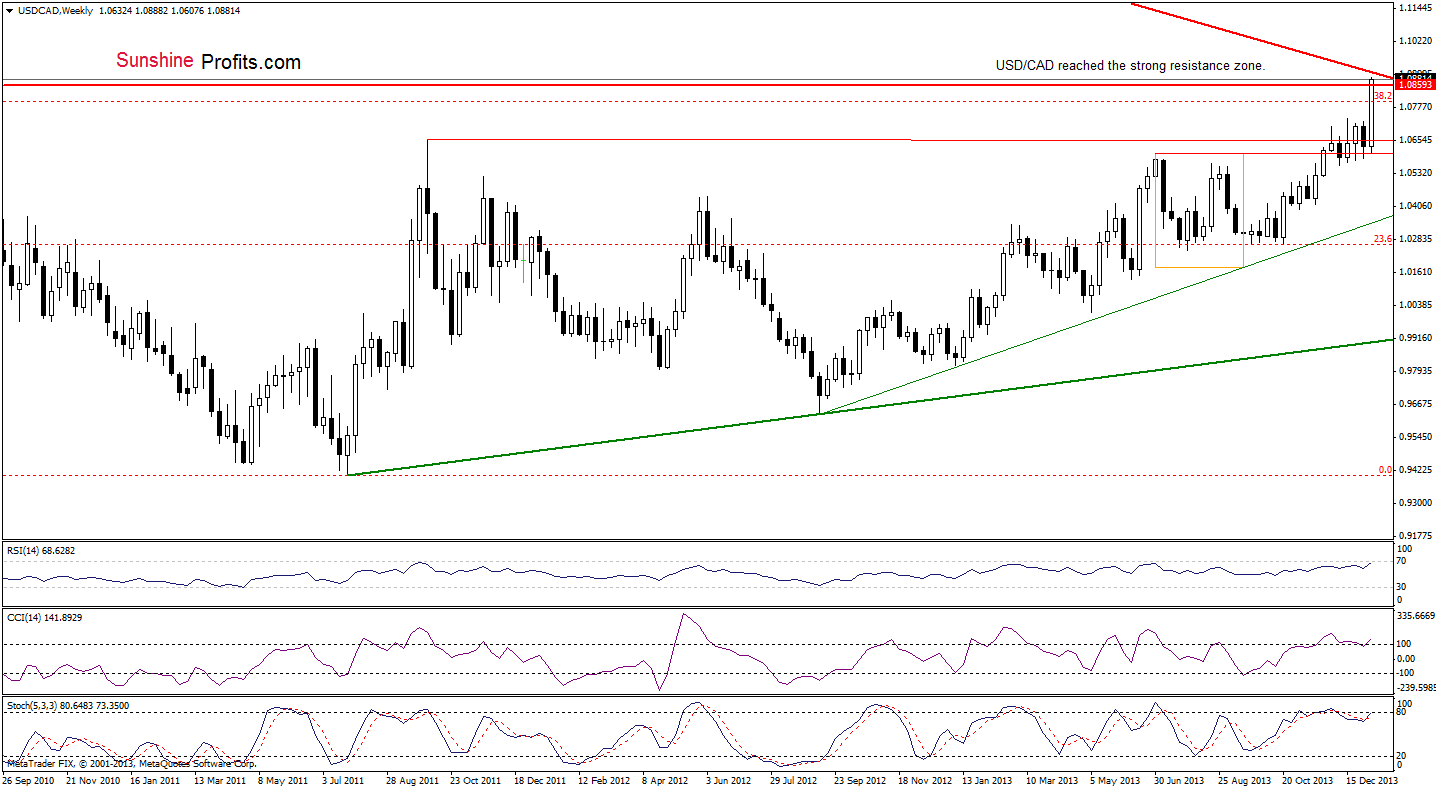
The key chart for today is the weekly one. As you see, USD/CAD extended its rally and reached the long-term declining resistance line earlier today. This strong resistance in combination with the position of the RSI (which almost reached the level of 70) will likely encourage sellers to act and stop further improvement. However, if it is broken, we will likely see further improvement and the upside target will be around 1.1100-1.1122 where two August highs are.
Very short-term outlook: bullish
Short-term outlook: bullish
MT outlook: bullish
LT outlook: bearish
Trading position (short-term): we do not suggest opening any trading positions at the moment. We will keep you informed should anything change, or should we see a confirmation/invalidation of the above.
USD/CHF
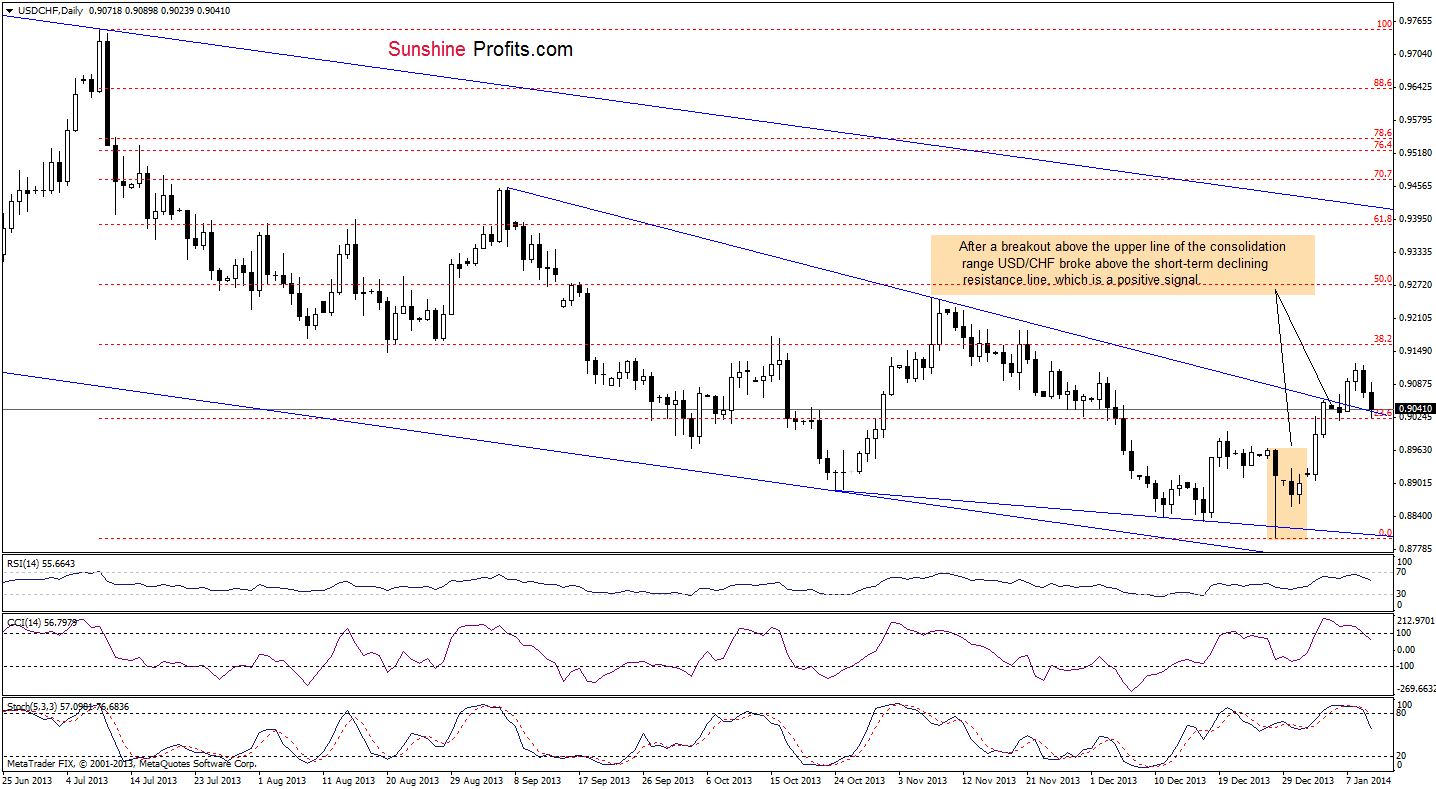
Quoting our previous Forex Trading Alert:
(…) the RSI still remains slightly below the level of 70 and both other indicators are overbought. A sell signal generated by the Stochastic Oscillator remains in place. Additionally, we can notice a negative divergence between the CCI and the exchange rate, which is a negative sign. Taking all the above into account, further deterioration (or a bigger pause) in the near future should not surprise us.
On the above chart, we see that we had such price action earlier today. USD/CHF dropped to the previously-broken short-term declining resistance line based on the September and November highs. If this support encourages the buyers to act, we will likely see an upward move and the upside target will be Wednesday’s high. However, if it’s broken, we will see further deterioration (at least) to the upper line of the recent consolidation range (around 0.8965).
Very short-term outlook: mixed
Short-term outlook: bearish
MT outlook: bearish
LT outlook: bearish
Trading position (short-term): we do not suggest opening any trading positions at the moment. We will keep you informed should anything change, or should we see a confirmation/invalidation of the above.
Thank you.
Nadia Simmons
Forex & Oil Trading Strategist
Oil Investment Updates
Oil Trading Alerts
