

Forex Trading Alert originally sent to subscribers on July 19, 2016, 7:40 AM.
In our opinion the following forex trading positions are justified - summary:
- EUR/USD: short (a stop-loss at 1.1236; initial downside target at 1.0708)
- GBP/USD: short (a stop-loss at 1.3579; initial downside target at 1.2519)
- USD/JPY: none
- USD/CAD: none
- USD/CHF: none
- AUD/USD: none
The USD Index soared sharply after the Brexit vote, but it hasn’t done much since that time. However, since it seems that the consolidation is about to be over, it’s critical to estimate the possible impact on the key currency pairs.
Let’s take a closer look at the charts (charts courtesy of http://stockcharts.com).
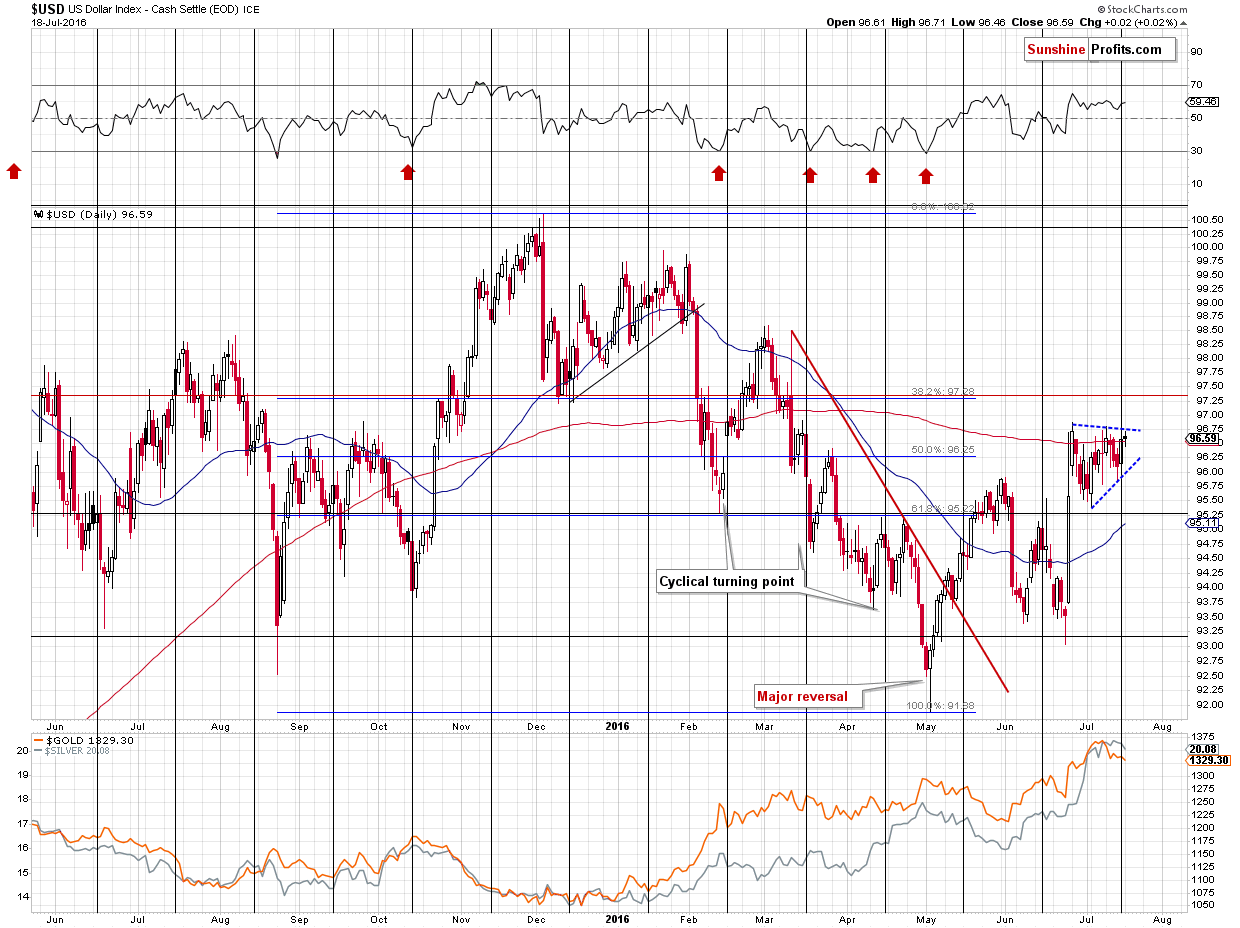
The USD Index is currently very close to the upper border of the consolidation triangle pattern. Most triangles tend to be followed by the continuation of the preceding move, especially if the preceding move was to the upside and this is exactly what we’ve seen in the most recent past.
The mentioned border is at about 96.75 and at the moment of writing these words the USD Index is trading at 96.71 – very close to it. The USD has been consolidating for about 3 weeks – definitely enough to cool down the previous – post-Brexit-vote emotions, so the consolidation can end any day now – perhaps even later today as only a little additional move higher is necessary.
The cyclical turning point was last Friday and the USD Index indeed turned around and rallied on this day, thus increasing the odds for the rally’s continuation.
The implications for the USD Index are bullish as the move that follows a breakout tends to be similar (mostly in terms of price, but often also in terms of time) to the moves that preceded the consolidation. The move that preceded this consolidation was a rally from about 93 to about 96.5 – a 3.5 move. Starting an analogous move from the bottom of the triangle pattern (about 95.5 in early July) provides 99 as the next target.
Consequently, the implications of the current situation are bullish for the USD Index and they will be much more so in the case the breakout above the triangle pattern is confirmed.
Let’s keep in mind that 99 is only an initial target.
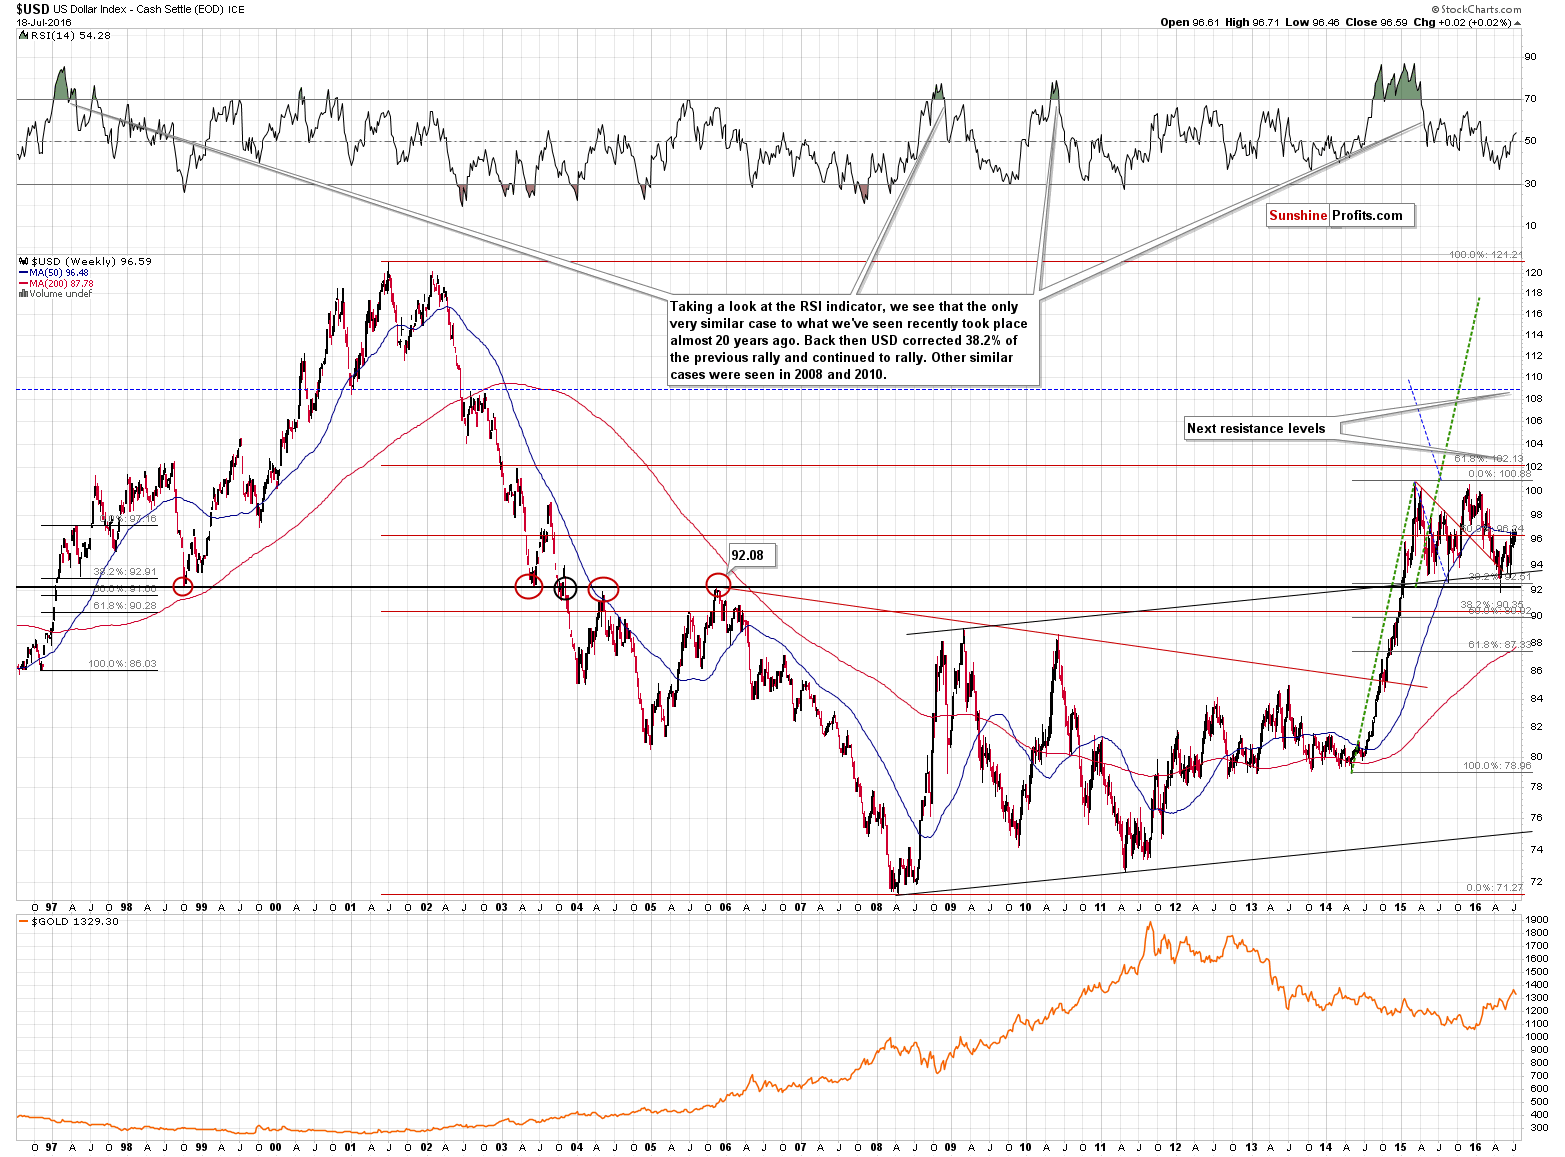
Based on the long-term chart, the next upside targets are about 110 and 118. The big consolidation pattern started in 2015 and it also seems that it took more than enough time for the investors’ emotions to cool down after the huge 2014-2015 rally. Once the 100 level is broken and the breakout is confirmed (quite close to the 99 level), another strong wave up is likely to be seen.
Summing up, once the short-term consolidation in the USD is over, we are likely to see another sizable upswing in the latter, which is very likely to correspond to a sizable decline in the EUR/USD and GBP/USD currency pairs and the impact is likely to be visible in all other currency pairs – positive in the case of the USD/JPY, USD/CHF and USD/CAD pairs and negative in the case of the AUD/USD pair.
Thank you.
Nadia Simmons
Forex & Oil Trading Strategist
Przemyslaw Radomski, CFA
Founder, Editor-in-chief, Gold & Silver Fund Manager
Gold & Silver Trading Alerts
Forex Trading Alerts
Oil Investment Updates
Oil Trading Alerts
