

Forex Trading Alert originally sent to subscribers on March 15, 2016, 9:57 AM.
Earlier today, the Bank of Japan kept interest rates unchanged at -0.10% which pushed the yen higher against the greenback. What does it mean for USD/JPY?
In our opinion the following forex trading positions are justified - summary:
- EUR/USD: short (stop-loss order at 1.1512; initial downside target at 1.0572)
- GBP/USD: none
- USD/JPY: none
- USD/CAD: none
- USD/CHF: none
- AUD/USD: none
EUR/USD
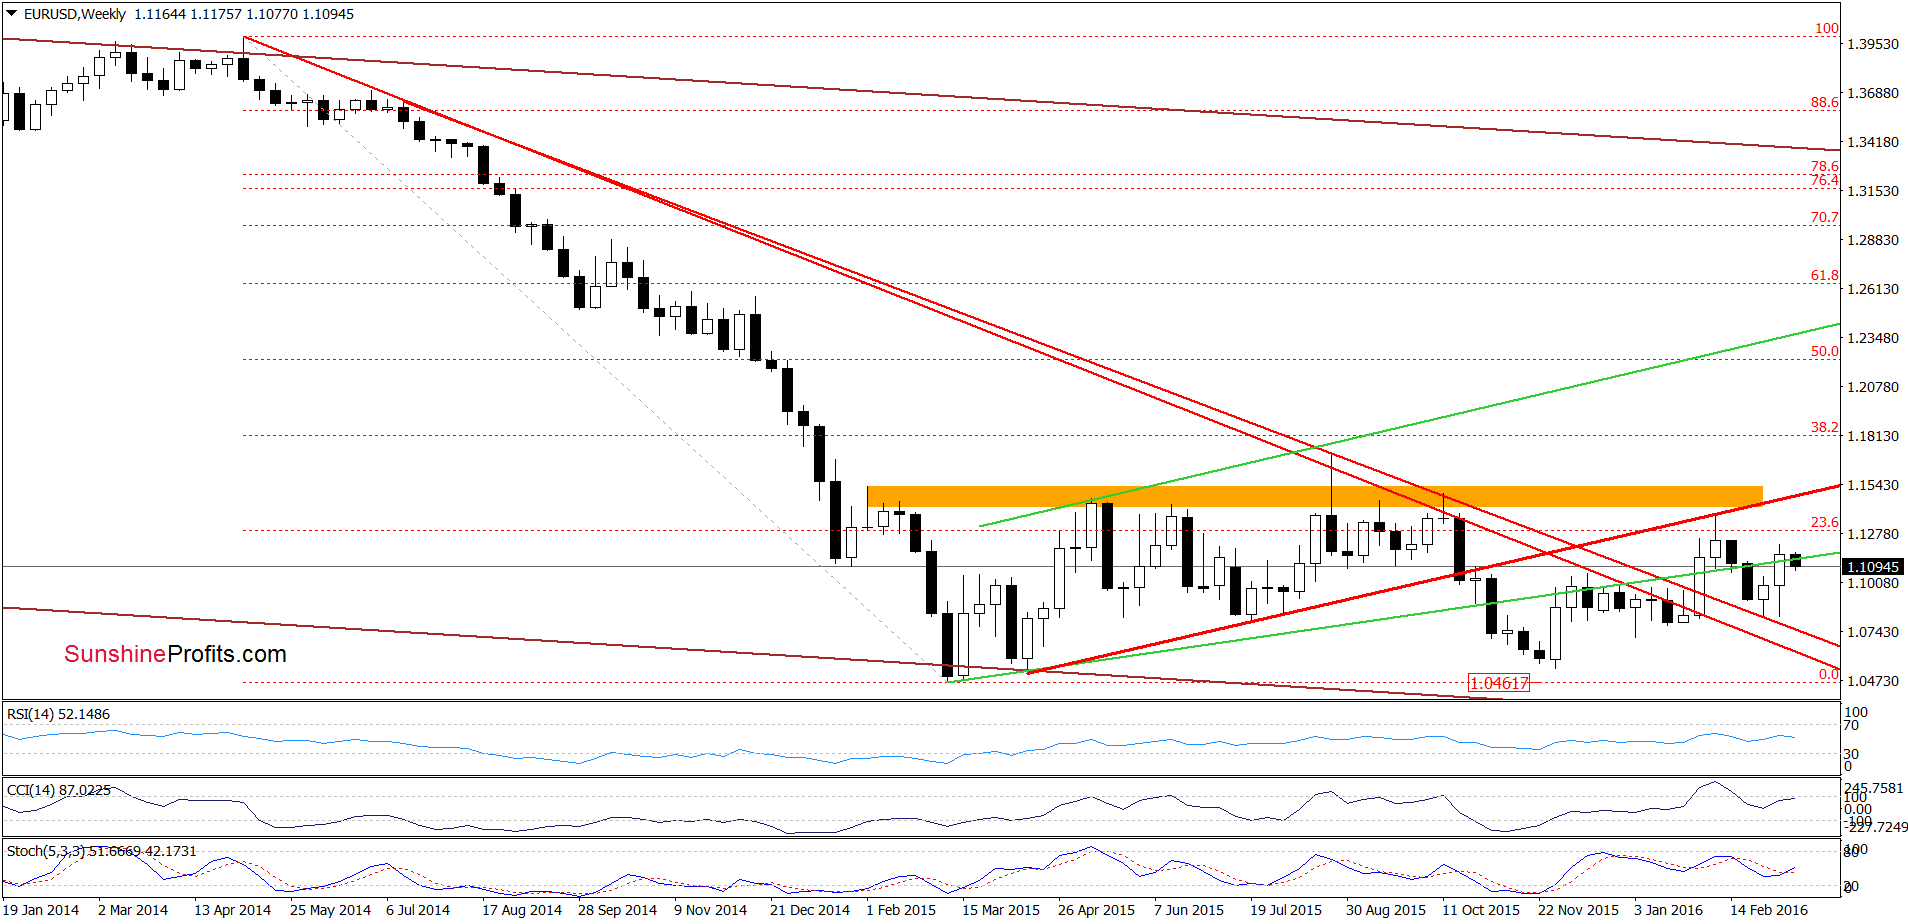
Looking at the weekly chart, we see that EUR/USD is still trading under the previously-broken green support/resistance line, which means that what we wrote yesterday is up-to-date:
(…) similar price action in mid-Feb triggered further deterioration and a test of the red declining line, which suggests that we may see similar drop in the coming days.
Are there any short-term factors that could encourage currency bulls to act? Let’s check.
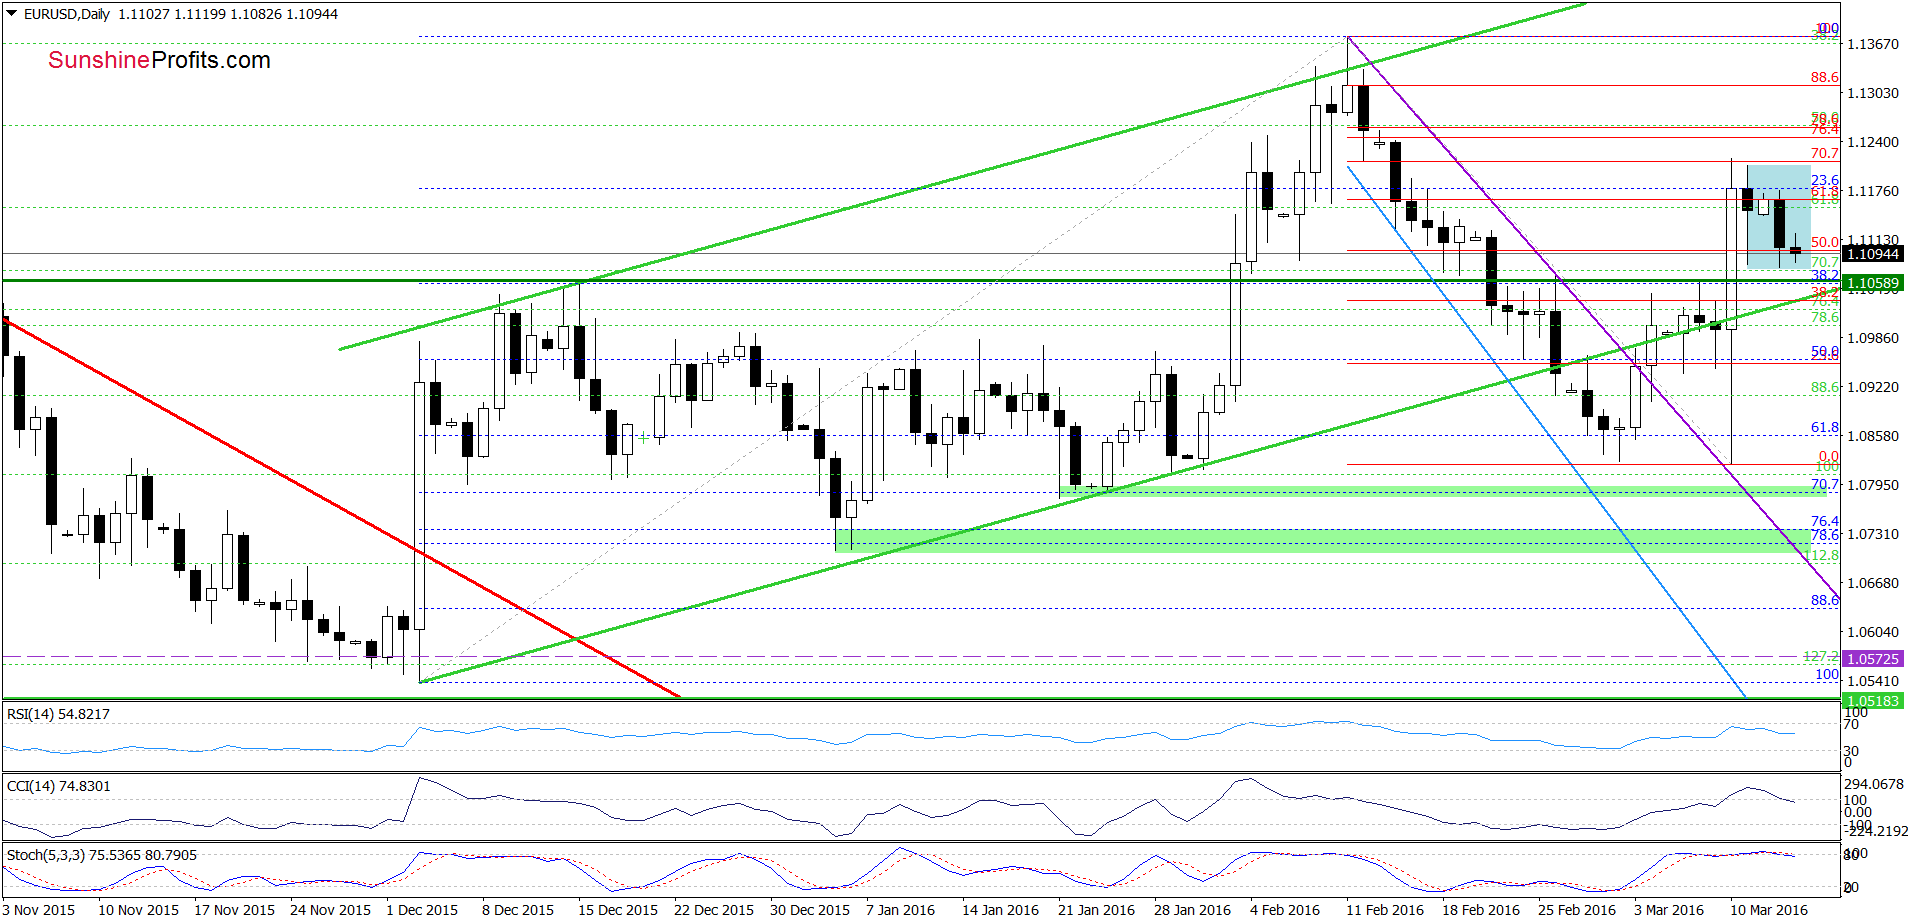
(…) the exchange rate remains in the blue consolidation, which suggests that a breakdown under the lower line of the formation (or a breakout above the upper line) will indicate the direction of another move. Nevertheless, taking into account the medium-term picture and the current position of daily indicators (the CCI and Stochastic Oscillator are very close to generating sell signals), we think that anther downswing is just a matter of time. Therefore, in our opinion, we’ll see a test of the green horizontal support line (based on the mid-Dec high) and the lower border of the green rising trend channel in the coming days.
Very short-term outlook: bearish
Short-term outlook: bearish
MT outlook: mixed with bearish bias
LT outlook: mixed
Trading position (short-term; our opinion): Short positions (with a stop-loss order at 1.1512 and the initial downside target at 1.0572) are justified from the risk/reward perspective. We will keep you informed should anything change, or should we see a confirmation/invalidation of the above.
USD/JPY
Last Wednesday, we wrote the following:
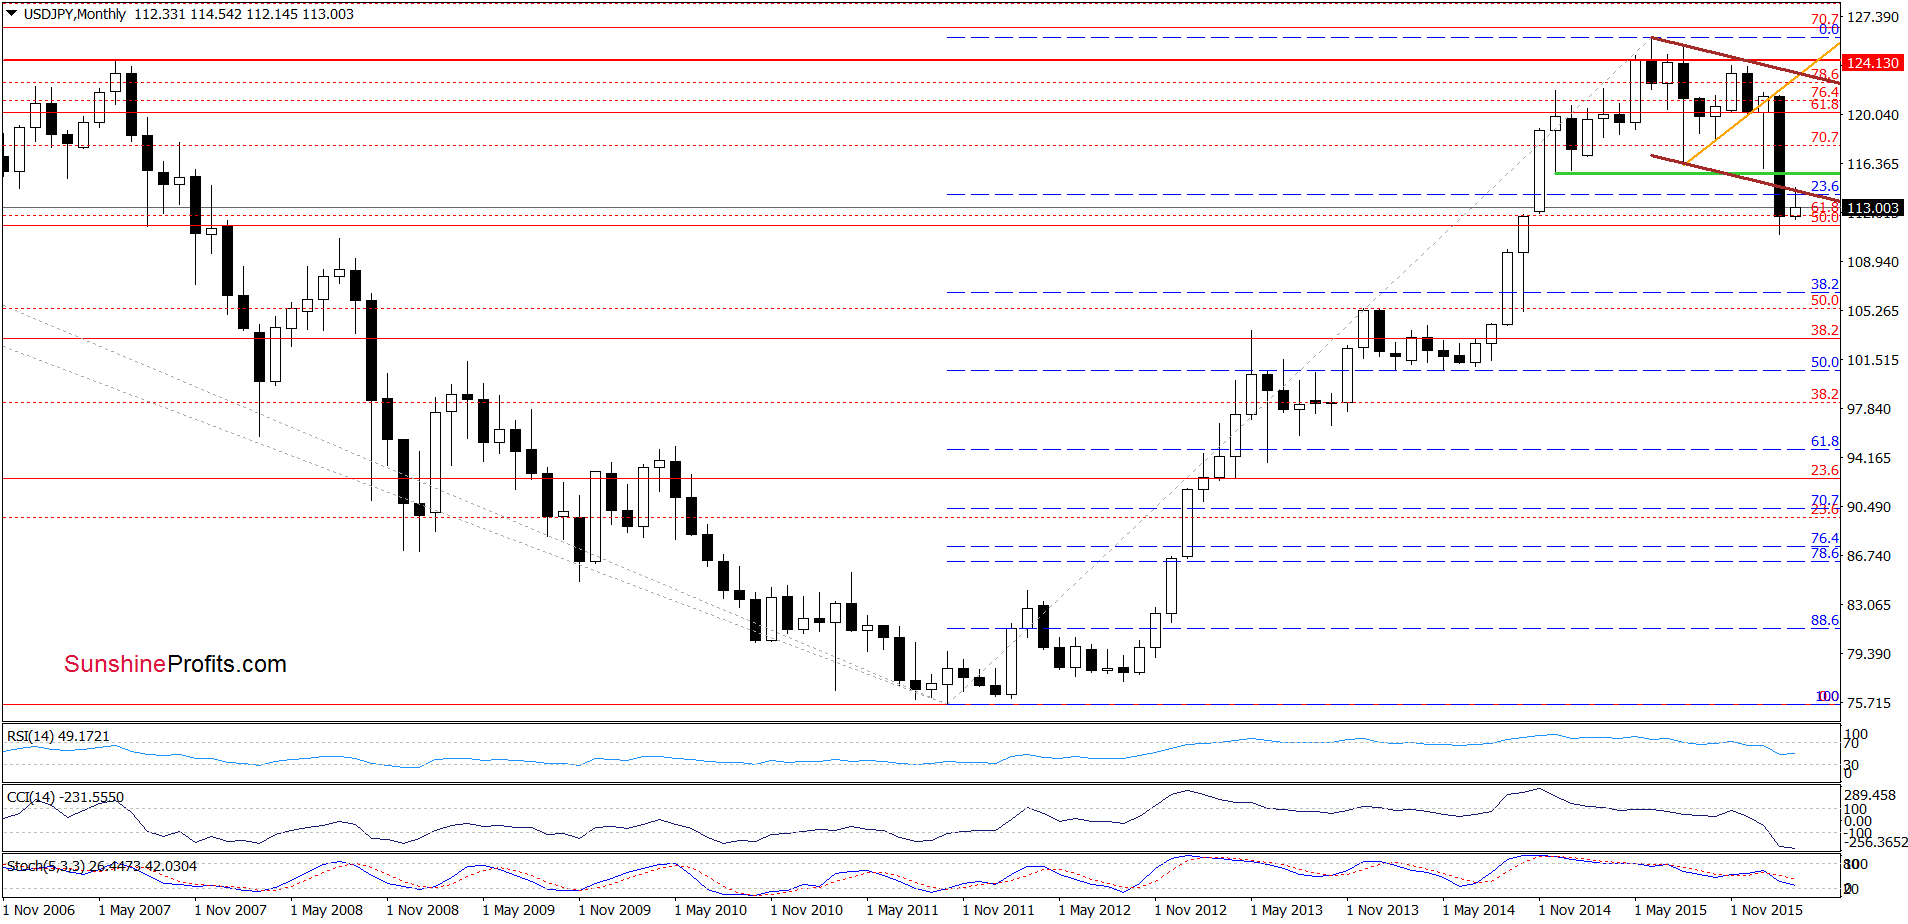
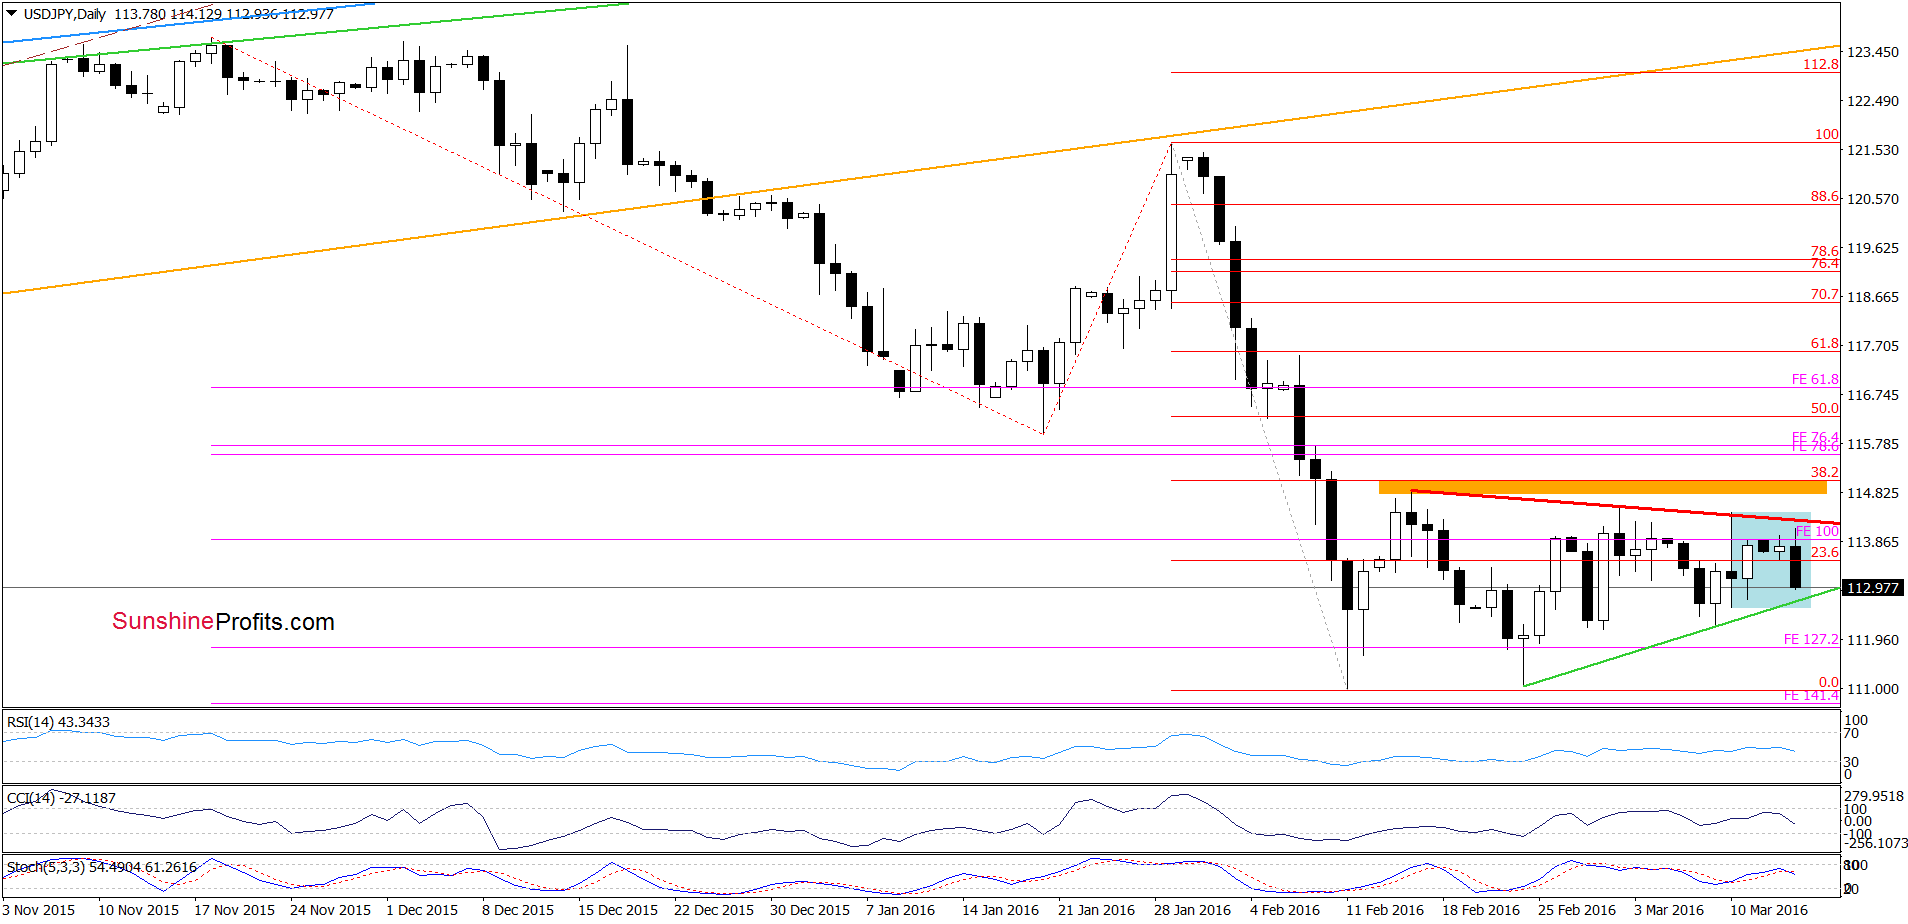
(…) although USD/JPY moved higher in recent days, the pair remains under the orange resistance zone created by the mid-Feb highs and the 38.2% Fibonacci retracement, which serves as the nearest resistance. (…) in our opinion, as long as there won’t be a breakout above the orange zone another bigger upward move is not likely to be seen. Additionally, when we focus on the long-term chart (…), we’ll see that the exchange rate remains under the previously-broken lower border of the brown declining trend channel, which means that as long as this resistance will be in play all gains would be nothing more than a verification of earlier breakdown.
Looking at the above charts, we see that the proximity to the above-mentioned resistance area encouraged currency bears to act, which resulted in a sharp decline earlier today. Despite this move, the overall situation hasn’t changed much as USD/JPY remains in the blue consolidation. Nevertheless, the Stochastic Oscillator generated a sell signal once again, suggesting that the pair will test the green support line based on the previous lows in the coming day. If it is broken, the next downside target would be around 110.96-111.97, where the Feb lows (in terms of intraday lows and the lowest opening prices) are.
Very short-term outlook: mixed
Short-term outlook: mixed
MT outlook: mixed
LT outlook: mixed
Trading position (short-term; our opinion): No positions are justified from the risk/reward perspective at the moment. We will keep you informed should anything change, or should we see a confirmation/invalidation of the above.
USD/CAD
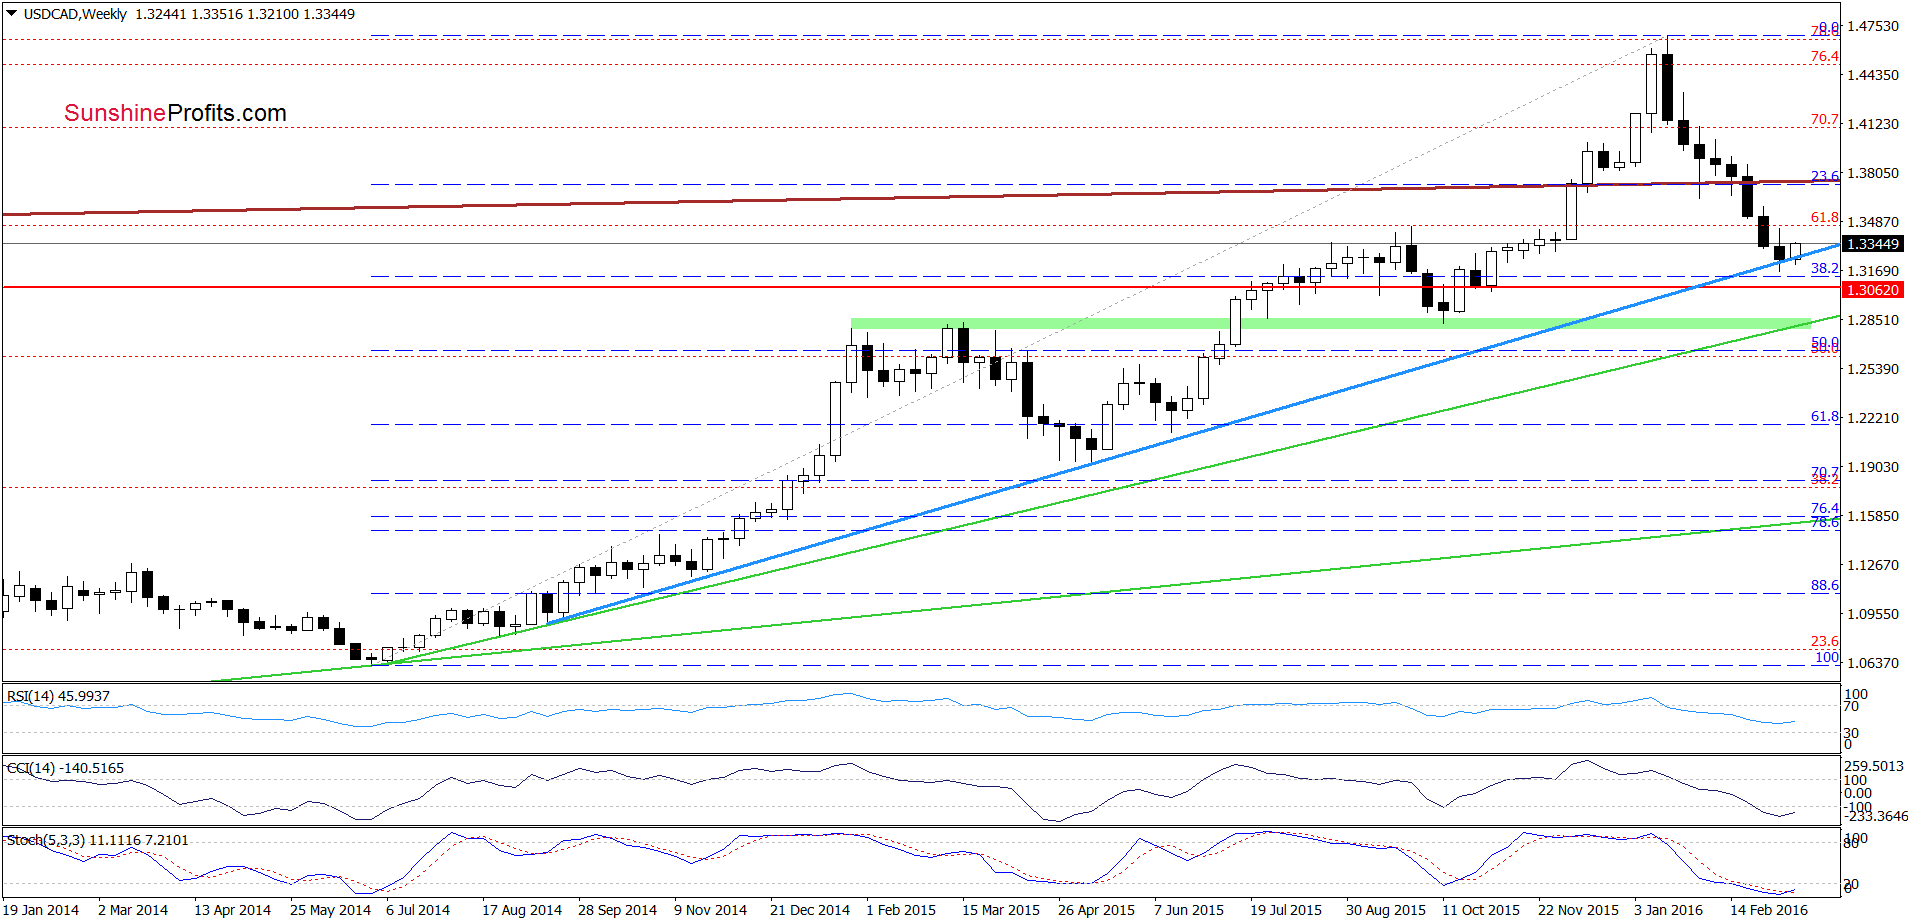
On the medium-term chart, we see that USD/CAD bounced off the long-term blue support line, which suggests further improvement in the coming week.
Will we see a pro-growth scenario? Let’s examine the very short-term picture and look for more clues about future moves.
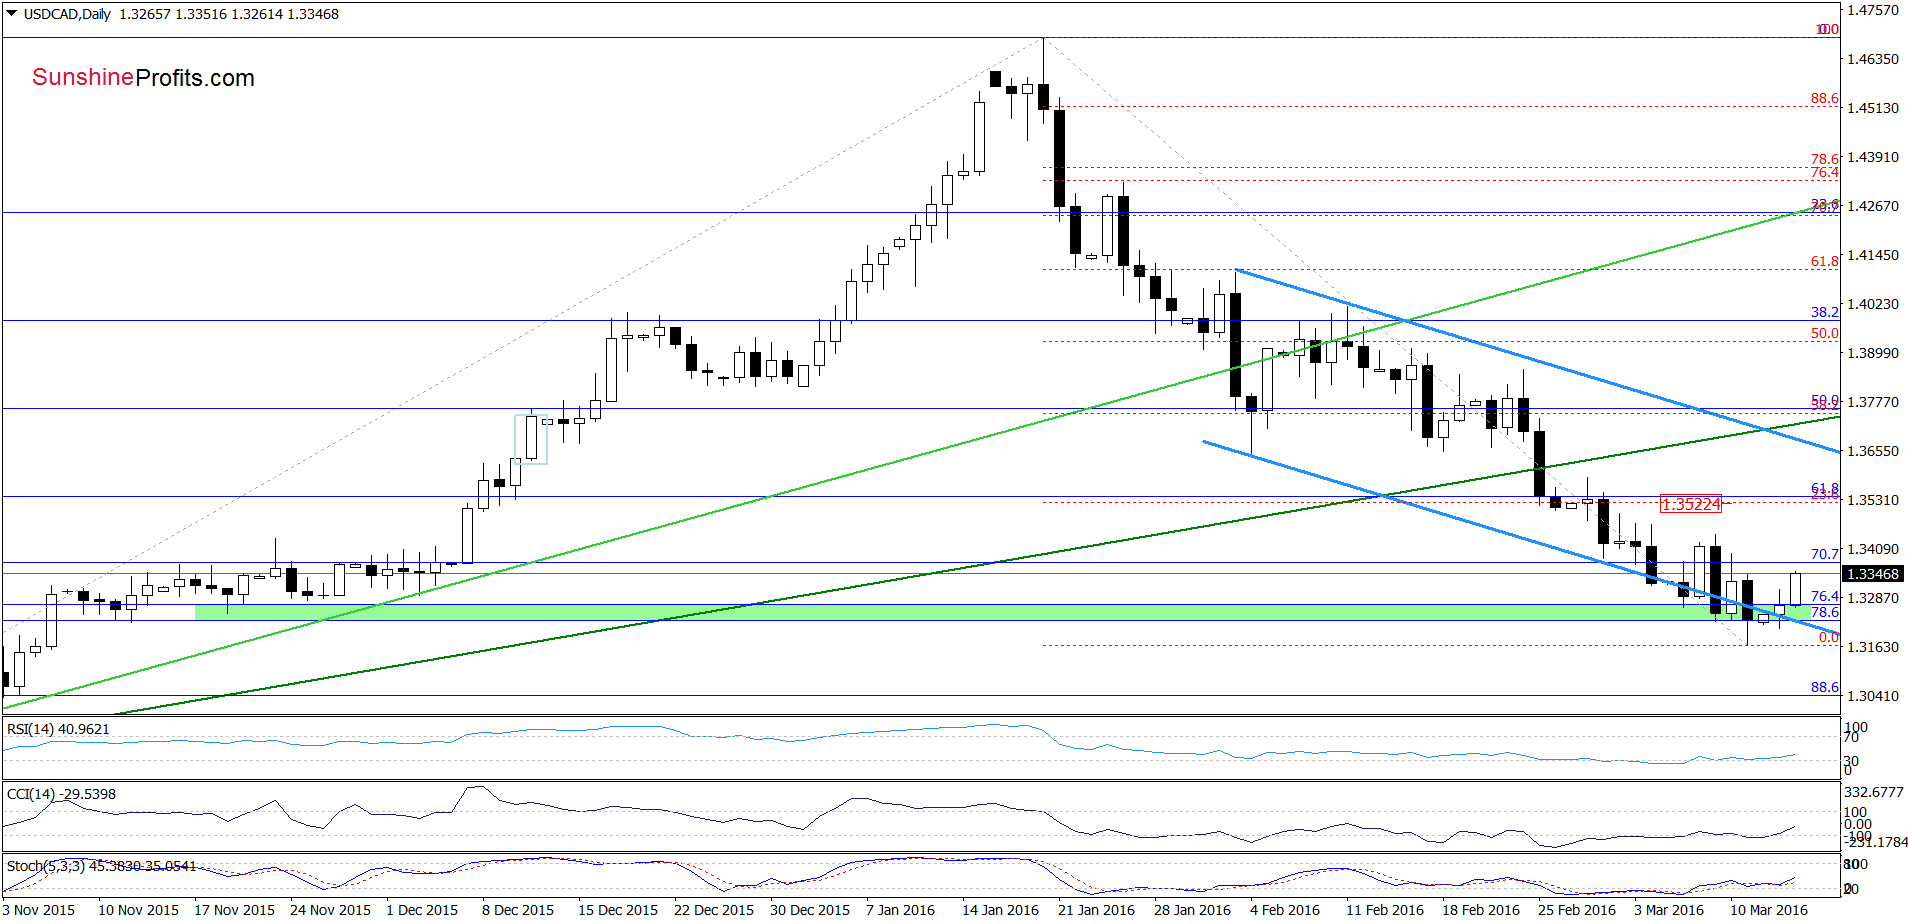
Yesterday we wrote the following:
(…) although USD/CAD extended losses and dropped under the lower border of the blue declining trend channel on Friday, the green support zone (created by the 76.4% and 78.6% Fibonacci retracement levels) encouraged currency bulls to act, which resulted in an invalidation of earlier breakdown earlier today. Taking this fact into account (which would be more positive if USD/CAD closes today’s session above the lower border of the blue declining trend channel) and combining it with the green support zone and the current position of the indicators (they are all oversold), we think that further improvement is just around the corner.
From today’s point of view we see that the situation developed in line with the above scenario and USD/CAD closed yesterday’s session above the lower border of the blue declining trend channel, invalidating earlier breakdown. This positive signal triggered further improvement earlier today, which in combination with buy signals generated by all three indicators suggests that the exchange rate will extend gains in the coming days. If this is the case the first upside target would be around 1.3522, where the 23.6% Fibonacci retracement (based on the entire Jan-March decline) is. Nevertheless, in our opinion, currency bulls will break above this resistance and test the upper border of the blue declining trend channel in the coming days.
Very short-term outlook: mixed with bullish bias
Short-term outlook: mixed with bullish bias
MT outlook: mixed
LT outlook: mixed
Trading position (short-term; our opinion): No positions are justified from the risk/reward perspective at the moment. We will keep you informed should anything change, or should we see a confirmation/invalidation of the above.
Thank you.
Nadia Simmons
Forex & Oil Trading Strategist
Przemyslaw Radomski, CFA
Founder, Editor-in-chief
Gold & Silver Trading Alerts
Forex Trading Alerts
Oil Investment Updates
Oil Trading Alerts
