

Forex Trading Alert originally sent to subscribers on March 8, 2016, 10:55 AM.
Earlier today, the yen moved higher against the greenback after weak Chinese data (which showed that China’s exports dropped 25.4% from a year earlier, while imports fell by 13.8% year-on-year, missing analysts’ forecasts) increased safe haven demand. Will we see further improvement in the coming days?
In our opinion the following forex trading positions are justified - summary:
- EUR/USD: short (stop-loss order at 1.1512; initial downside target at 1.0572)
- GBP/USD: none
- USD/JPY: none
- USD/CAD: none
- USD/CHF: none
- AUD/USD: none
EUR/USD
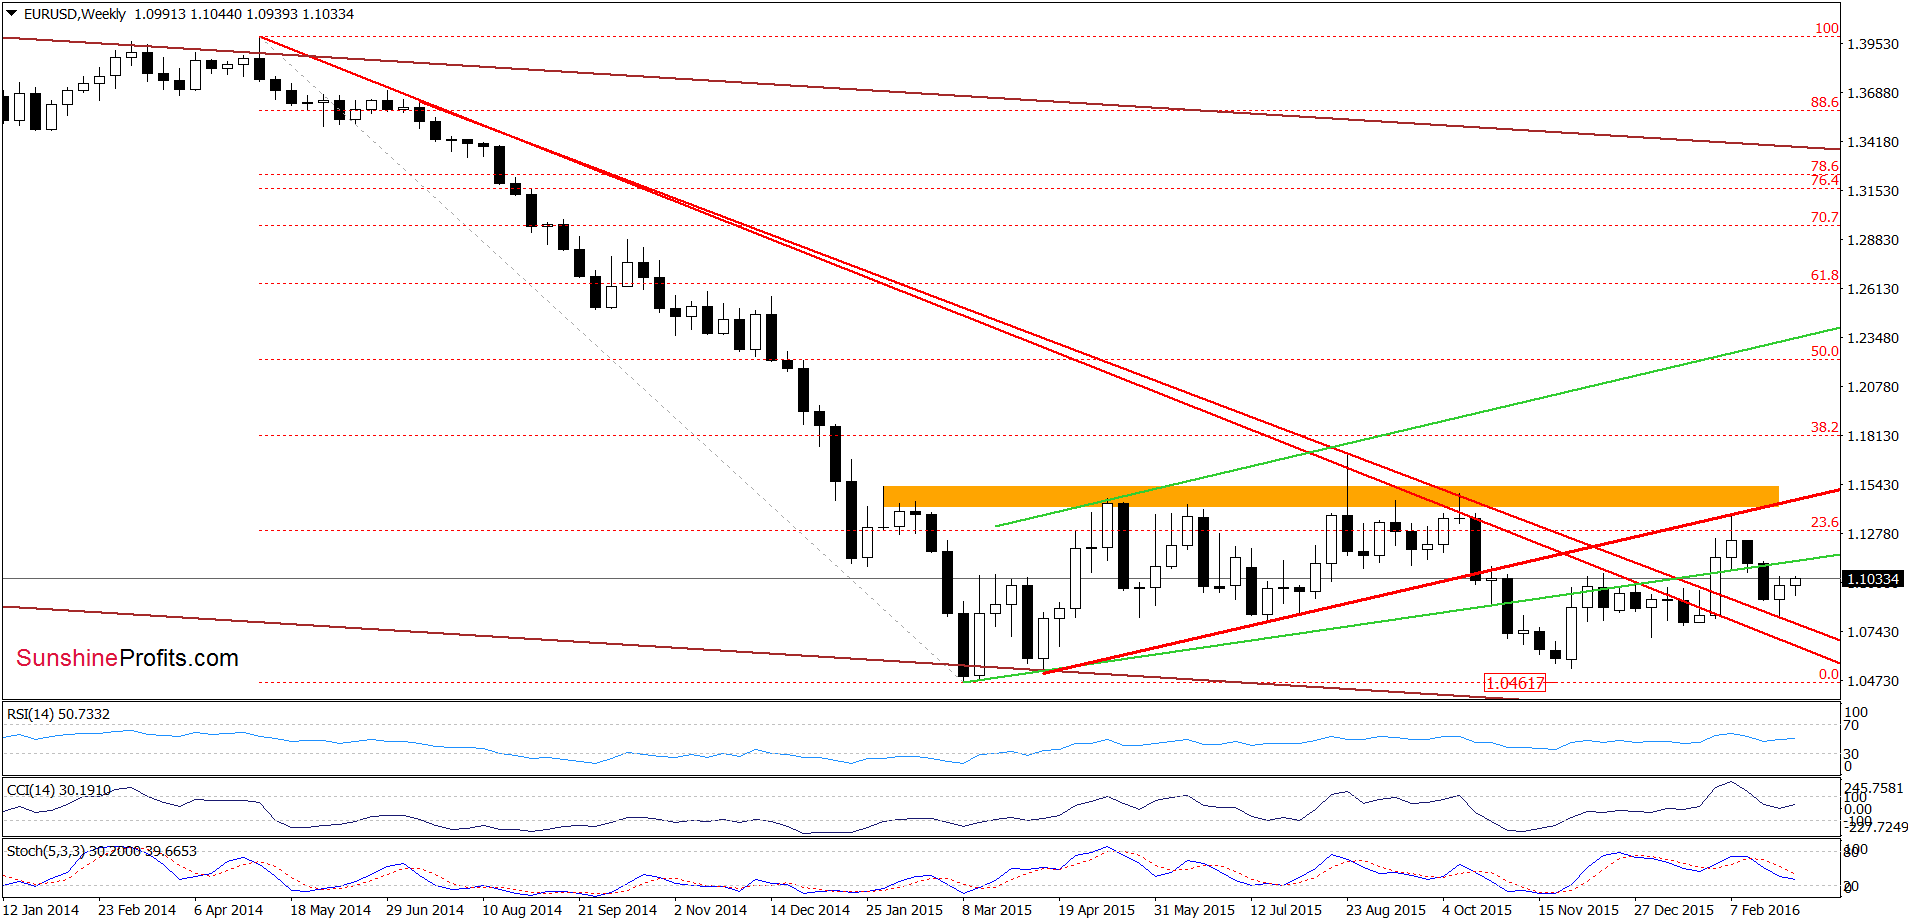
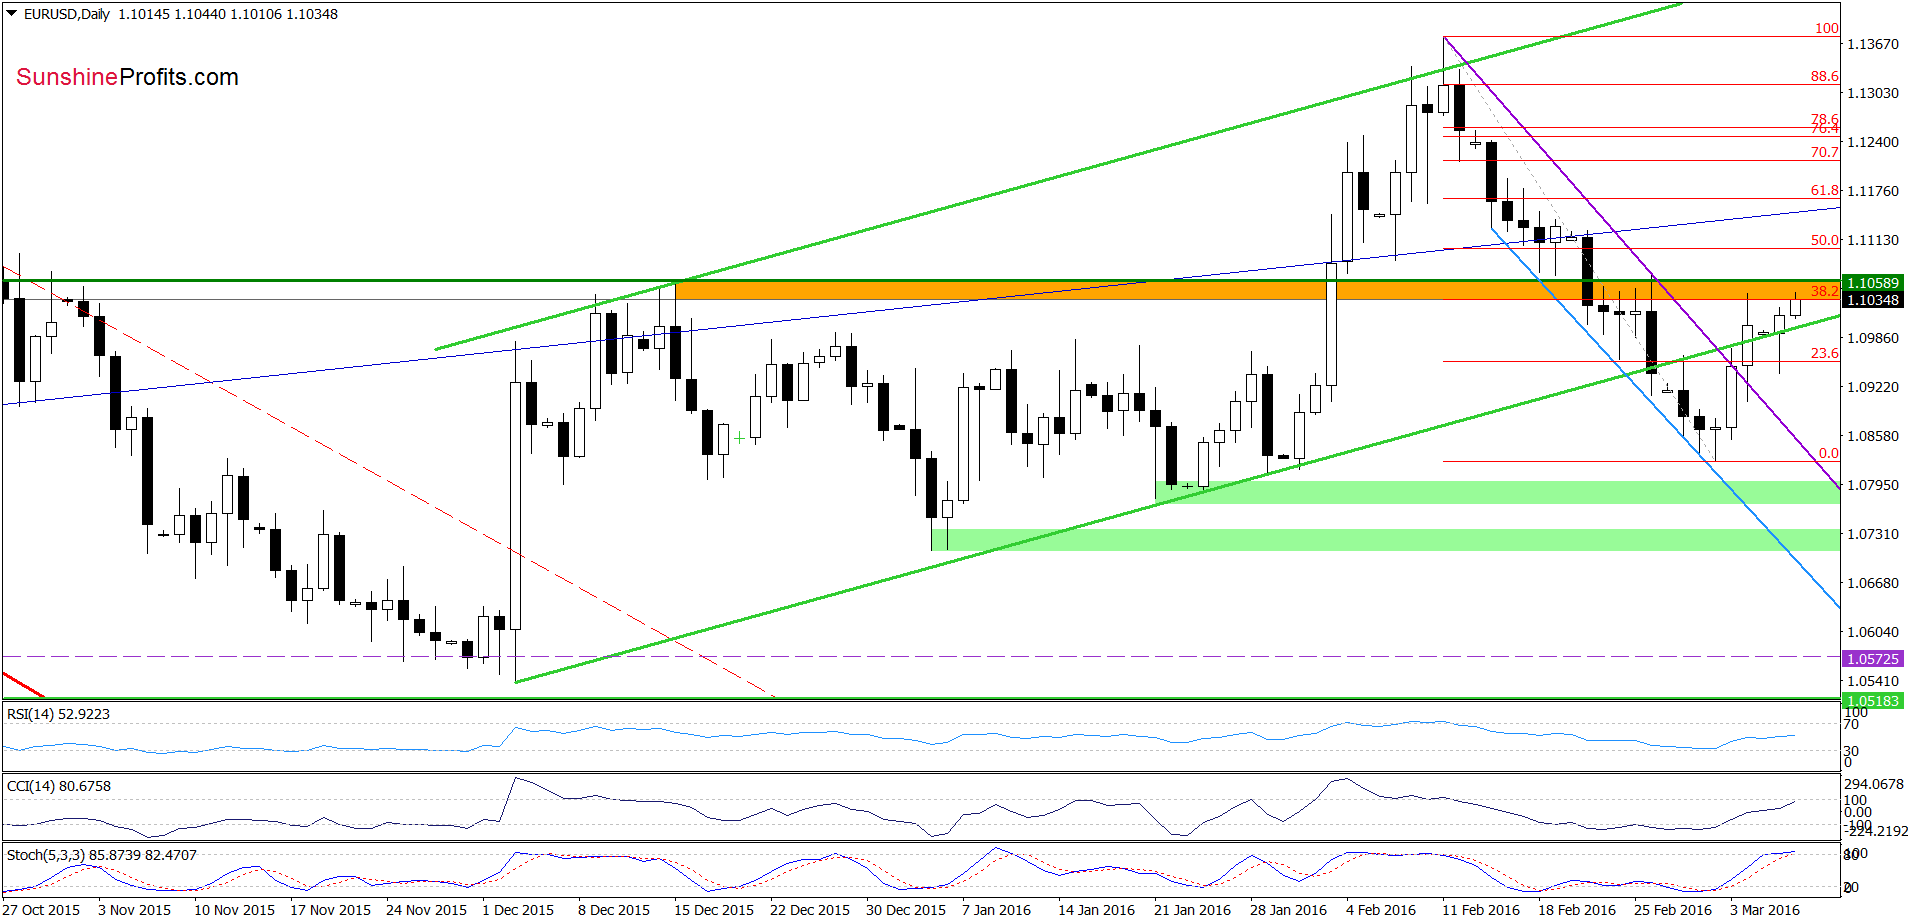
Although EUR/USD invalidated yesterday’s breakdown under the lower border of the green rising trend channel, the orange resistance zone (created by the 38.2% Fibonacci retracement and the horizontal resistance line based on the mid-Dec highs) continues to keep gains in check. Taking this fact into account, and combining it with the current position of the Stochastic Oscillator (the indicator is very lose to generating a sell signal), we think that reversal is just around the corner. If we see such price action, the exchange rate will test the strength of the recent lows and the purple declining support line.
Very short-term outlook: bearish
Short-term outlook: bearish
MT outlook: mixed with bearish bias
LT outlook: mixed
Trading position (short-term; our opinion): Short positions (with a stop-loss order at 1.1512 and the initial downside target at 1.0572) are justified from the risk/reward perspective. We will keep you informed should anything change, or should we see a confirmation/invalidation of the above.
GBP/USD
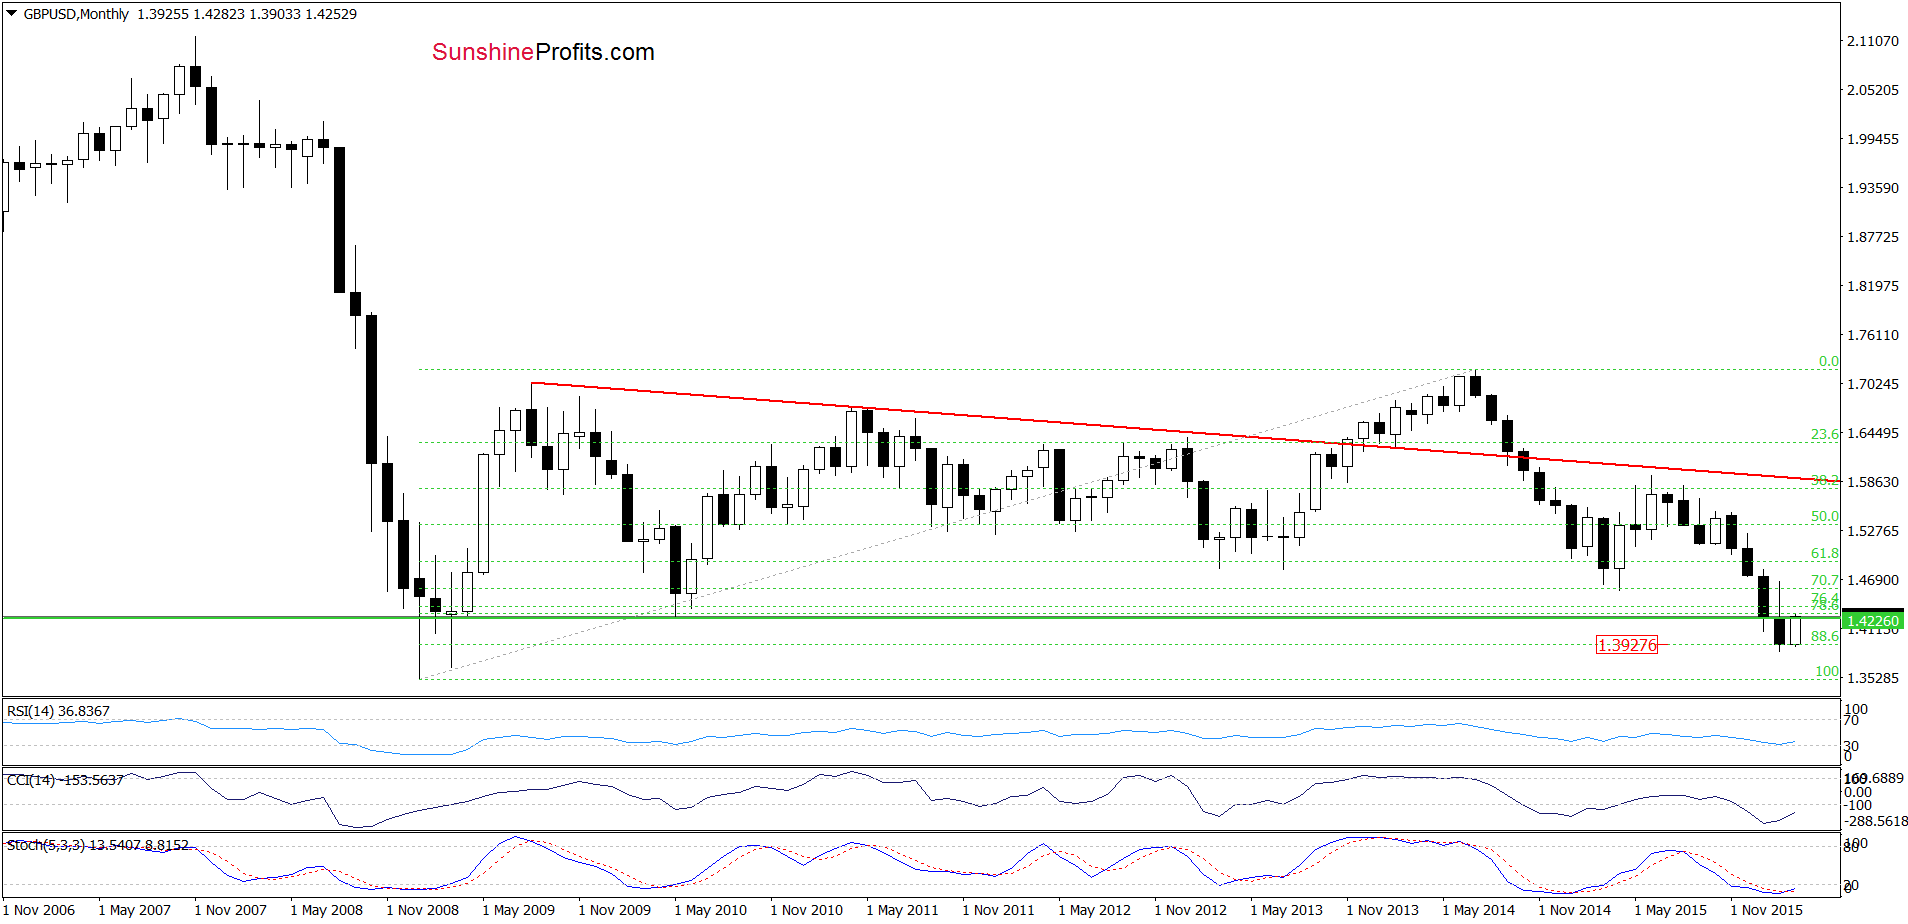
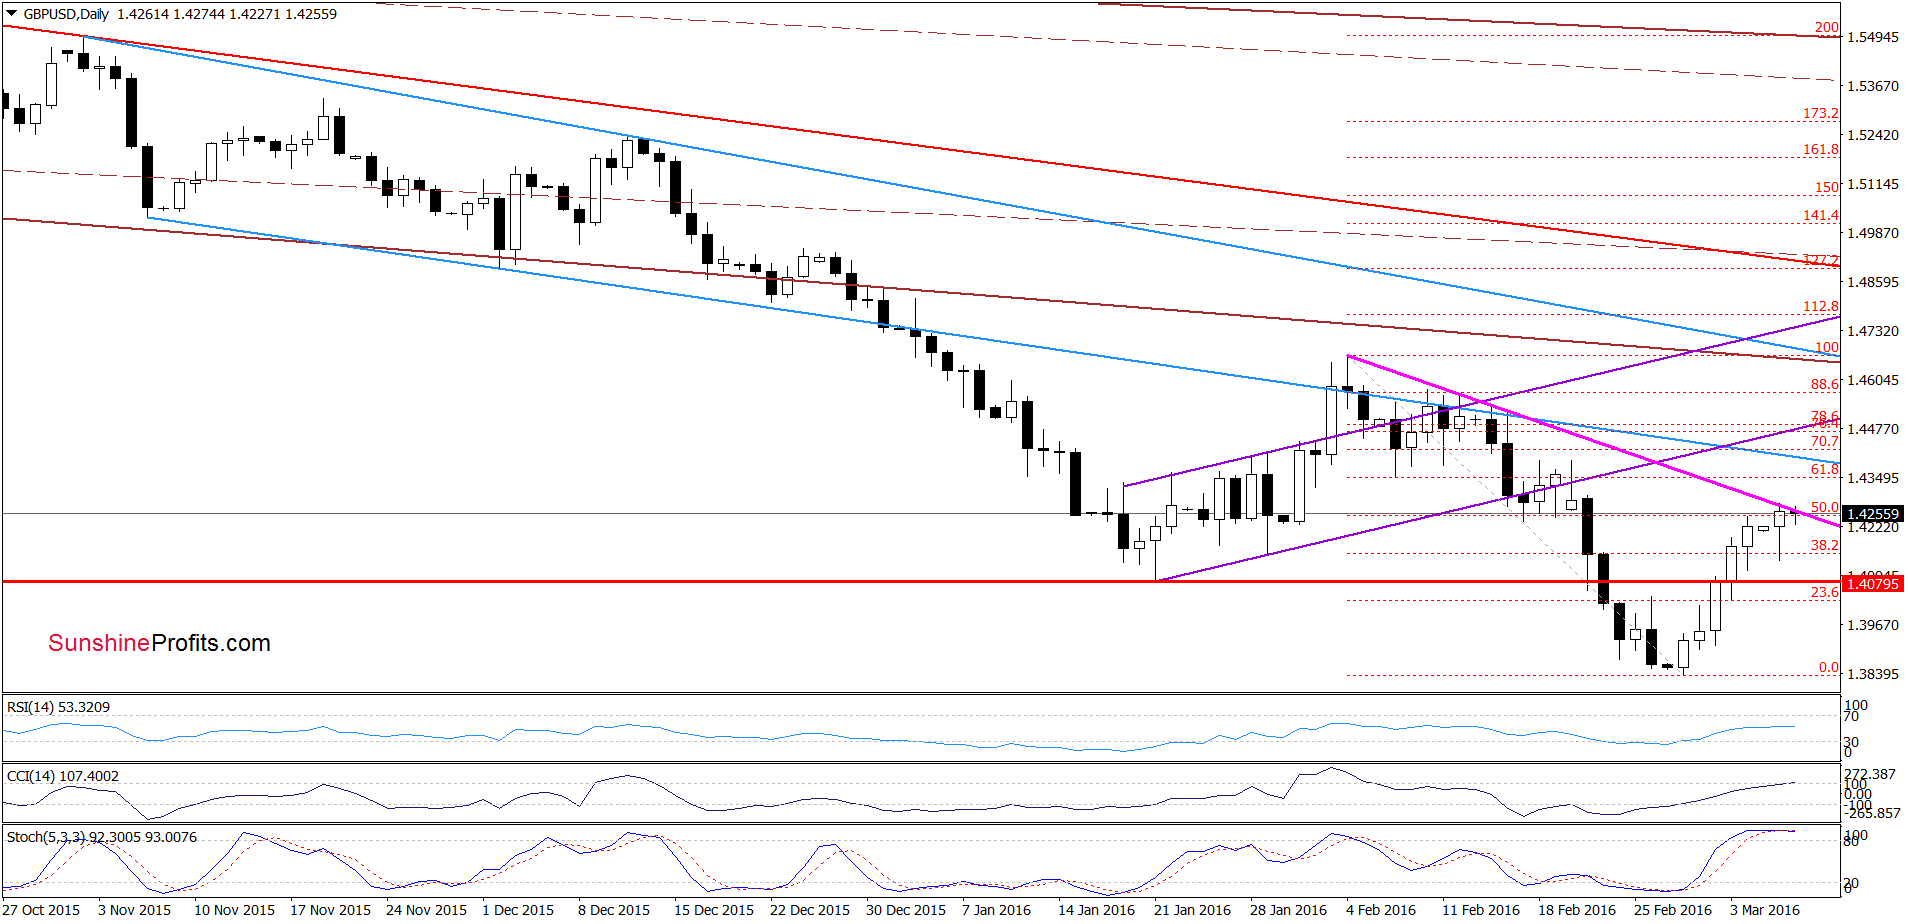
On the above charts, we see that GBP/USD reached the solid resistance zone created by the May 2010 low (seen on the long-term chart), the 50% Fibonacci retracement and the pink resistance line (marked on the daily chart). Therefore, what we wrote yesterday remains up to date:
(…) at the long-term chart, we see that GBP/USD rebounded and climbed to the horizontal resistance line based on the May 2010 lows, which looks like a verification of earlier breakdown. (…) How did the recent price action affect the very short-term picture? (…) On the daily chart, we see that GBP/USD reached the 50% Fibonacci retracement based on the Feb decline. As you see this resistance in combination with the proximity to the pink resistance line based on the previous highs encouraged currency bears to act earlier today. Taking all the above and the current position of the daily CCI and Stochastic Oscillator into account, we think that lower values of GBP/USD are just around the corner. Therefore if the pair declines from here the first downside target would be around 1.4090, where the 38.2% Fibonacci retracement (based on the recent upward move) and the red horizontal support line are.
Very short-term outlook: mixed with bearish bias
Short-term outlook: mixed with bearish bias
MT outlook: mixed
LT outlook: mixed
Trading position (short-term; our opinion): No positions are justified from the risk/reward perspective at the moment. We will keep you informed should anything change, or should we see a confirmation/invalidation of the above.
USD/CAD
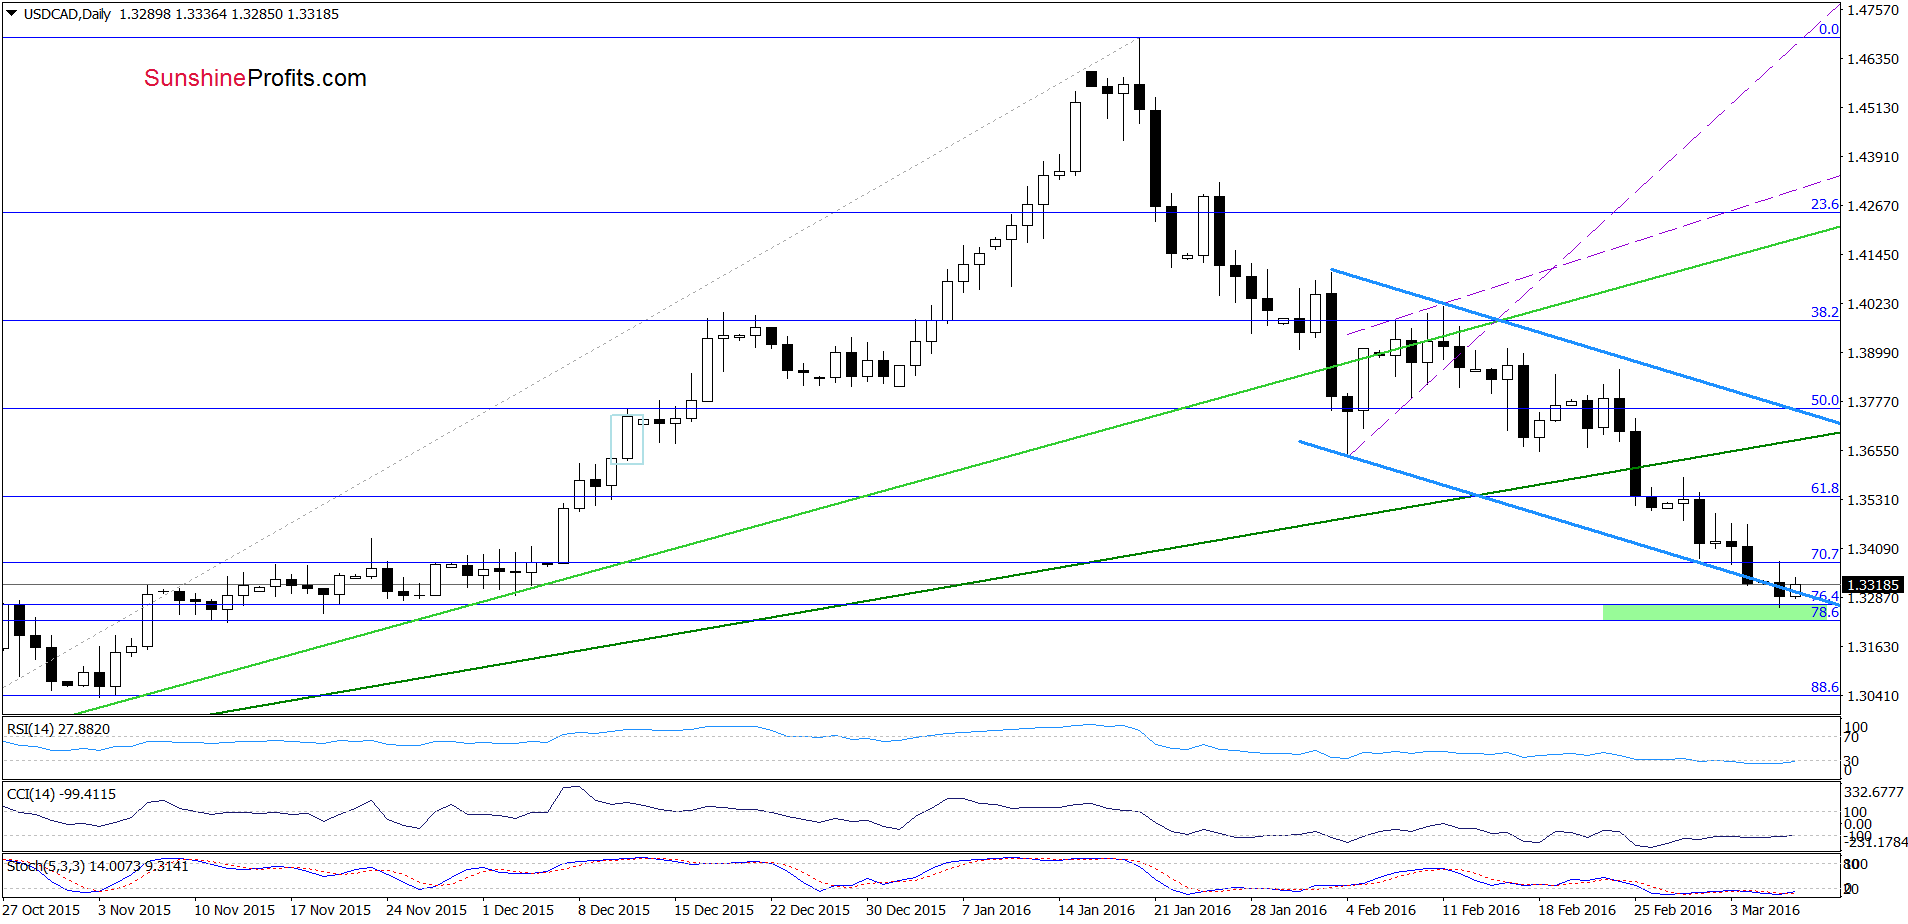
On the daily chart, we see that although USD/CAD extended losses and dropped under the lower border of the blue declining trend channel yesterday, the green support zone (created by the 76.4% and 78.6% Fibonacci retracement levels) encouraged currency bulls to act, which resulted in an invalidation of earlier breakdown. Taking this fact into account and combining it with the green support zone and the current position of the indicators, we think that further improvement is just around the corner.
Are there any other factors that could encourage currency bulls to act? Let’s examine the daily chart and find out.
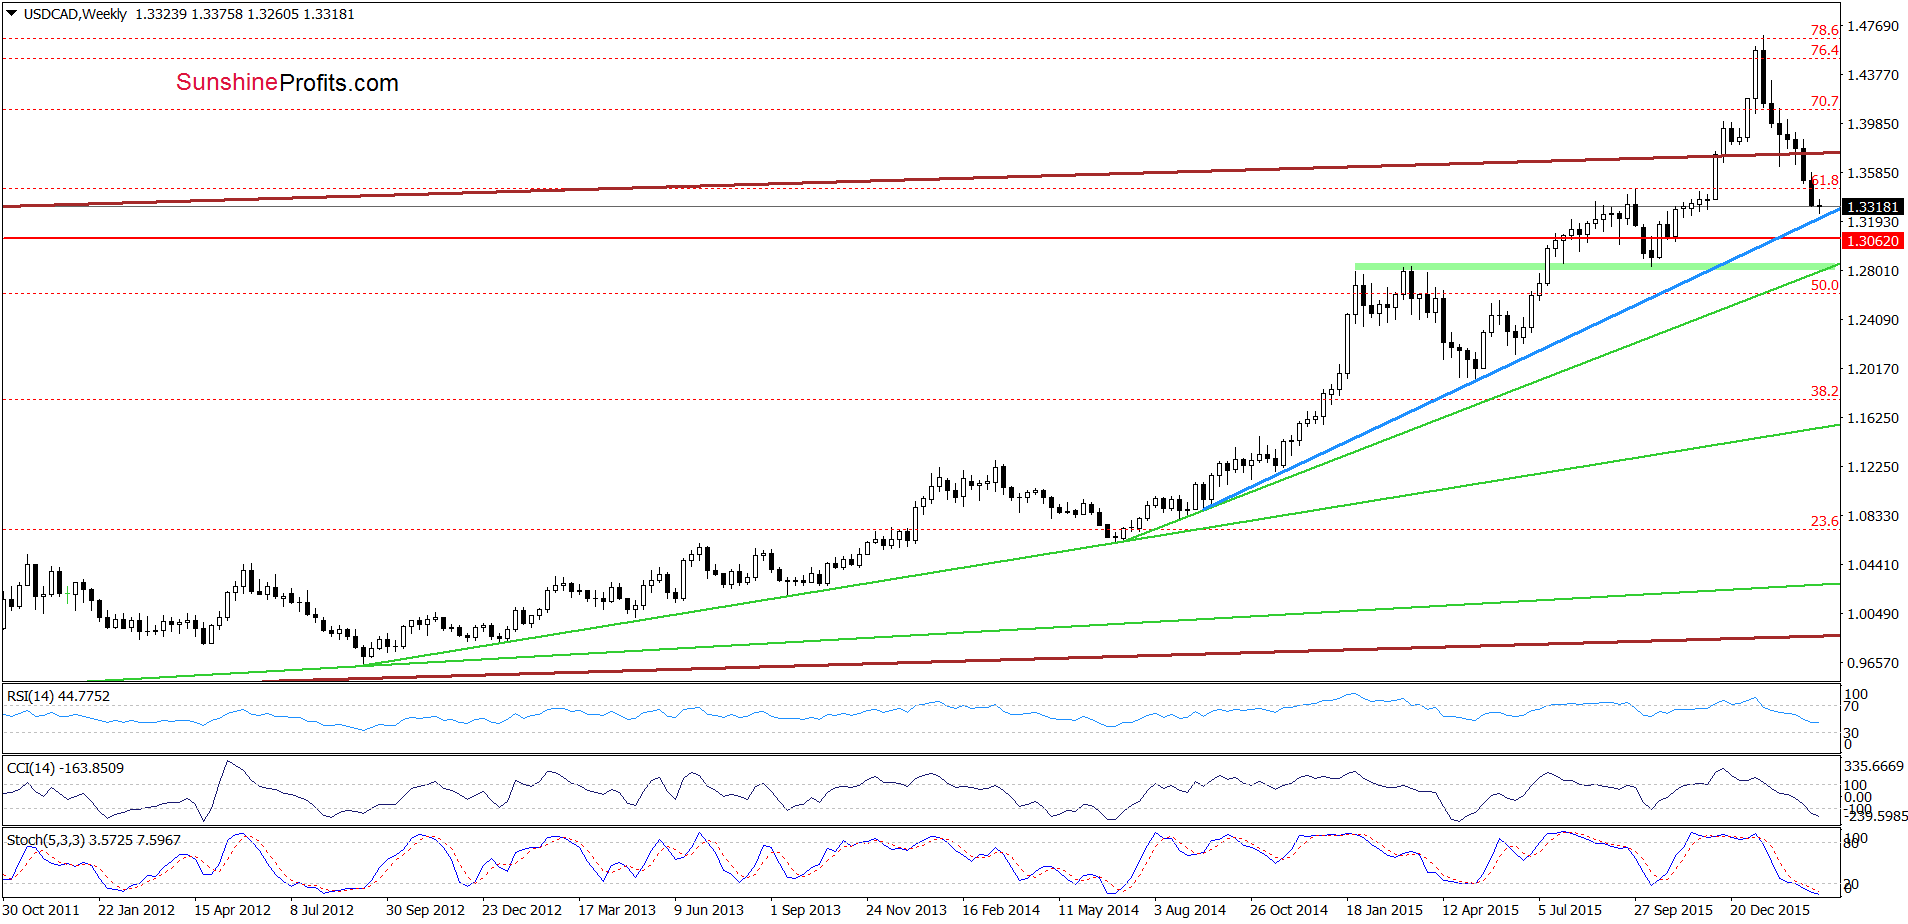
From this perspective, we see that the recent downward move took USD/CAD to the long-term blue support line, which is an additional positive factor that could trigger a rebound in near future.
Very short-term outlook: mixed with bullish bias
Short-term outlook: mixed
MT outlook: mixed
LT outlook: mixed
Trading position (short-term; our opinion): No positions are justified from the risk/reward perspective at the moment. We will keep you informed should anything change, or should we see a confirmation/invalidation of the above.
Thank you.
Nadia Simmons
Forex & Oil Trading Strategist
Przemyslaw Radomski, CFA
Founder, Editor-in-chief
Gold & Silver Trading Alerts
Forex Trading Alerts
Oil Investment Updates
Oil Trading Alerts
