

Forex Trading Alert originally sent to subscribers on October 22, 2015, 6:49 AM.
Earlier today, official data showed that British retail sales increased by 1.9% in the previous month, beating forecasts for a gain of 0.3%. Additionally, year-on-year, retail sales rose by 6.5% in September, above expectations for a 4.8% gain. On top of that, core retail sales (without automobile sales) jumped 1.7% last month also beating forecasts for a 0.3% increase. Thanks to these bullish numbers GBP/USD rebounded sharply and climbed to the last week’s high. Will we see higher values of the exchange rate in the coming days?
In our opinion the following forex trading positions are justified - summary:
- EUR/USD: short (a stop-loss order at 1.1887; the downside target around 1.0938)
- GBP/USD: none
- USD/JPY: none
- USD/CAD: none
- USD/CHF: none
- AUD/USD: none
EUR/USD
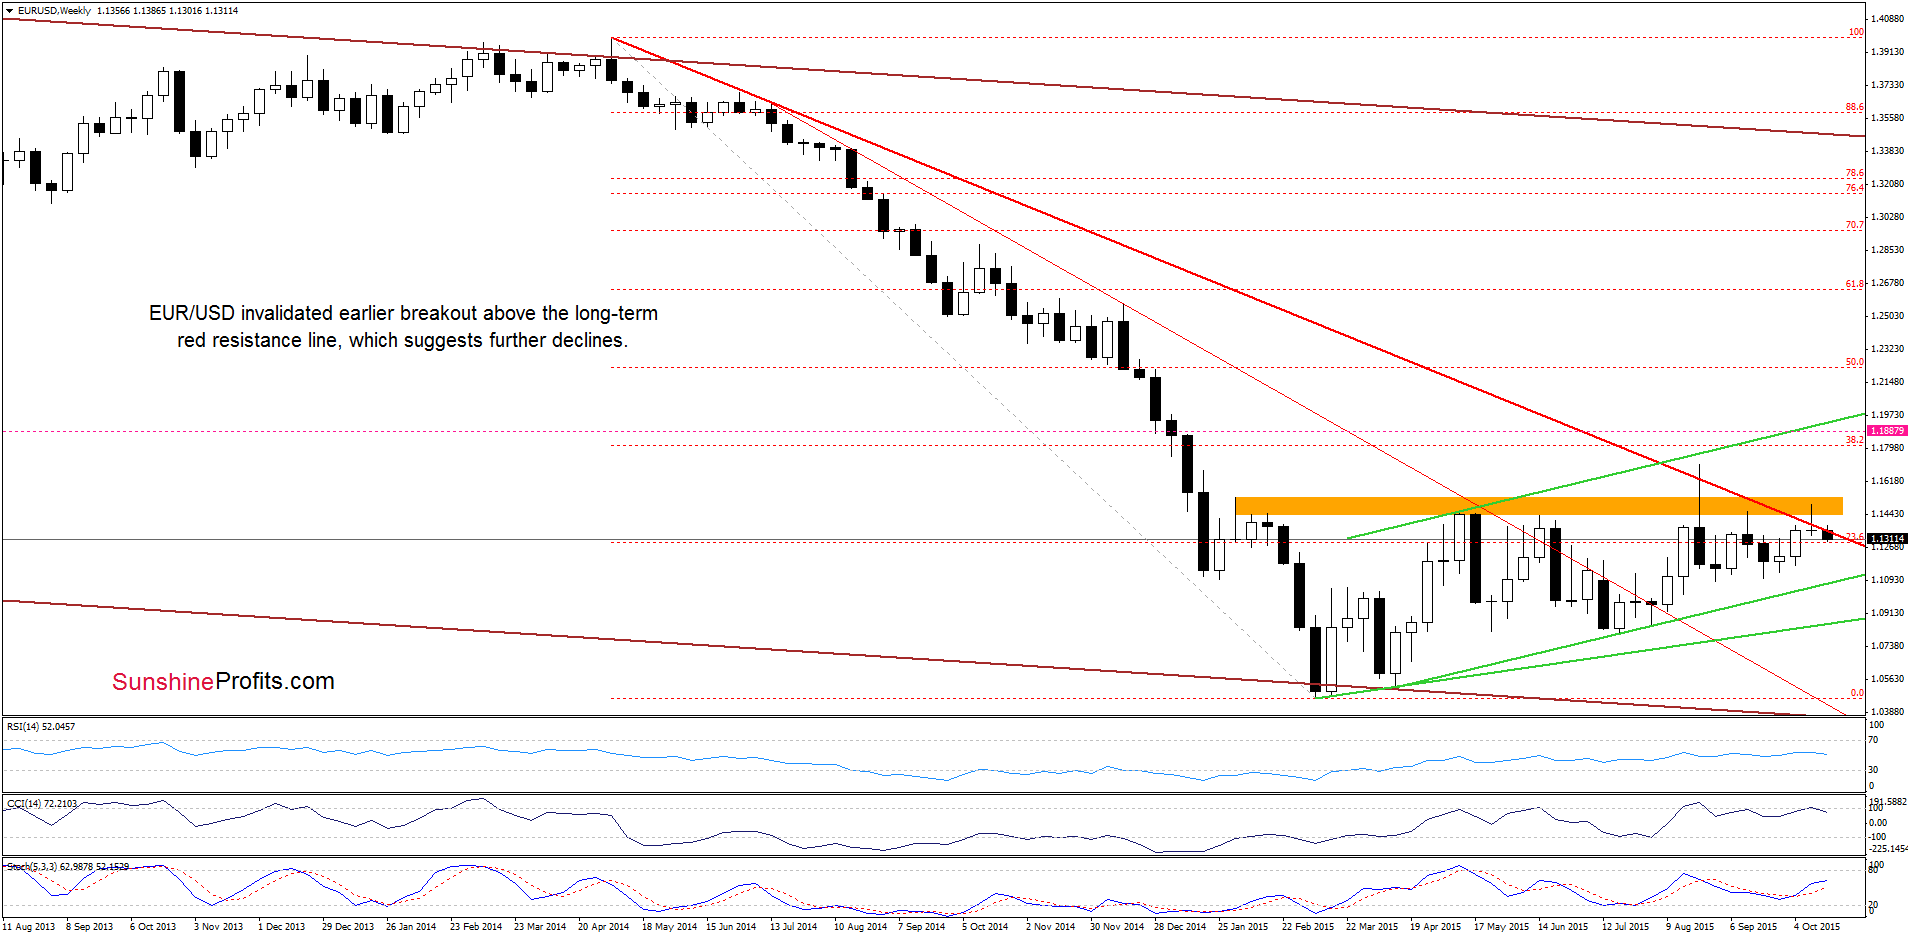
The medium-term picture remains almost unchanged as EUR/USD is trading below the long-term red declining resistance line.
What can we infer from the daily chart? Let’s check.
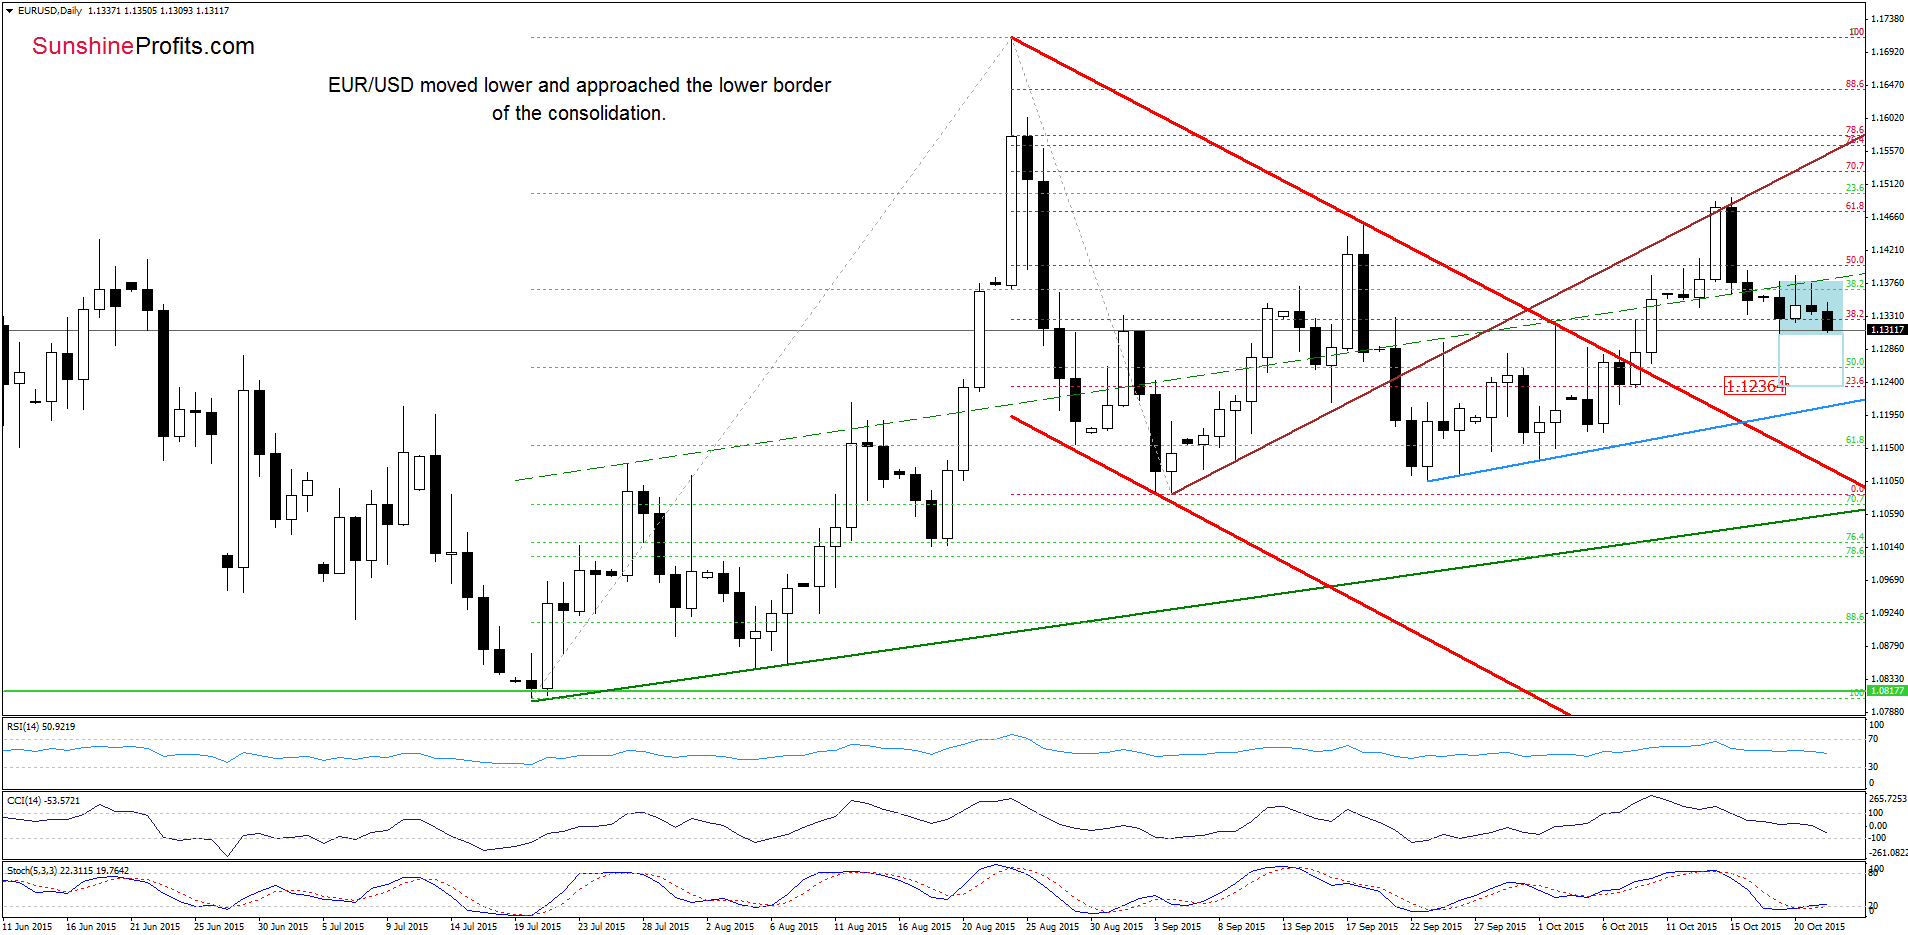
On Tuesday, we wrote the following:
(…) Despite this increase, we think that as long as there is no daily close above this resistance line, another attempt to move lower is more likely than not.
Looking at the daily chart, we see that currency bears pushed the pair lower as we had expected. With this downward move, EUR/USD approached the lower border of the blue consolidation (based on the Monday’s low), which suggests that if the exchange rate breaks below it, we may see a decline to (at least) 1.1236, where the size of the downswing will correspond to the height of the formation.
Very short-term outlook: bearish
Short-term outlook: bearish
MT outlook: mixed with bearish bias
LT outlook: mixed
Trading position (short-term; our opinion): Short positions with a stop-loss order at 1.1887 are justified from the risk/reward perspective. We will keep you informed should anything change, or should we see a confirmation/invalidation of the above.
GBP/USD
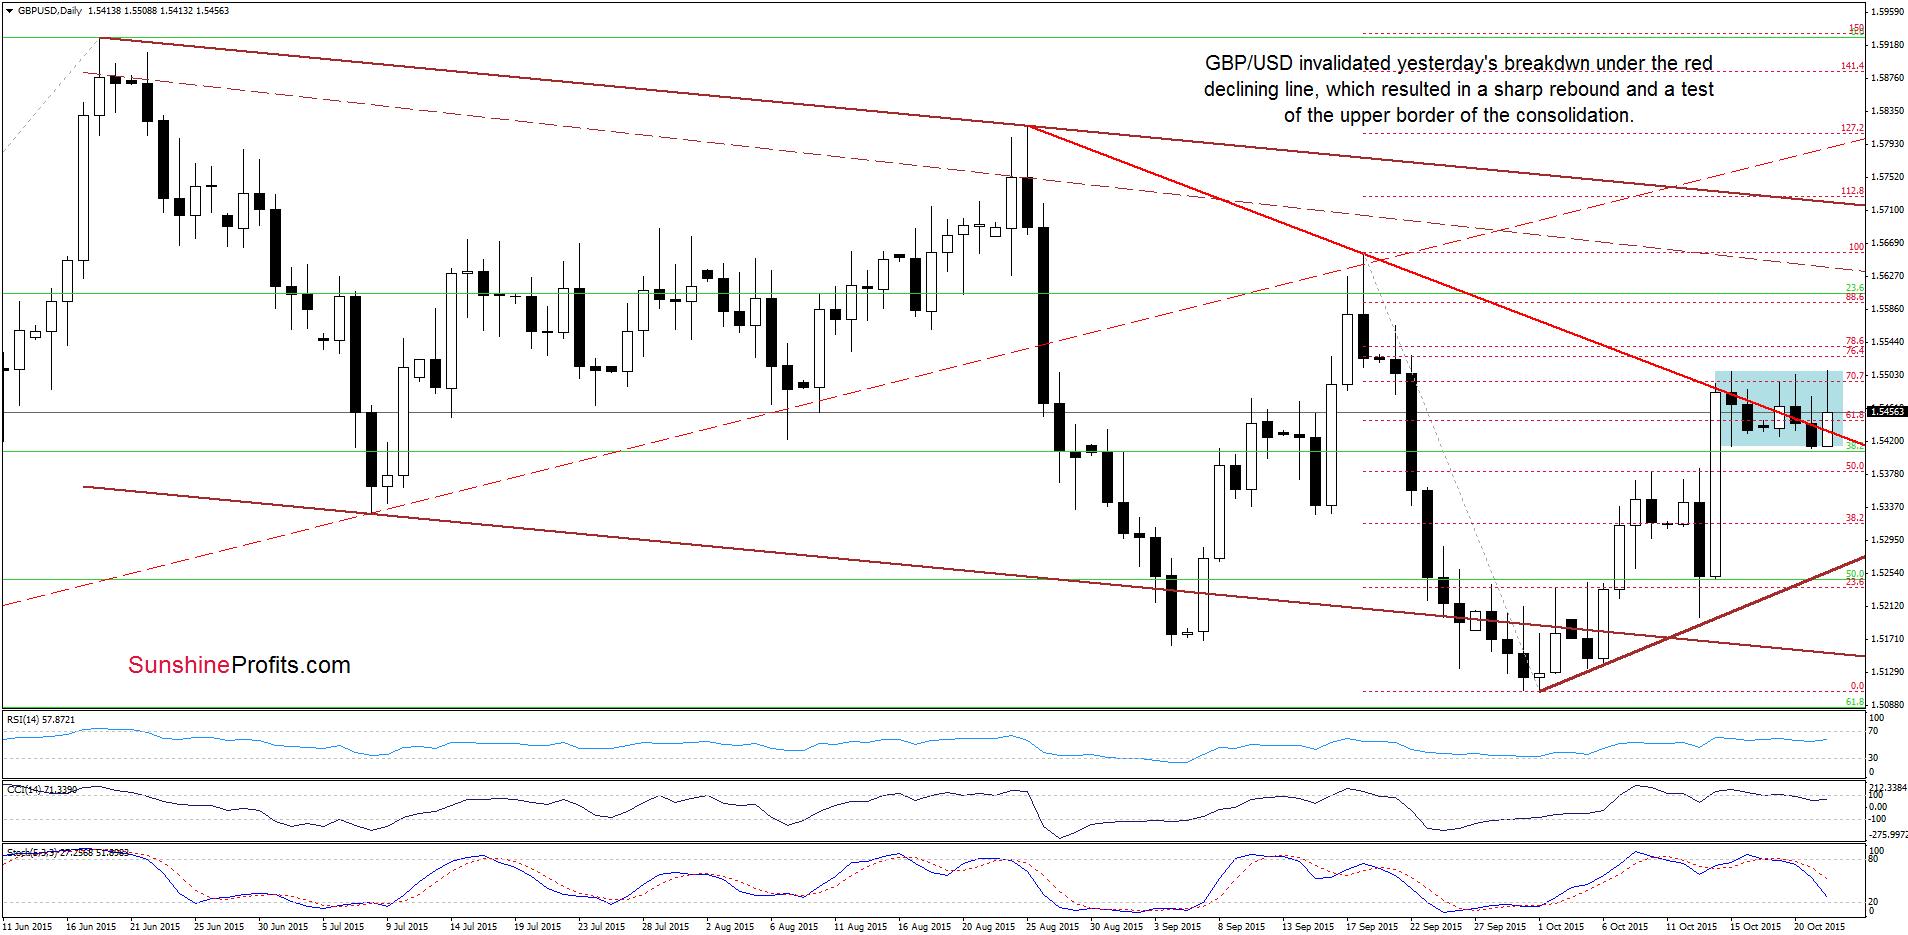
On the daily chart, we see that GBP/USD invalidated small breakdown below the red support/resistance line (based on the Aug 25 and Sept 18 highs), which triggered a sharp rebound earlier today. With this move, the pair approached the upper border of the consolidation, but then gave up the gains, which means that as long as here is no breakout above this resistance further rally is questionable -especially when we factor in the situation in the medium term (on the chart below).
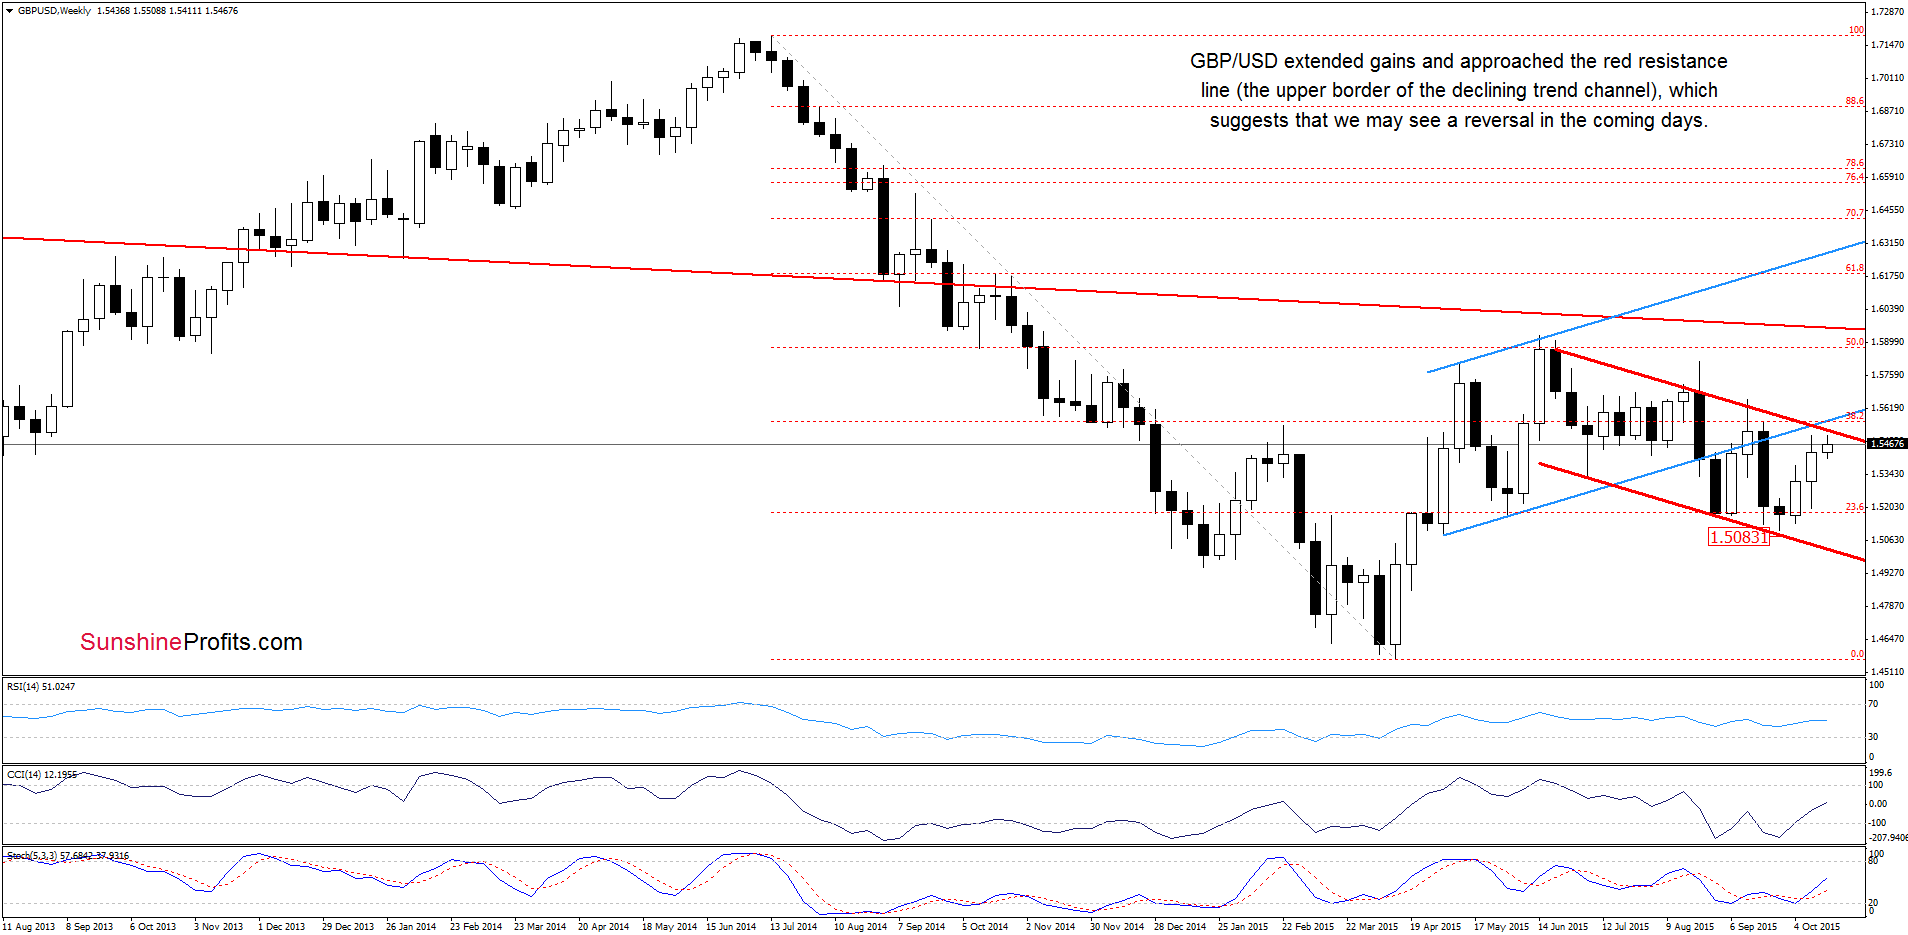
From this perspective we see that GBP/USD extended gains and approached the upper border of the red declining trend channel, which suggests that the space for further rally might be limited.
Finishing today’s commentary on GBP/USD please note that the daily CCI and Stochastic Oscillator generated sell signals, which could encourage currency bears to act and result in another test of the lower border of the consolidation in near future.
Very short-term outlook: mixed with bearish bias
Short-term outlook: mixed
MT outlook: mixed
LT outlook: mixed
Trading position (short-term; our opinion): No positions are justified from the risk/reward perspective at the moment. We will keep you informed should anything change, or should we see a confirmation/invalidation of the above.
USD/CAD
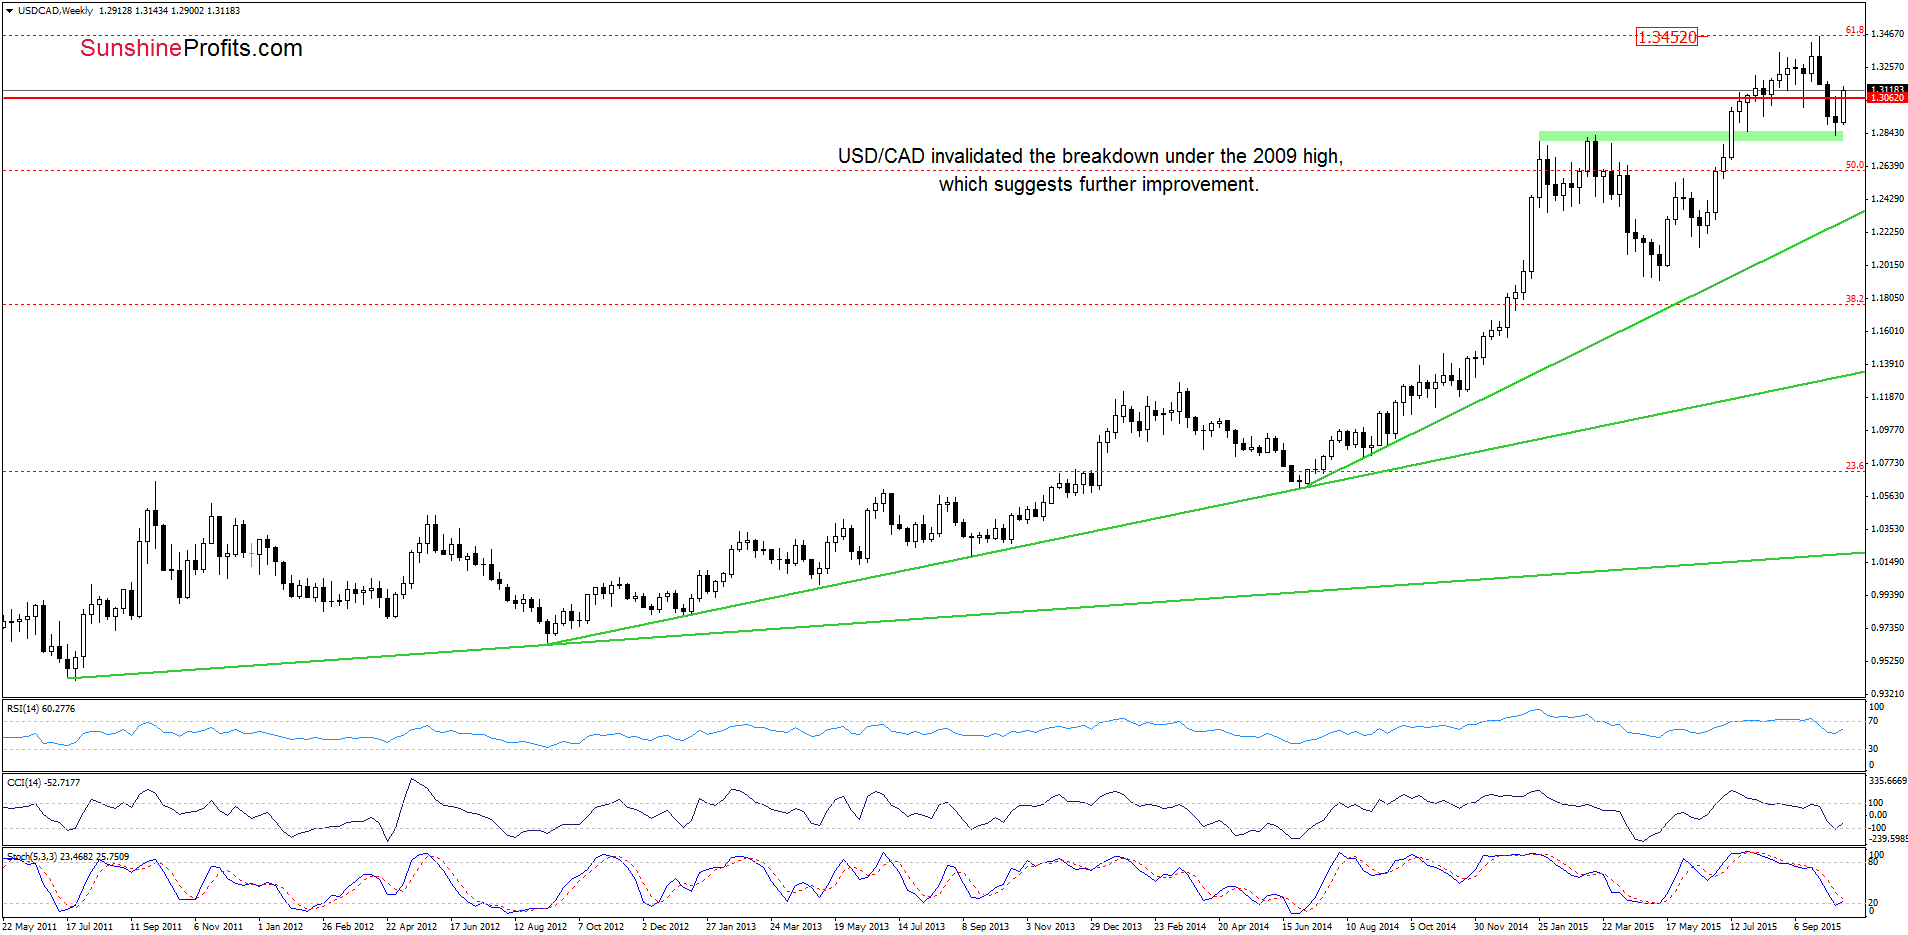
The first thing that catches the eye on the weekly chart is an invalidation of the breakdown under the 2009 high, which is a positive signal that suggests further improvement.
What impact did this move have on the daily chart? Let’s check.
On Tuesday, we wrote:
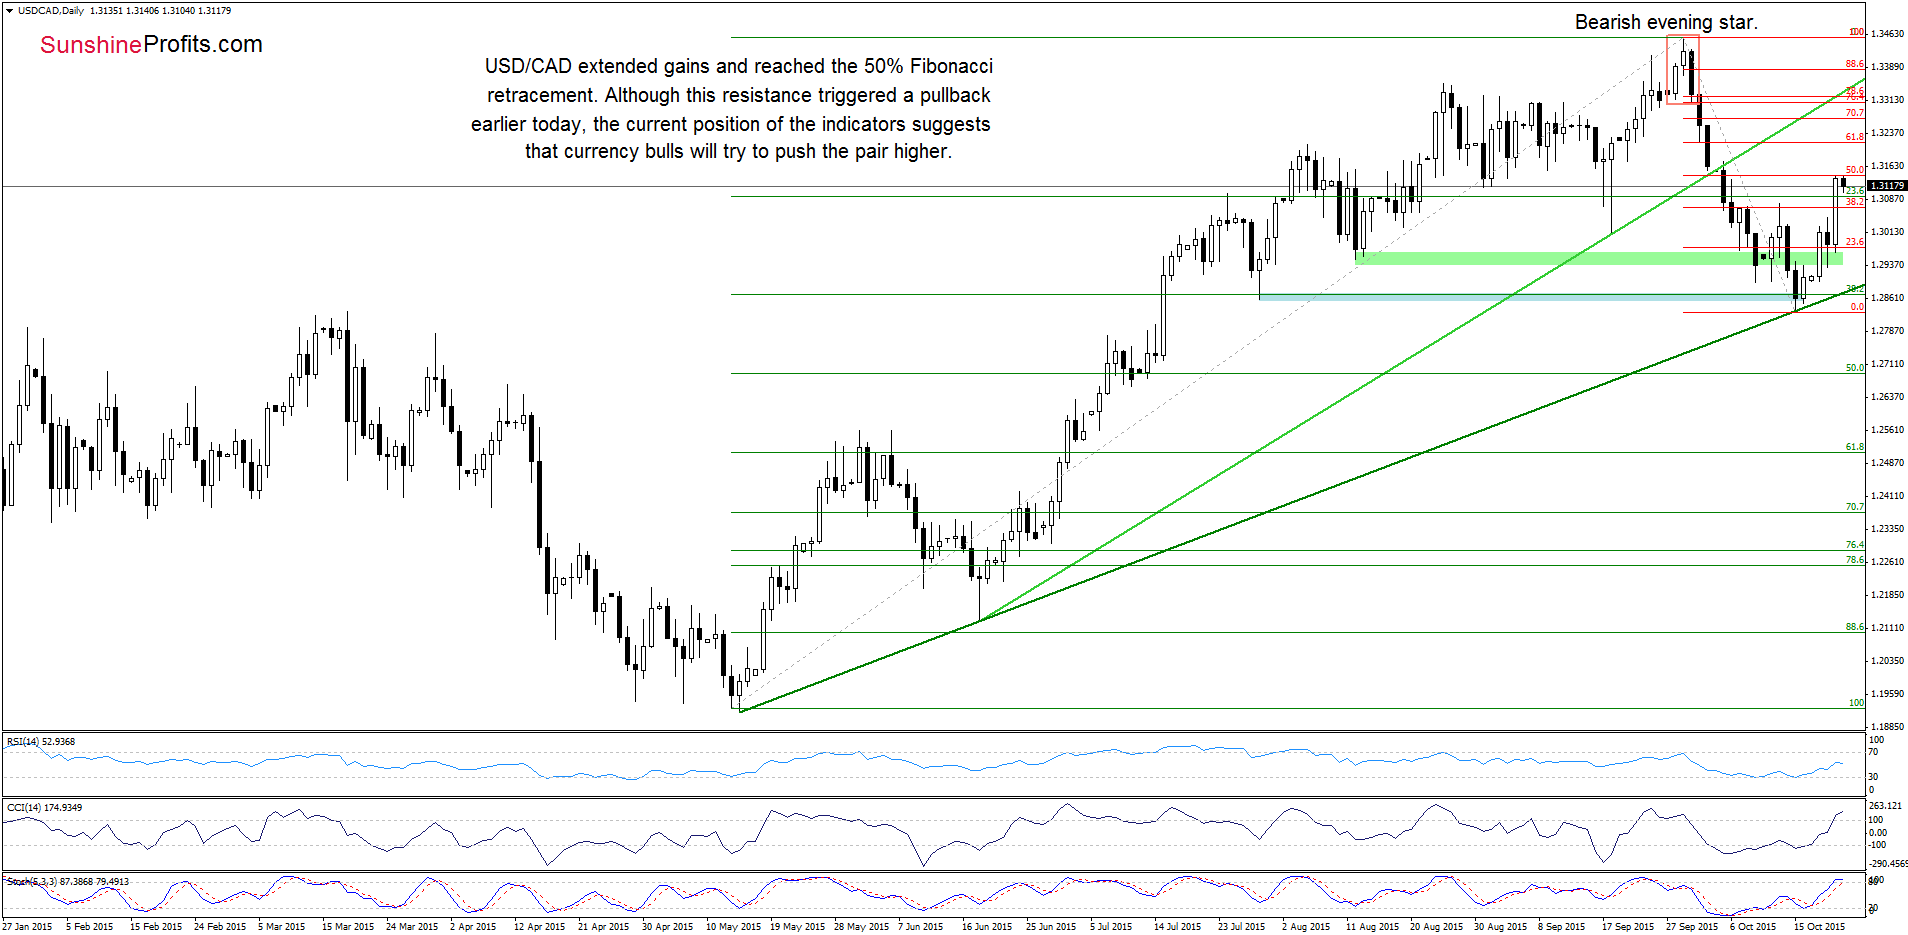
(…) currency bulls managed to invalidate the breakdown under the green zone, which suggests an increase to around 1.3078, where the last Tuesday high is (especially when we factor in buy signals generated by the indicators).
As you see on the daily chart, currency bulls not only took the pair to our initial upside target, but also managed to push the pair to the 50% Fibonacci retracement. Although this resistance level triggered a small pullback earlier today, the current position of the indicators in combination with the medium-term picture suggests that another attempt to move higher should not surprise us. If this is the case and the exchange rate moves higher, the next target for currency bulls would be around 1.3216, where the 61.8% Fibonacci retracement is.
Very short-term outlook: mixed with bullish bias
Short-term outlook: mixed
MT outlook: mixed
LT outlook: mixed
Trading position (short-term; our opinion): No positions are justified from the risk/reward perspective at the moment. We will keep you informed should anything change, or should we see a confirmation/invalidation of the above.
Thank you.
Nadia Simmons
Forex & Oil Trading Strategist
Przemyslaw Radomski, CFA
Founder, Editor-in-chief
Gold & Silver Trading Alerts
Forex Trading Alerts
Oil Investment Updates
Oil Trading Alerts
