

Forex Trading Alert originally sent to subscribers on September 29, 2015, 9:44 AM.
Earlier today, the USD Index erased some of yesterday’s losses as growing concerns over China's economy weighed on investors’ sentiment. As a result, the USD/CAD pair climbed to a fresh 2015 high. Where the exchange rate could climb in the coming days?
In our opinion the following forex trading positions are justified - summary:
- EUR/USD: short (a stop-loss order at 1.1887; the downside target around 1.0938)
- GBP/USD: none
- USD/JPY: none
- USD/CAD: none
- USD/CHF: none
- AUD/USD: none
EUR/USD
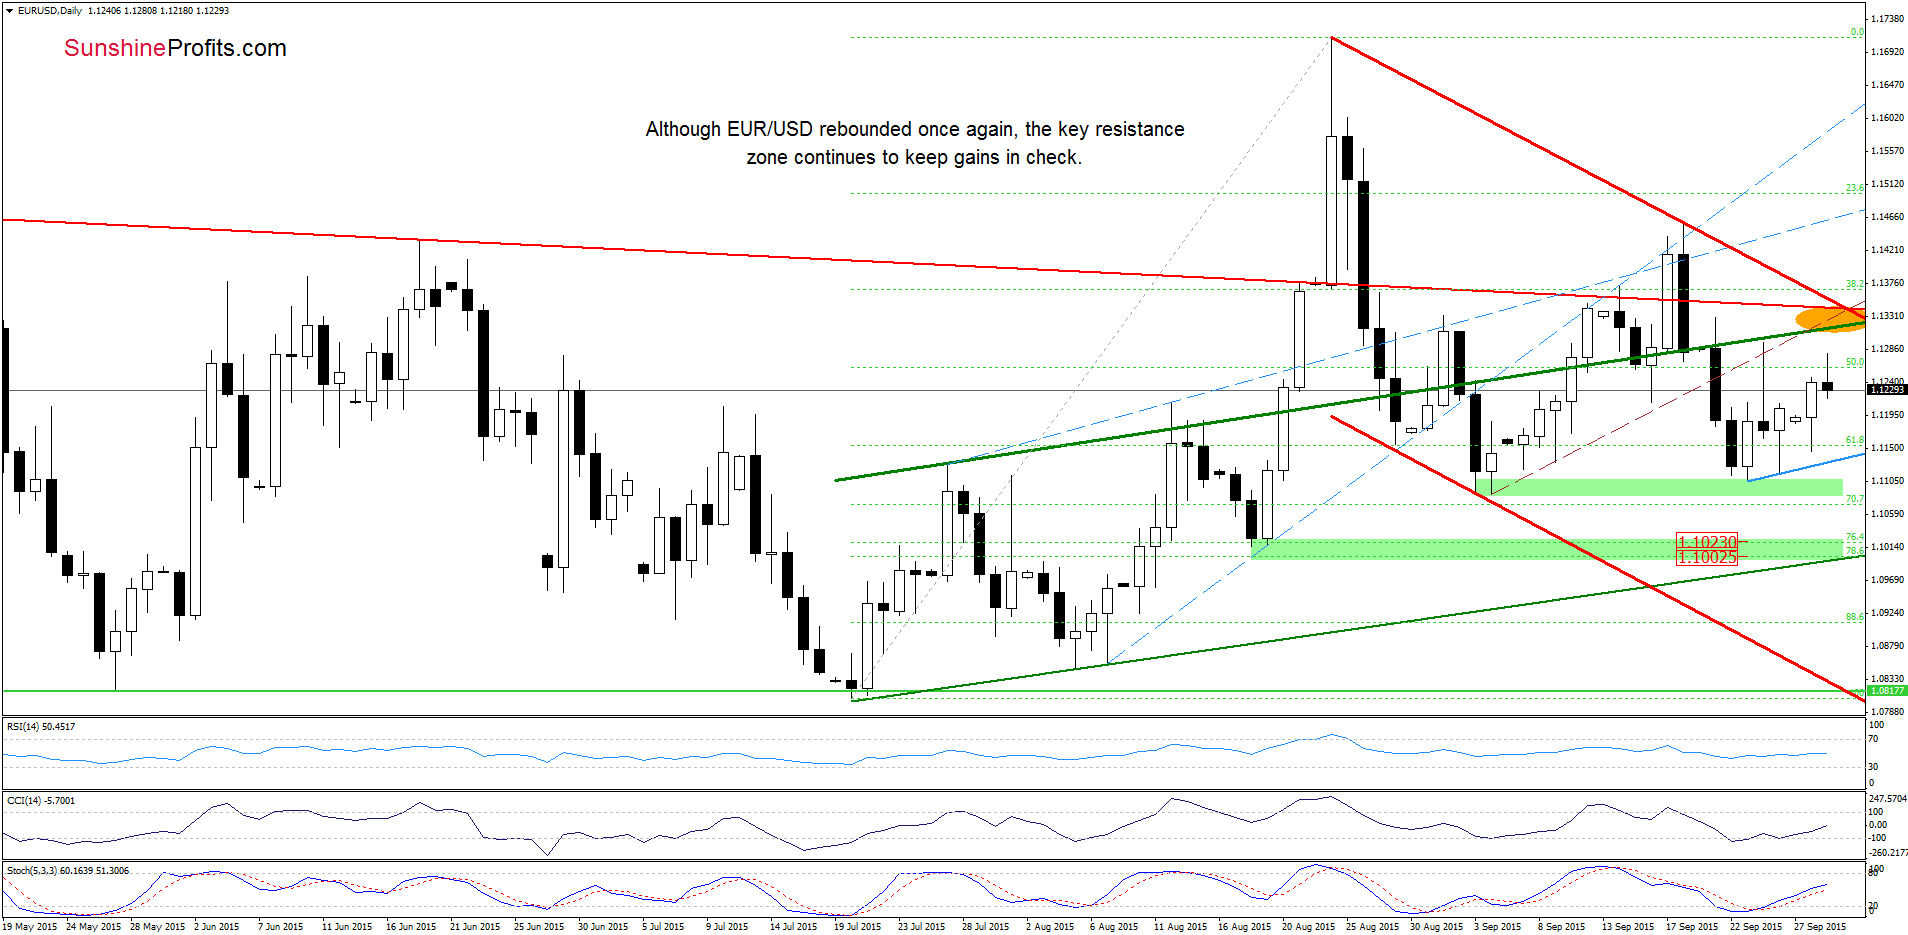
Looking at the daily chart, we see that EUR/USD moved higher and climbed to an intraday high of 1.1280 earlier today. Despite this improvement, the proximity to the key resistance orange zone (created by the previously-broken green, brown and red resistance lines) encouraged currency bears to act, which resulted in a pullback.
What impact did this price action have on the medium-term picture?
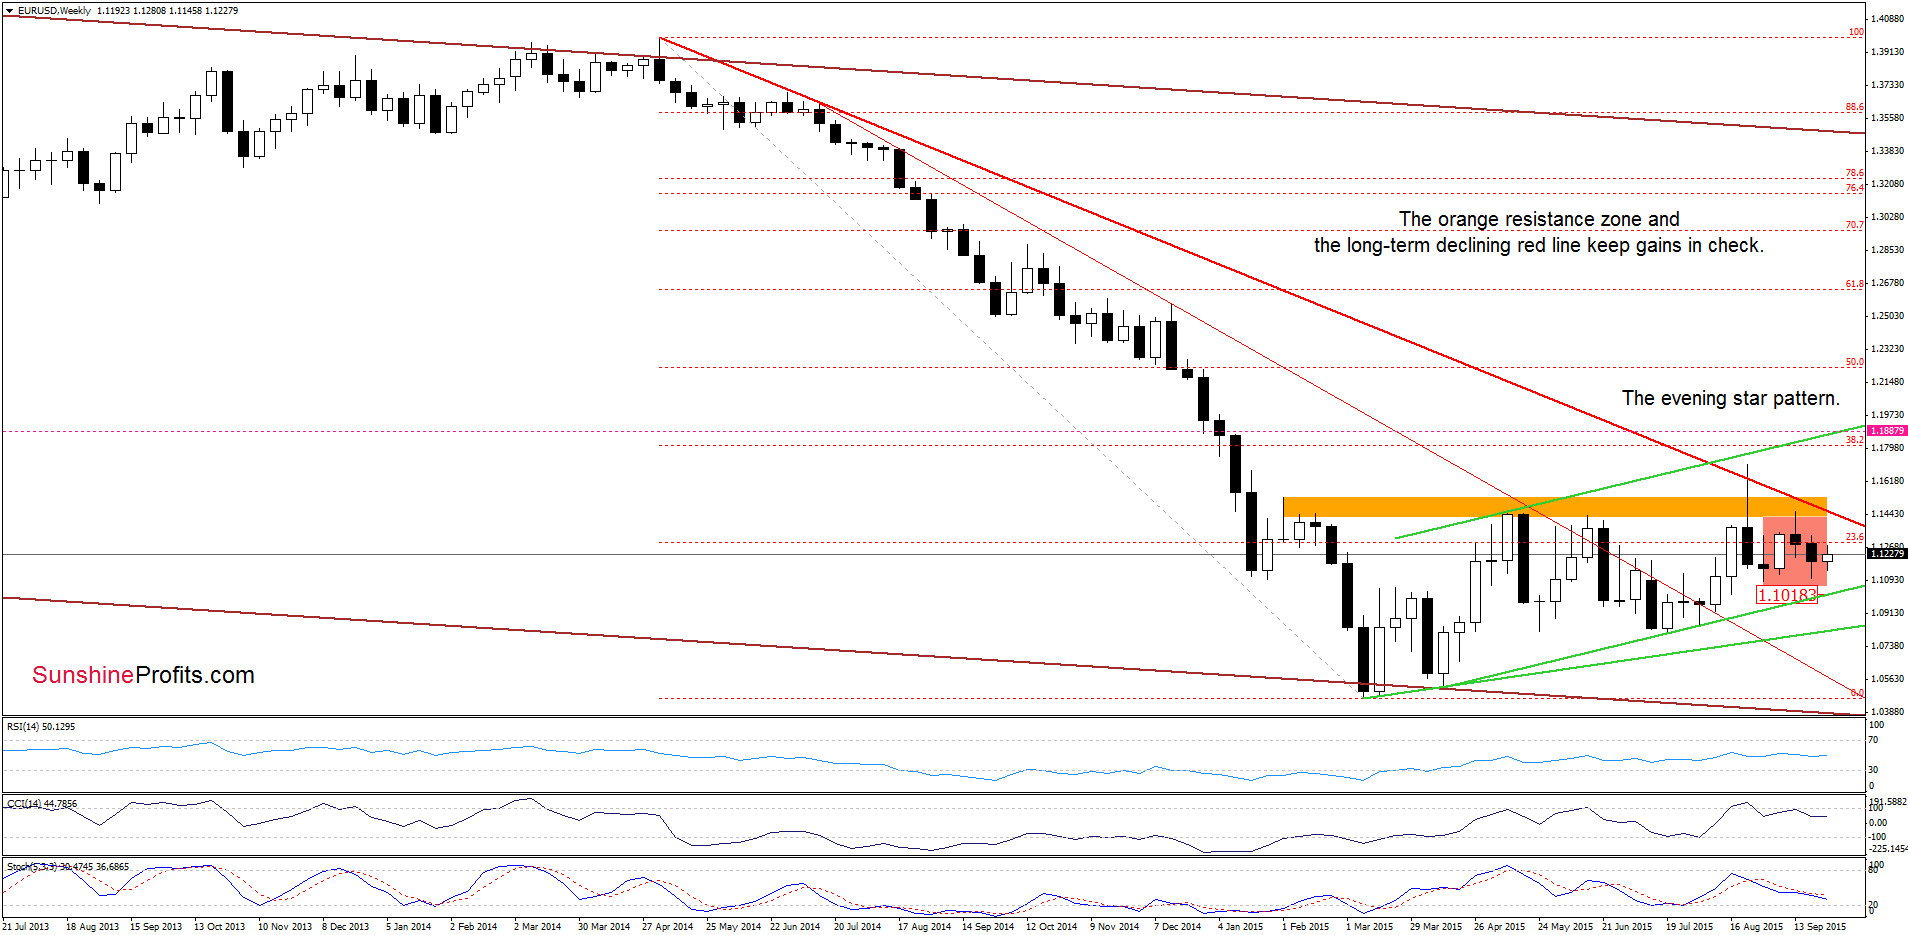
Not big. Although EUR/USD increased slightly, the exchange rate is still trading well below the orange resistance zone and the red declining resistance line, which are currently reinforced by the bearish candlesticks formation (the evening star). Additionally, sell signals generated by the indicators remain in place, suggesting further deterioration. Taking all the above into account, we think that the pair will extend losses in the coming day(s) and we’ll see a test of the blue support line marked on the daily chart (currently around 1.1132). If it is broken, the next downside target would be the green support zone or even the barrier of 1.100, where the next green support zone (based on the 76.4% and 78.6% Fibonacci retracement levels) is.
Very short-term outlook: bearish
Short-term outlook: bearish
MT outlook: mixed with bearish bias
LT outlook: mixed
Trading position (short-term; our opinion): Short positions with a stop-loss order at 1.1887 are justified from the risk/reward perspective. We will keep you informed should anything change, or should we see a confirmation/invalidation of the above.
GBP/USD
In our previous commentary, we wrote the following:
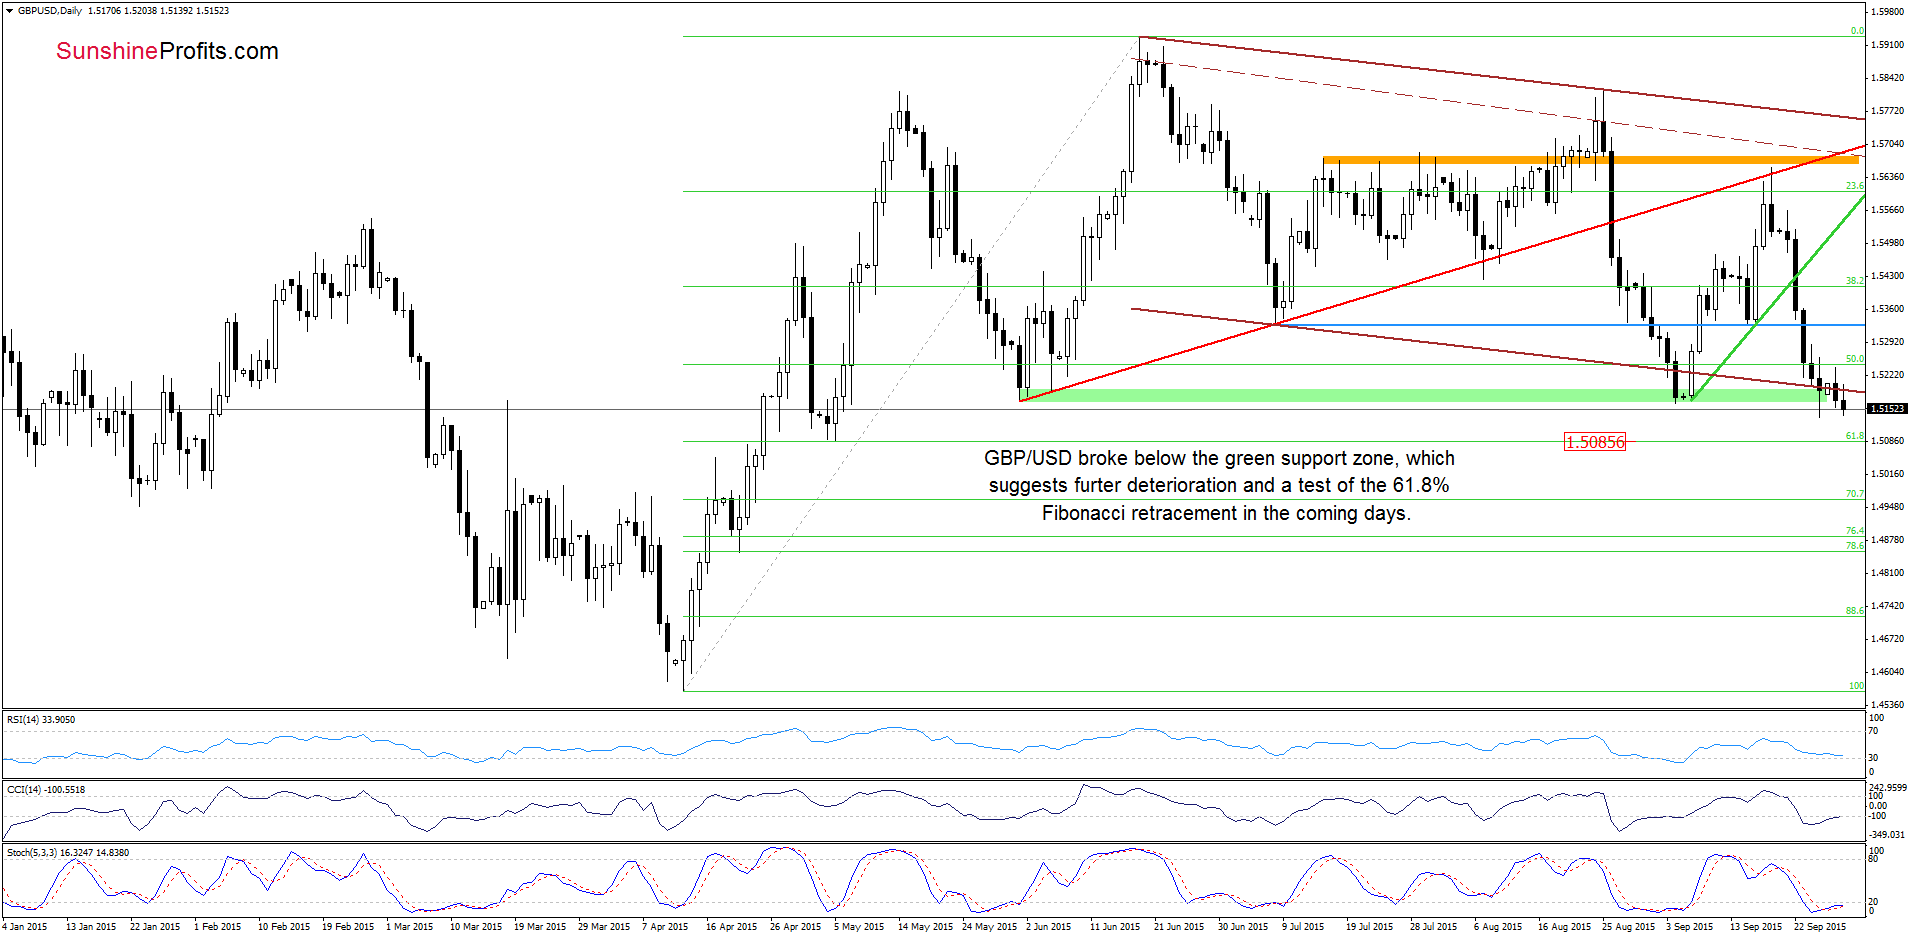
(…) the exchange rate erased almost all Sep rally, approaching the green support zone. As you see on the chart, in this area is also the lower border of the declining brown channel, which could encourage currency bulls to act. Nevertheless, taking into account that there are no buy signals at the moment, another attempt to move lower can’t be ruled out.
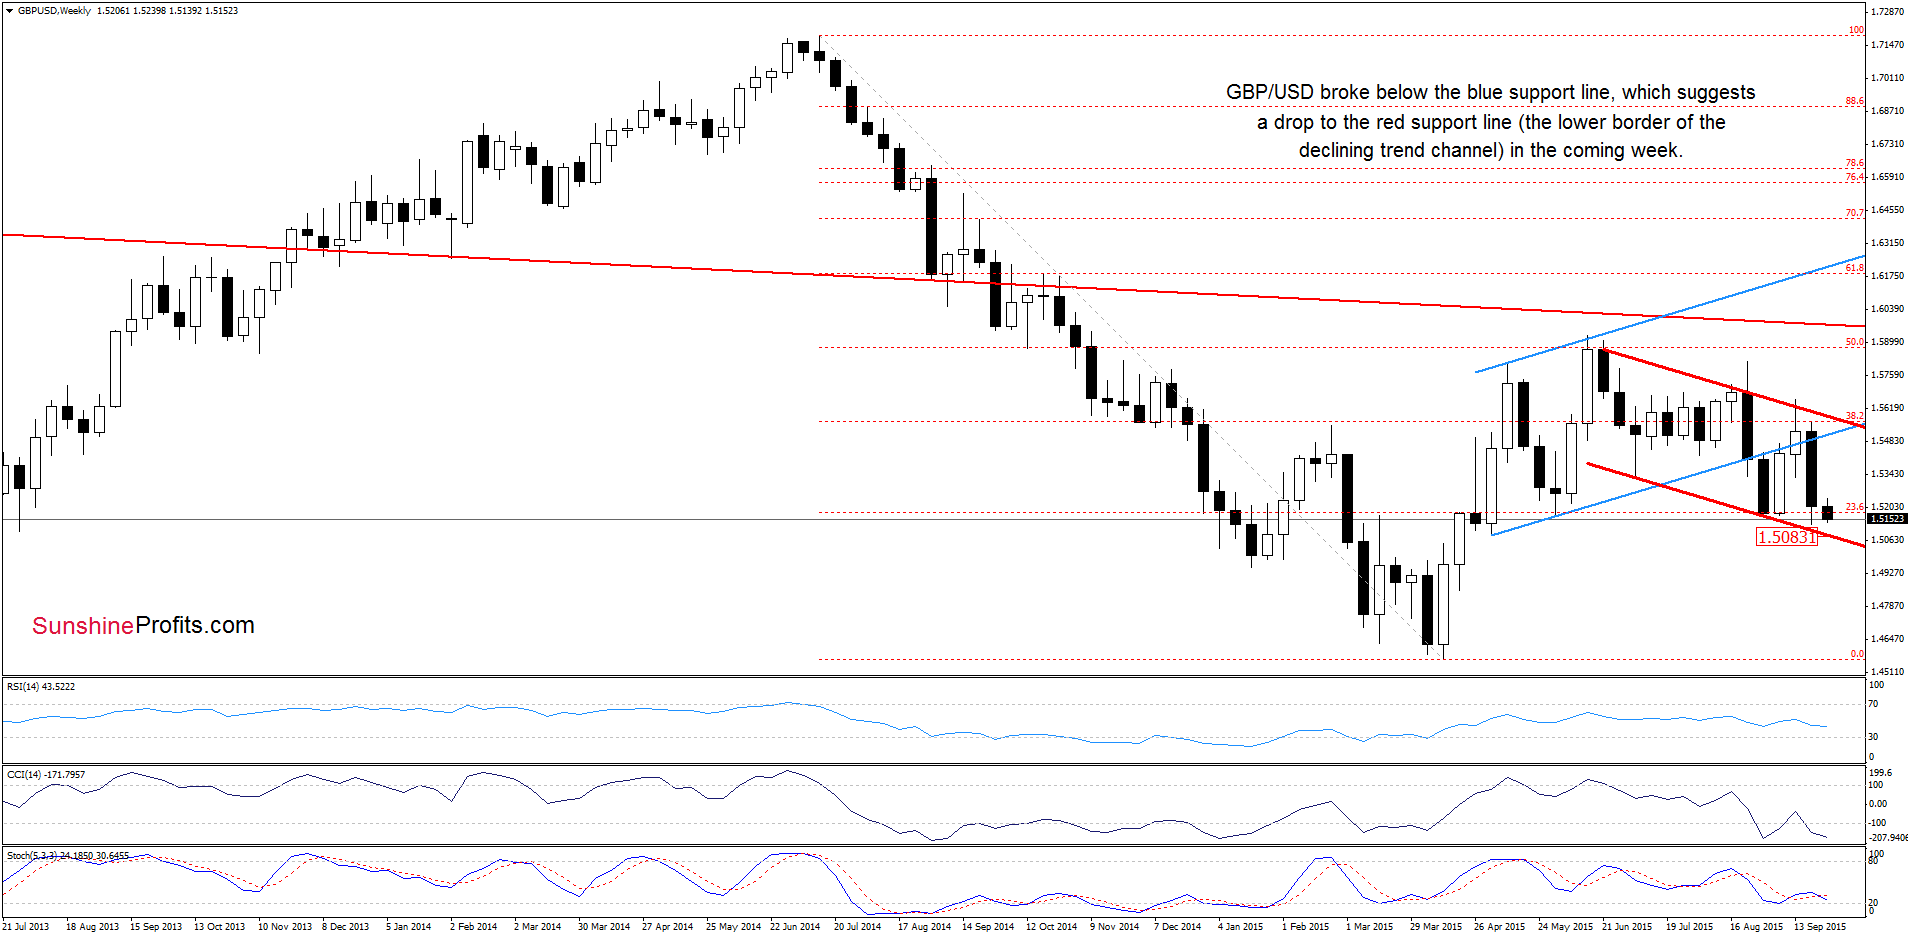
As you see on the daily chart, currency bears pushed GBP/USD lower as we had expected. With this downward move, the pair broke not only below the lower border of the declining brown channel, but also under the green support zone. This is a bearish signal, which suggests further deterioration and a test of the 61.8% Fibonacci retracement in the coming days. At this point, it is worth noting that slightly above this support level is also the lower border of the red declining trend channel (marked on the weekly chart below), which reinforces this area and could encourage currency bulls to act later this week.
Very short-term outlook: bearish
Short-term outlook: mixed with bearish bias
MT outlook: mixed with bearish bias
LT outlook: mixed
Trading position (short-term; our opinion): No positions are justified from the risk/reward perspective at the moment. We will keep you informed should anything change, or should we see a confirmation/invalidation of the above.
USD/CAD
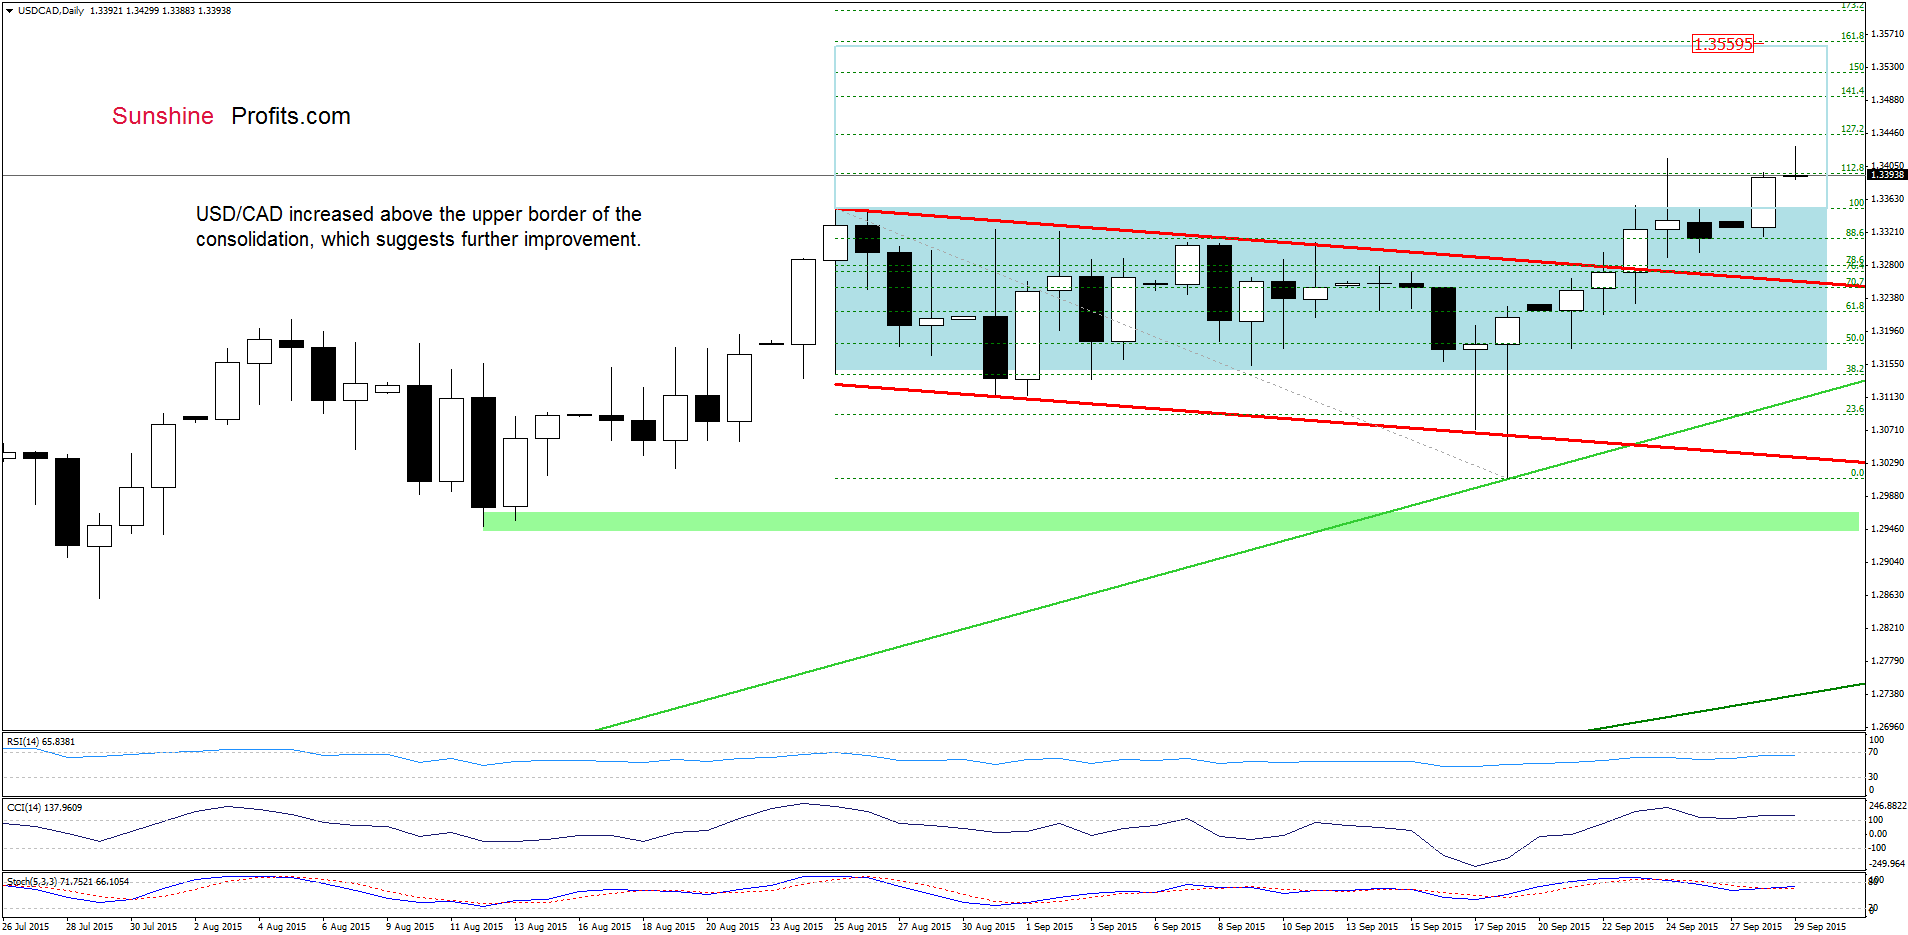
Looking at the daily chart, we see that USD/CAD broke above the upper border of the consolidation once again, hitting a fresh 2015 high, which is a positive signal that suggests further improvement. How high could the pair go? In our opinion, the initial upside target would be around 1.3445, where the 127.2% Fibonacci extension is. If it is broken, we may see an increase to 1.3492 (141.4% Fibonacci extension), 1.3523 (150% extension) or even to 1.3559, where the 161.8% extension is. It is also worth noting that in this area the size of the upward move will correspond to the height of the formation.
But will we see such improvement? Let’s take a closer look at the weekly chart and find out where the nearest medium-term resistance is.
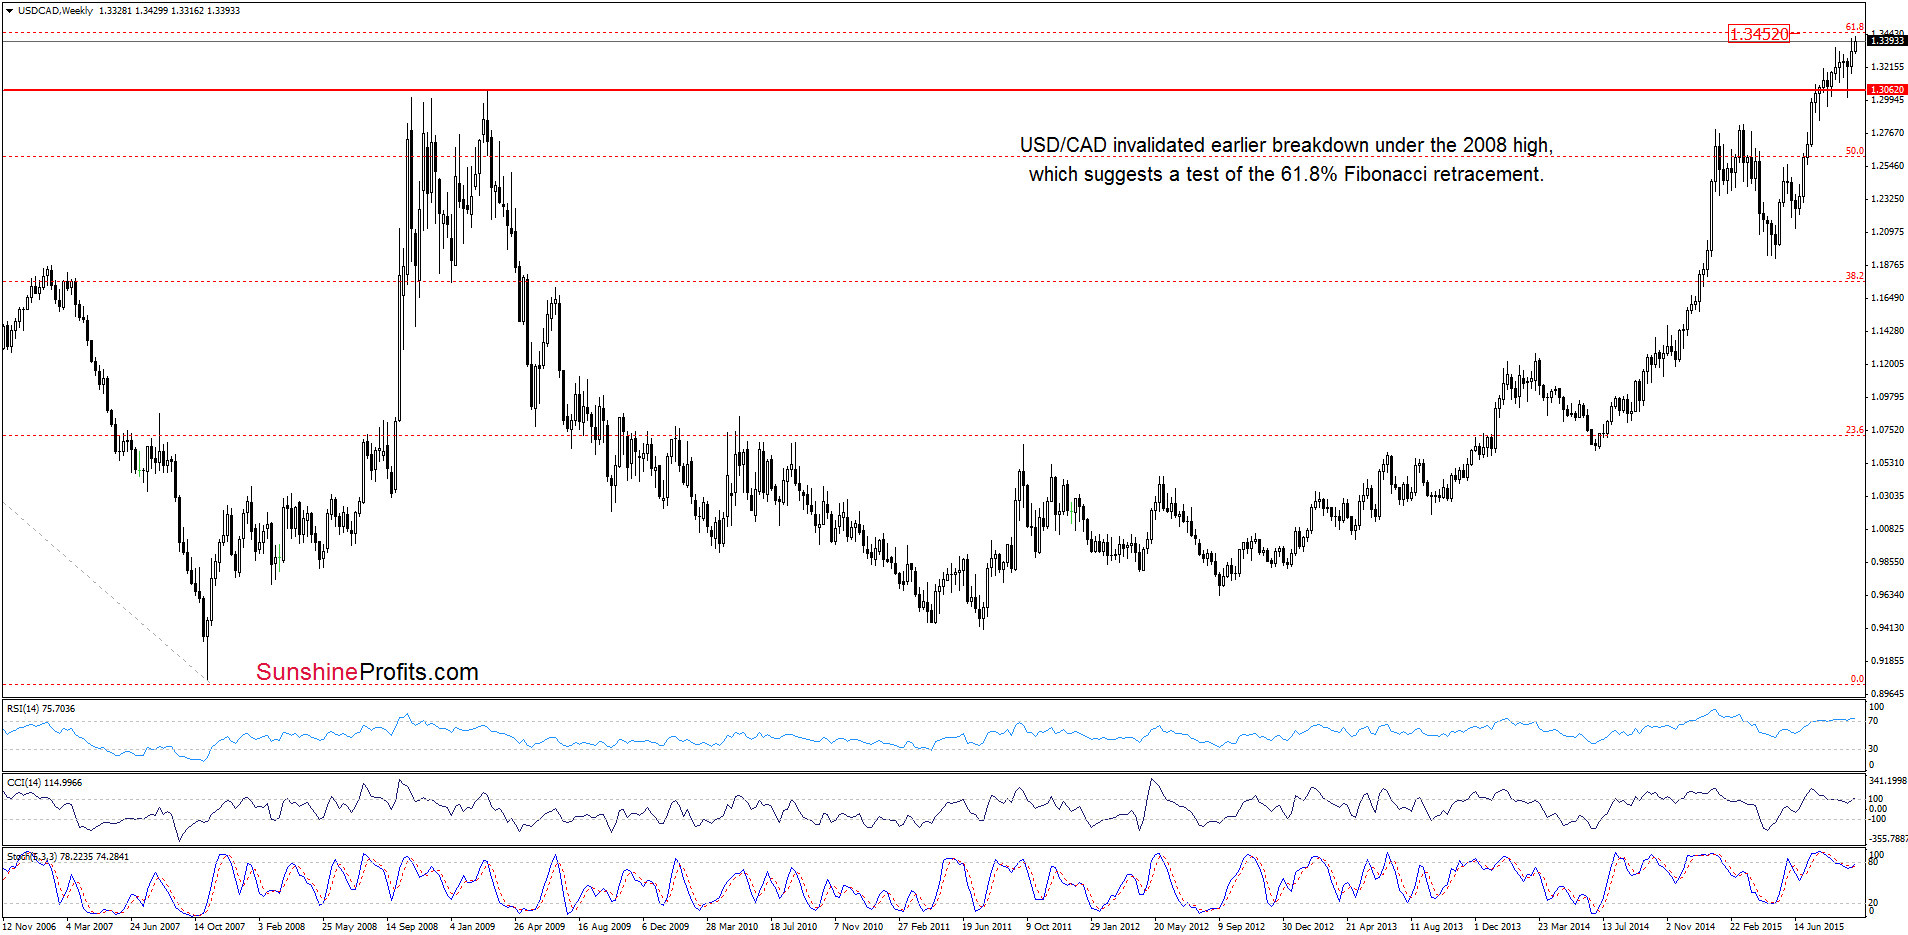
From this perspective, we see that the initial upside target for currency bulls would be around 1.3452, where the 61.8% Fibonacci retracement is (at 1.3444 is also the 127.2% Fibonacci extension based on the Aug-Sep decline). Nevertheless, we should keep in mind that the position of the indicators suggests that reversal is just around the corner.
Very short-term outlook: mixed with bullish bias
Short-term outlook: mixed
MT outlook: mixed
LT outlook: mixed
Trading position (short-term; our opinion): No positions are justified from the risk/reward perspective at the moment. We will keep you informed should anything change, or should we see a confirmation/invalidation of the above.
Thank you.
Nadia Simmons
Forex & Oil Trading Strategist
Przemyslaw Radomski, CFA
Founder, Editor-in-chief
Gold & Silver Trading Alerts
Forex Trading Alerts
Oil Investment Updates
Oil Trading Alerts
