

Forex Trading Alert originally sent to subscribers on September 17, 2015, 9:35 AM.
Earlier today, the Swiss National Bank kept interest rates at record lows (-0.75%) and the target range for the three-month Libor unchanged at between -1.25% and -0.25%. In these circumstances USD/CHF moved lower and broke below the lower line of the consolidation. Is it enough to trigger another sizable decline?
In our opinion the following forex trading positions are justified - summary:
- EUR/USD: short (a stop-loss order at 1.1445; the downside target around 1.0938)
- GBP/USD: none
- USD/JPY: none
- USD/CAD: none
- USD/CHF: none
- AUD/USD: none
EUR/USD
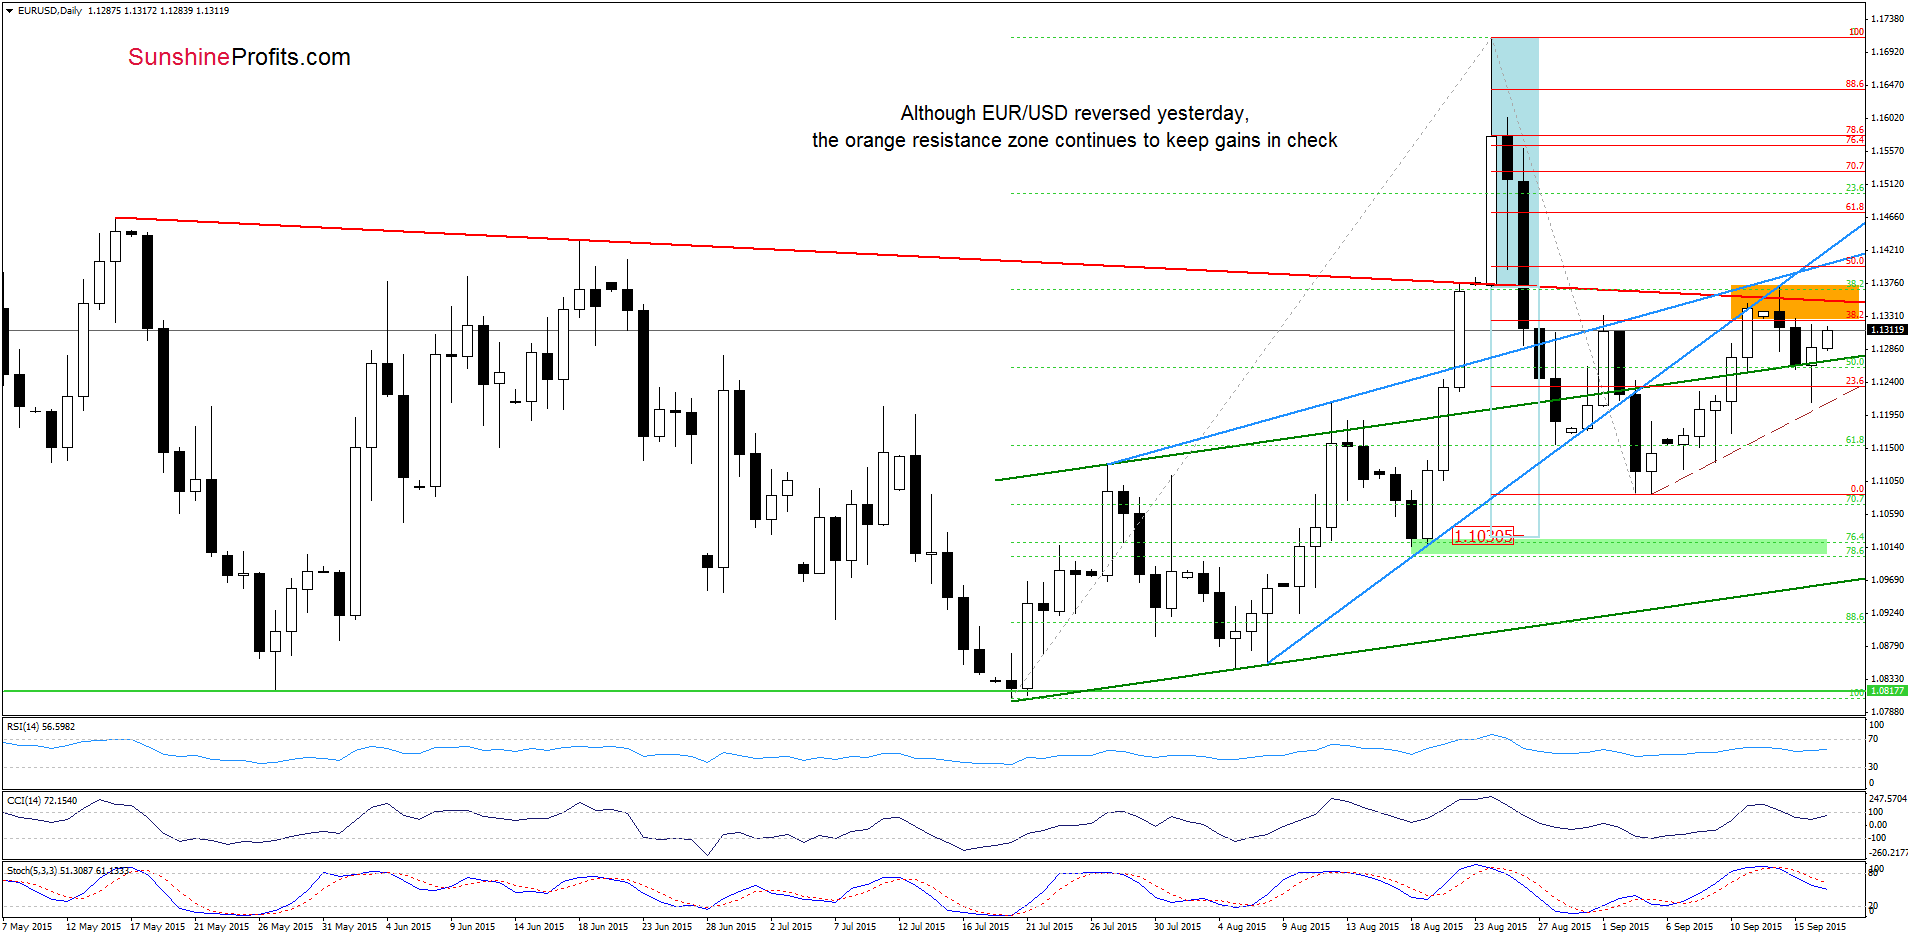
Although EUR/USD declined below the green support line yesterday, the proximity to the brown dashed support line encouraged currency bulls to act. As a result, the pair reversed and invalidated earlier breakdown, which triggered further improvement earlier today. Despite this move, the exchange rate is trading under the orange resistance zone (created currently by the red declining line and the 38.2% Fibonacci retracement), which means that as long as there is no breakout above it further rally is questionable. Additionally, sell signals generated by the indicators remain in place, supporting currency bears at the moment.
Did this increase change anything in the medium-term picture?
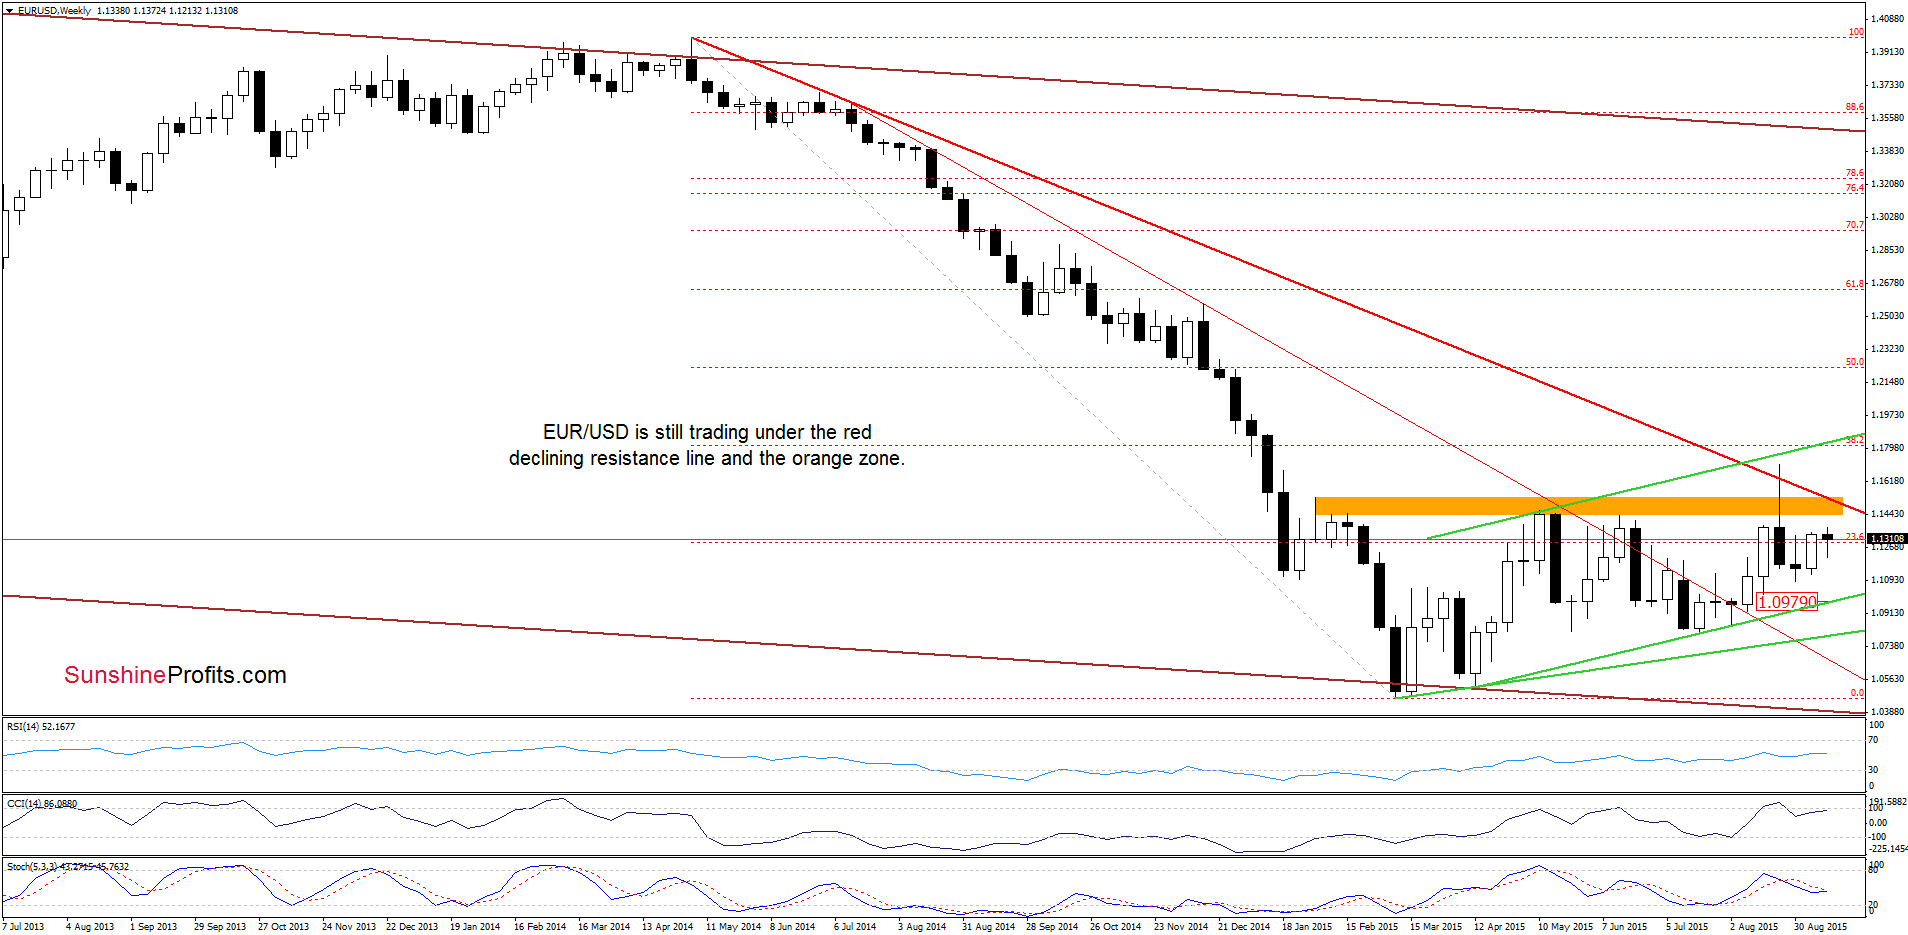
Not really, because from this perspective, we see that although EUR/USD increased, the exchange rate remains under the long-term red resistance line and the orange resistance zone. Therefore, we believe that as long as this area is in play, a sizable rally is not likely to be seen.
Very short-term outlook: bearish
Short-term outlook: bearish
MT outlook: mixed with bearish bias
LT outlook: mixed
Trading position (short-term; our opinion): Short positions with a stop-loss order at 1.1445 are justified from the risk/reward perspective. The downside target around 1.0938. We will keep you informed should anything change, or should we see a confirmation/invalidation of the above.
USD/CAD
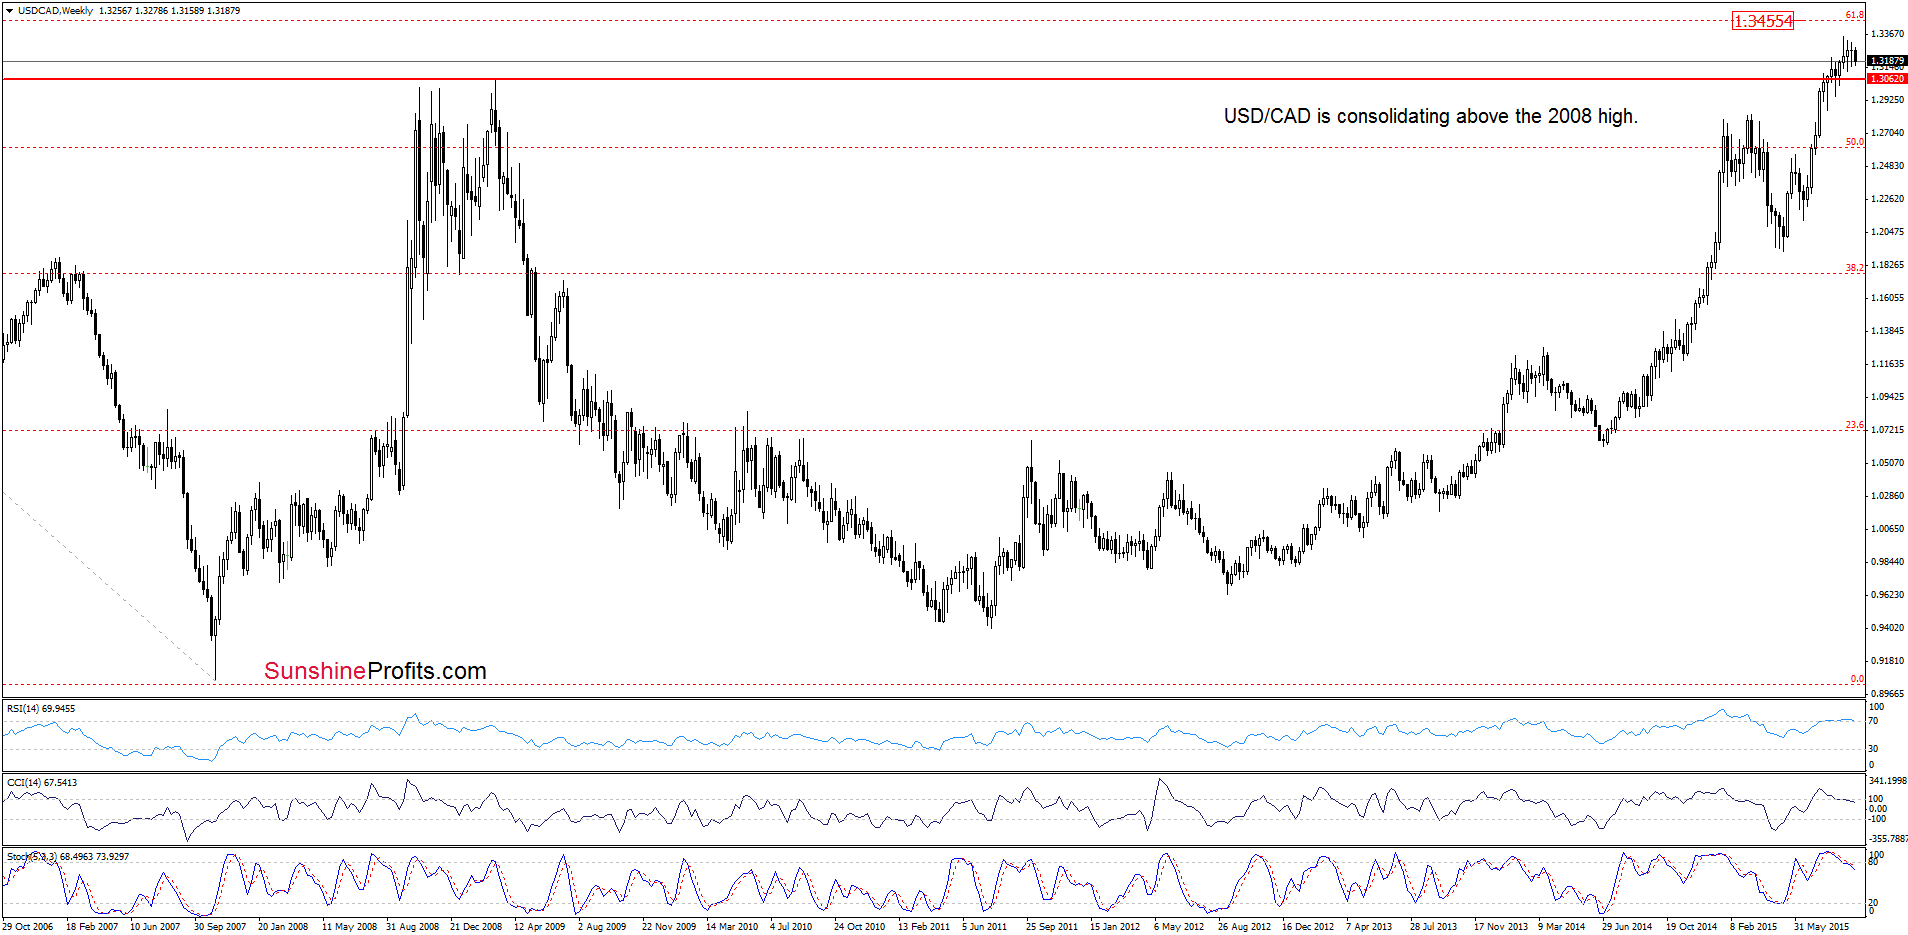
The medium-term picture hasn’t changed much as USD/CAD is trading above the 2008 high.
Can we infer something more from the daily chart? Let’s check.
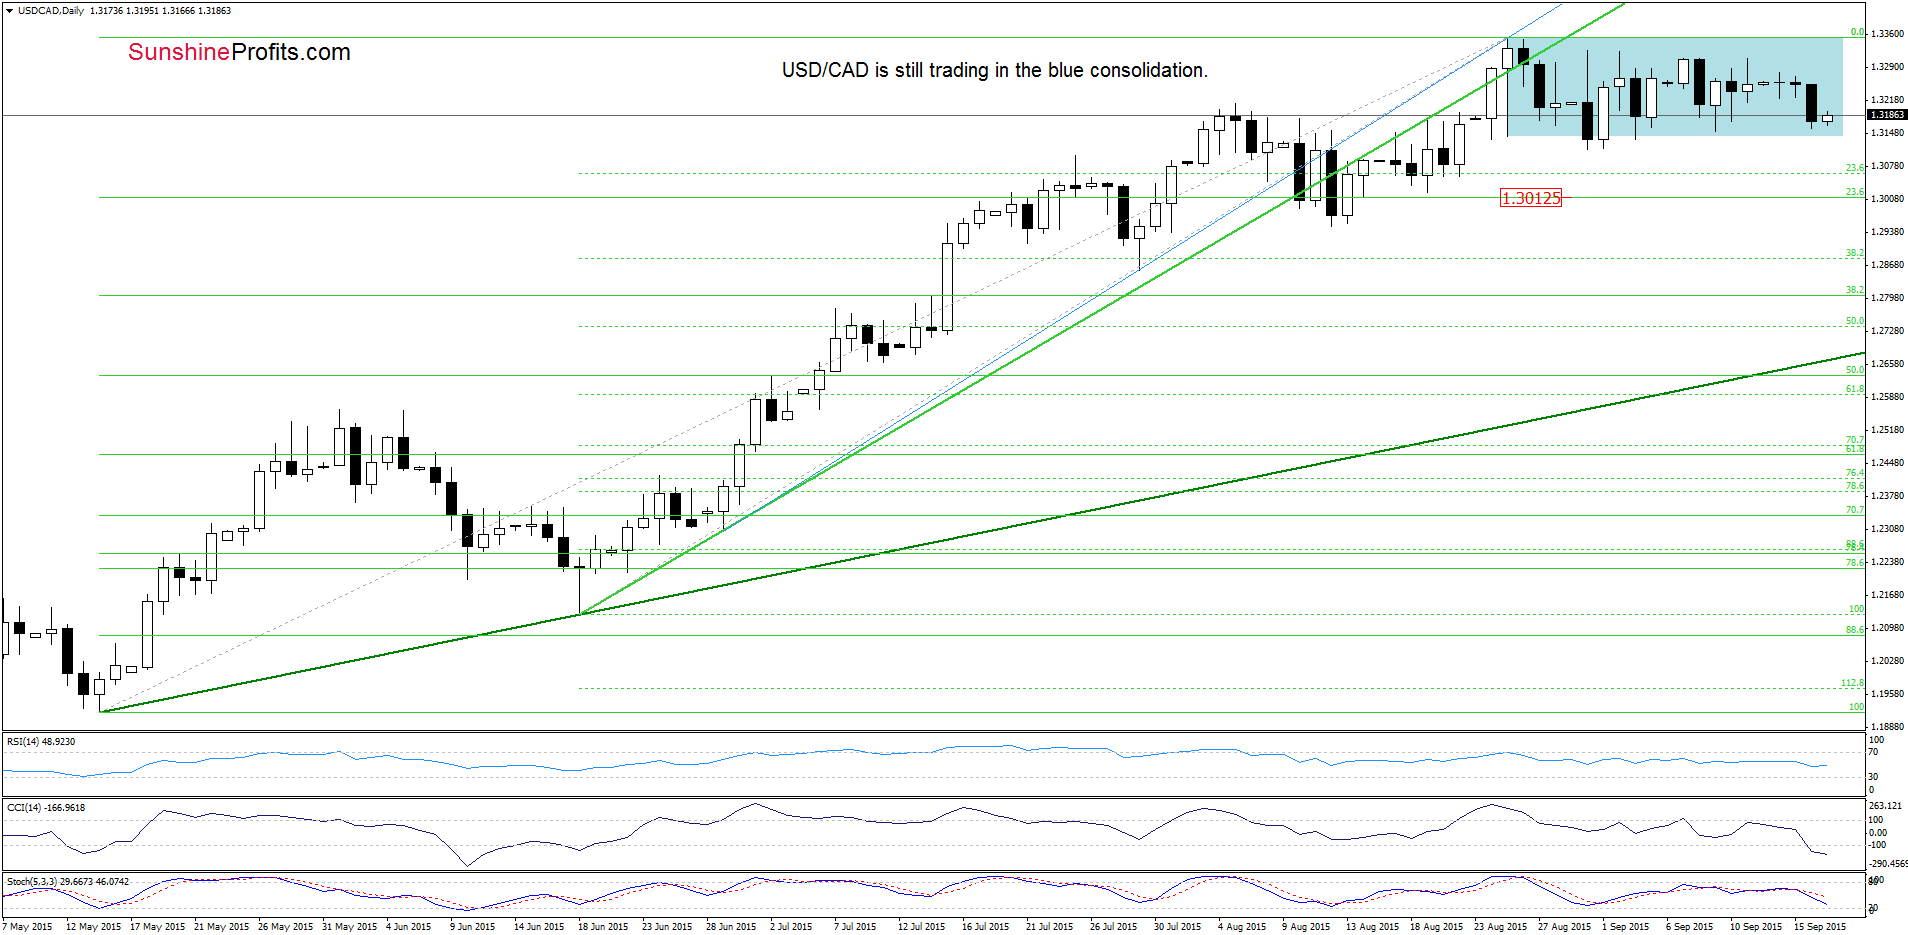
From today’s point of view, we see that the overall situation in the short-term also hasn’t changed much as USD/CAD is still trading in the blue consolidation. Therefore, what we wrote in our alert posted on Sep 4 is up-to-date also today:
(…) we think that as long as there is no breakout above the upper line of the formation another test of the green resistance line is not likely to be seen. On the other hand, a sizable downward move is also questionable unless we see a daily closure below the lower border of the consolidation (in this case, the initial downside target would be around 1.2950-1.3015, where the bottom of the previous pullback and the 23.6% Fibonacci retracement based on the entire May-Aug rally are).
Very short-term outlook: mixed
Short-term outlook: mixed
MT outlook: mixed
LT outlook: mixed
Trading position (short-term; our opinion): No positions are justified from the risk/reward perspective at the moment. We will keep you informed should anything change, or should we see a confirmation/invalidation of the above.
USD/CHF
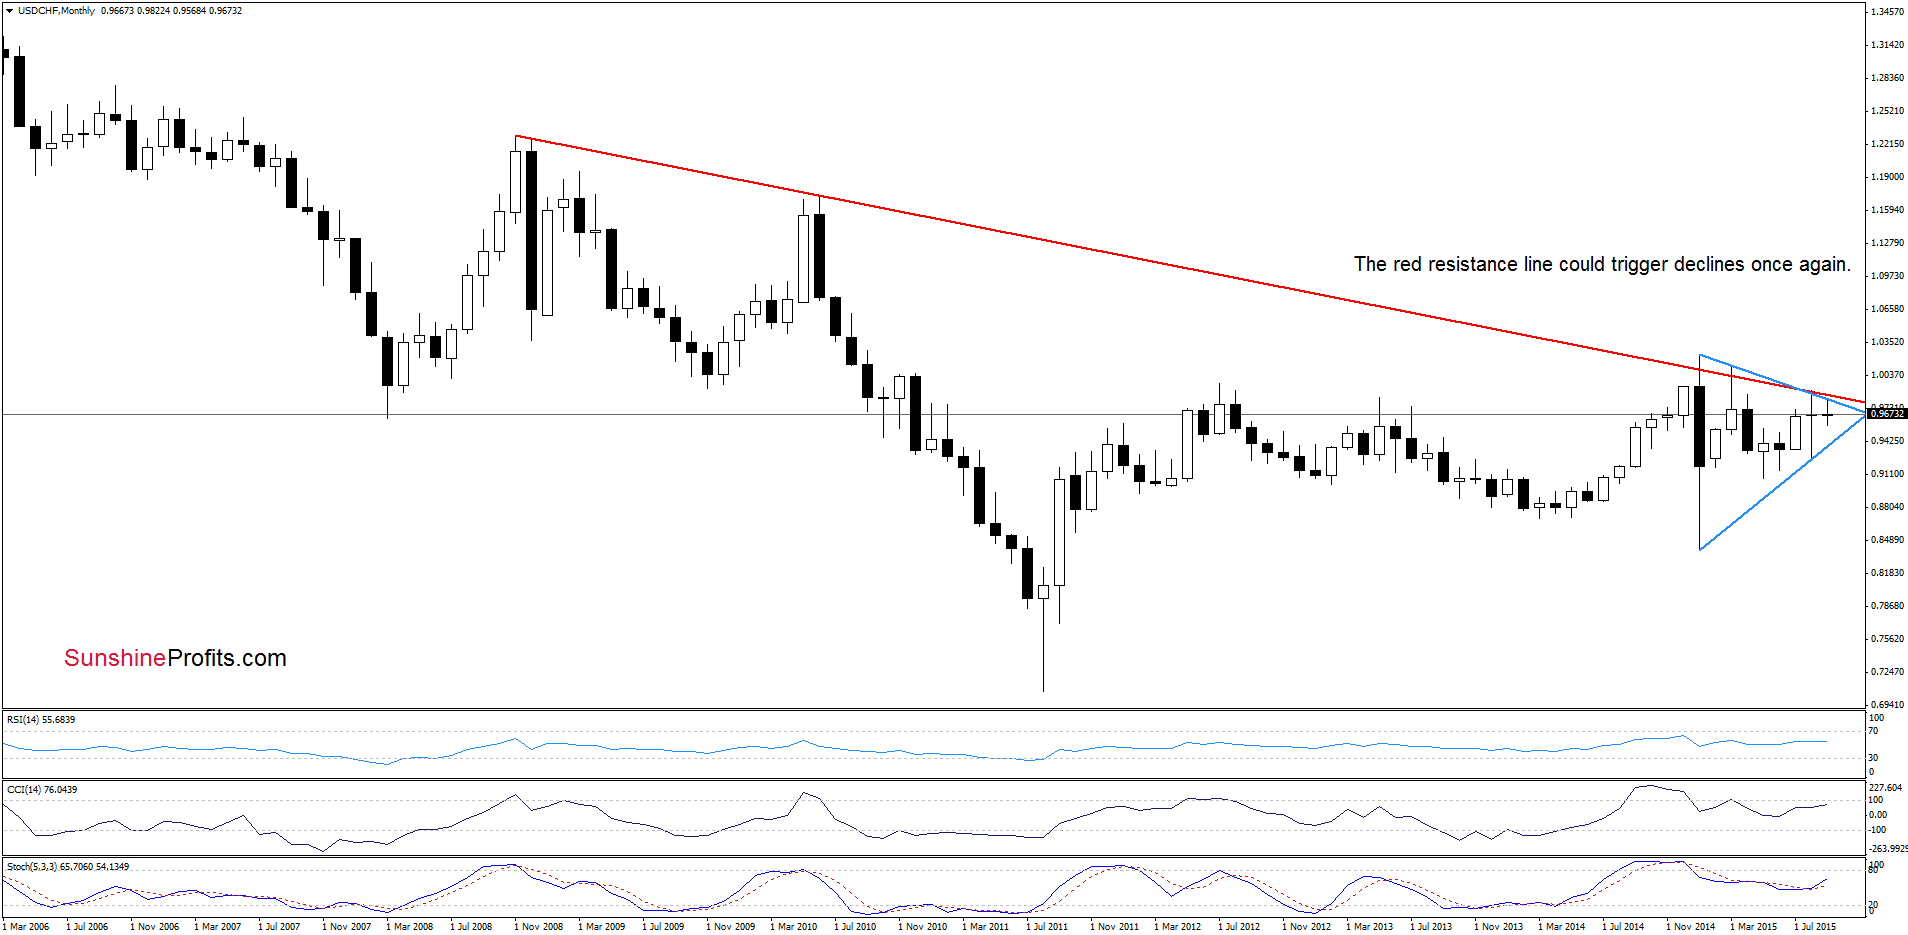
On the long-term chart, we see that USD/CHF is trading in a triangle, slightly below the red resistance line, which successfully stopped further improvement in Jan, Mar and also in Aug. Therefore, we think that similar price action in the coming week(s) should not surprise us.
Will the weekly chart give us more clues about future moves? Let’s check.
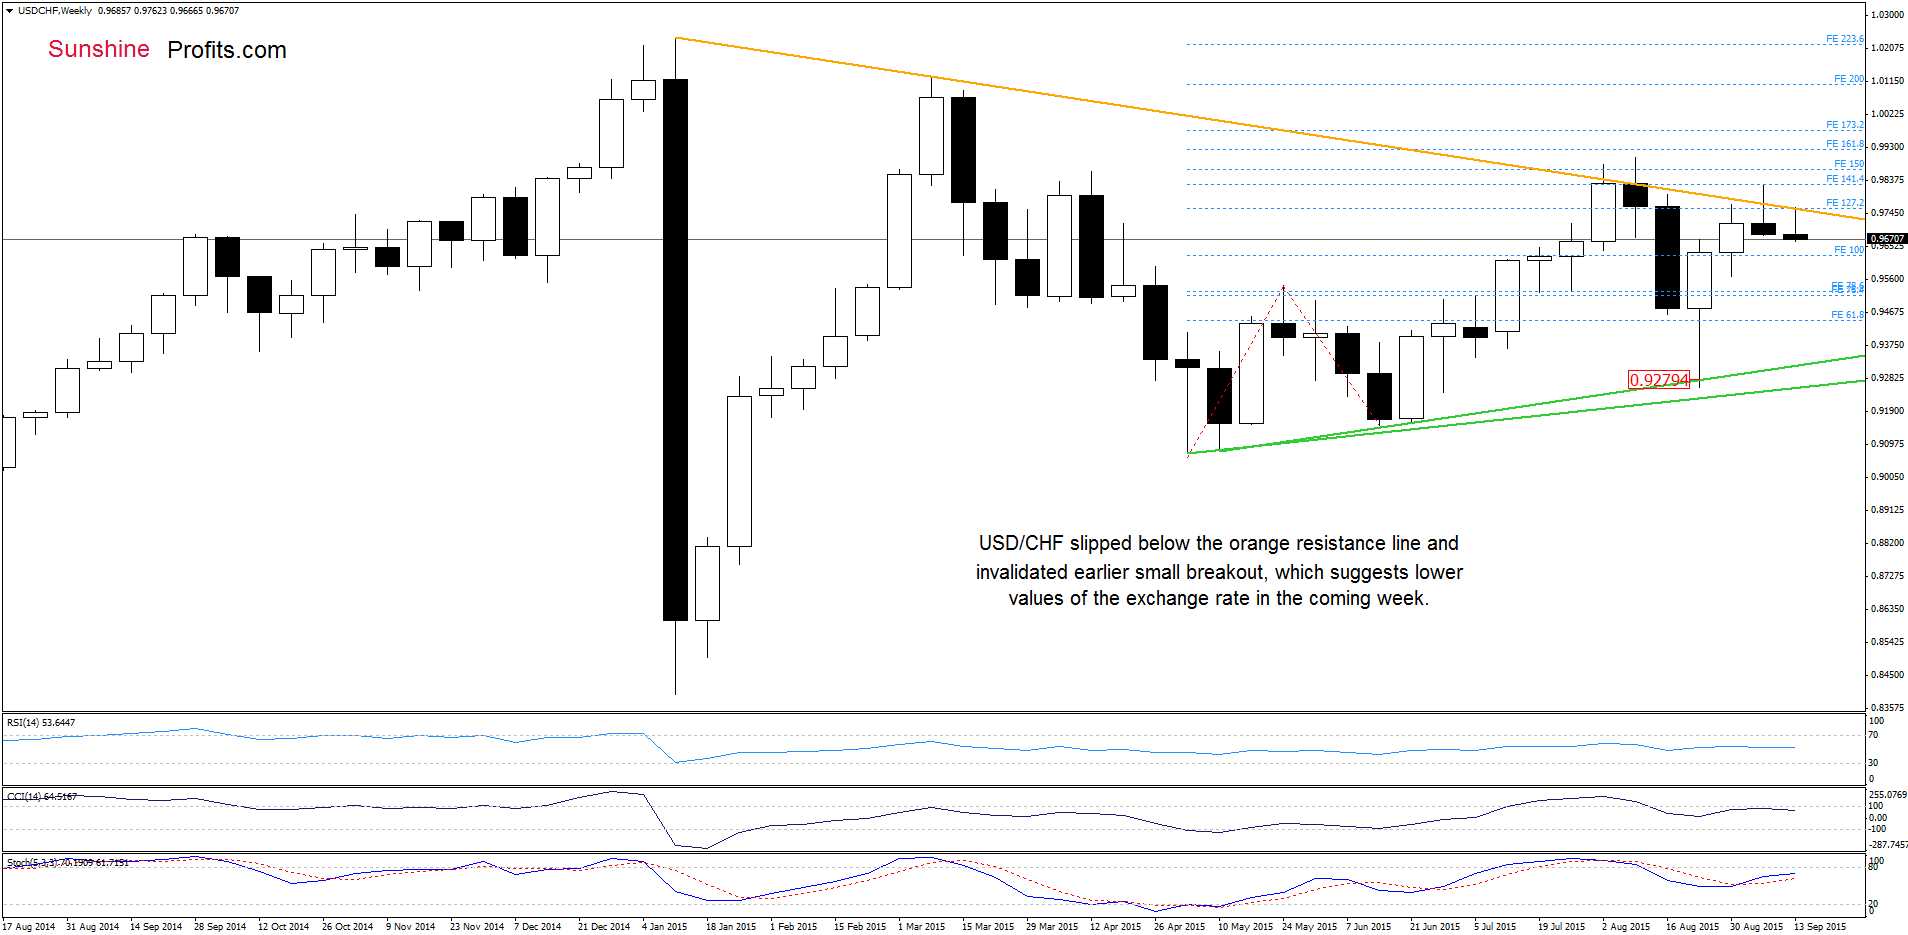
From this perspective we see that USD/CHF moved lower and invalidated earlier small breakout above the orange resistance line in the previous week. This week the key resistance line continues to keep gains in check, which suggests that lower values of the exchange rate are just around the corner. Why? When we take a closer look at the above chart, we notice that there was similar situation at the beginning of Aug. Back then, the orange resistance line encouraged currency bears to act, which resulted in a sharp decline. Taking this fact into account and the long-term picture, we think that history will repeat itself once again.
How low could the pair go in the coming days? Let’s examine the daily chart and find out.
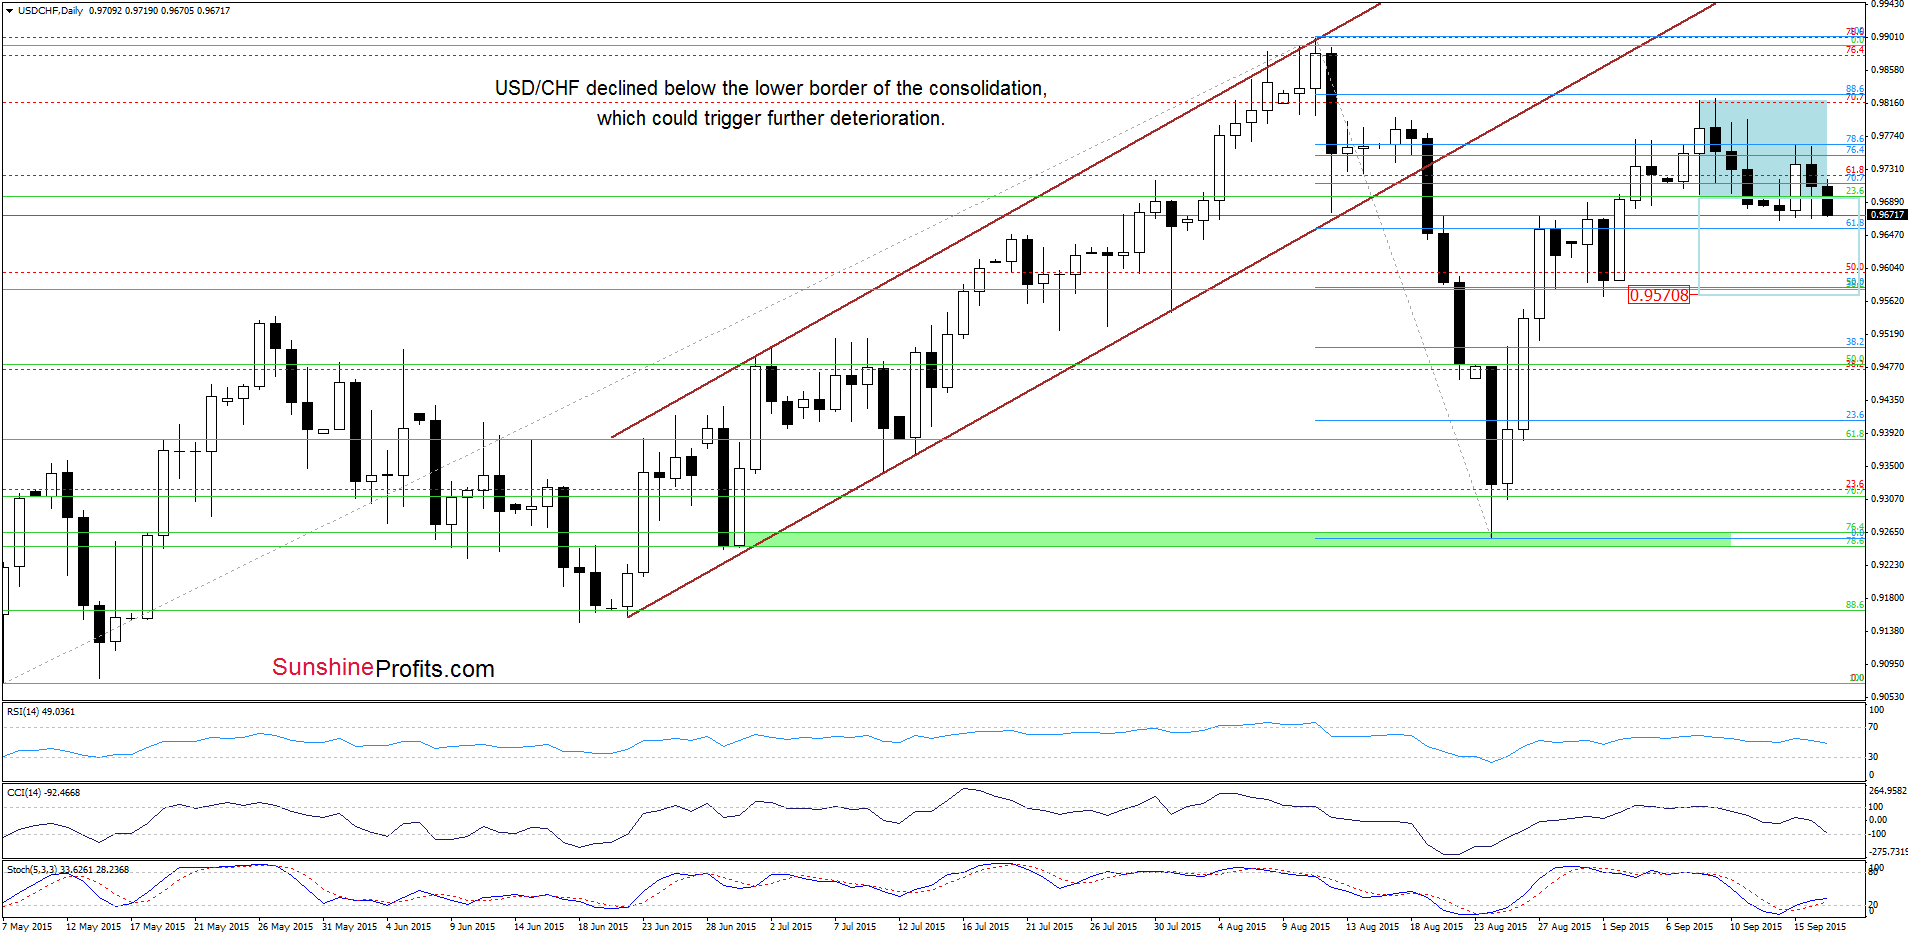
Looking at the daily chat, we see that USD/CHF broke below the lower border of the consolidation, which suggests further deterioration and a drop to around 0.9570, where the size of the downward move will correspond to the height of the formation and where the Sep low is. Nevertheless, this scenario will be more reliable if the pair closes the day under this week’s low of 0.9666.
Very short-term outlook: mixed with bearish bias
Short-term outlook: mixed
MT outlook: mixed
LT outlook: mixed
Trading position (short-term; our opinion): No positions are justified from the risk/reward perspective at the moment. We will keep you informed should anything change, or should we see a confirmation/invalidation of the above.
Thank you.
Nadia Simmons
Forex & Oil Trading Strategist
Forex Trading Alerts
Oil Investment Updates
Oil Trading Alerts
