

Forex Trading Alert originally sent to subscribers on September 3, 2015, 8:15 AM.
Yesterday, the euro moved sharply lower against the greenback as investors moved to the sidelines ahead of today’s meeting of European monetary policy officials. As a result, EUR/USD slipped to the key support lines. Where the exchange rate head next?
In our opinion the following forex trading positions are justified - summary:
- EUR/USD: short (a stop-loss order at 1.1445; the downside target around 1.0938)
- GBP/USD: none
- USD/JPY: none
- USD/CAD: none
- USD/CHF: none
- AUD/USD: none
EUR/USD
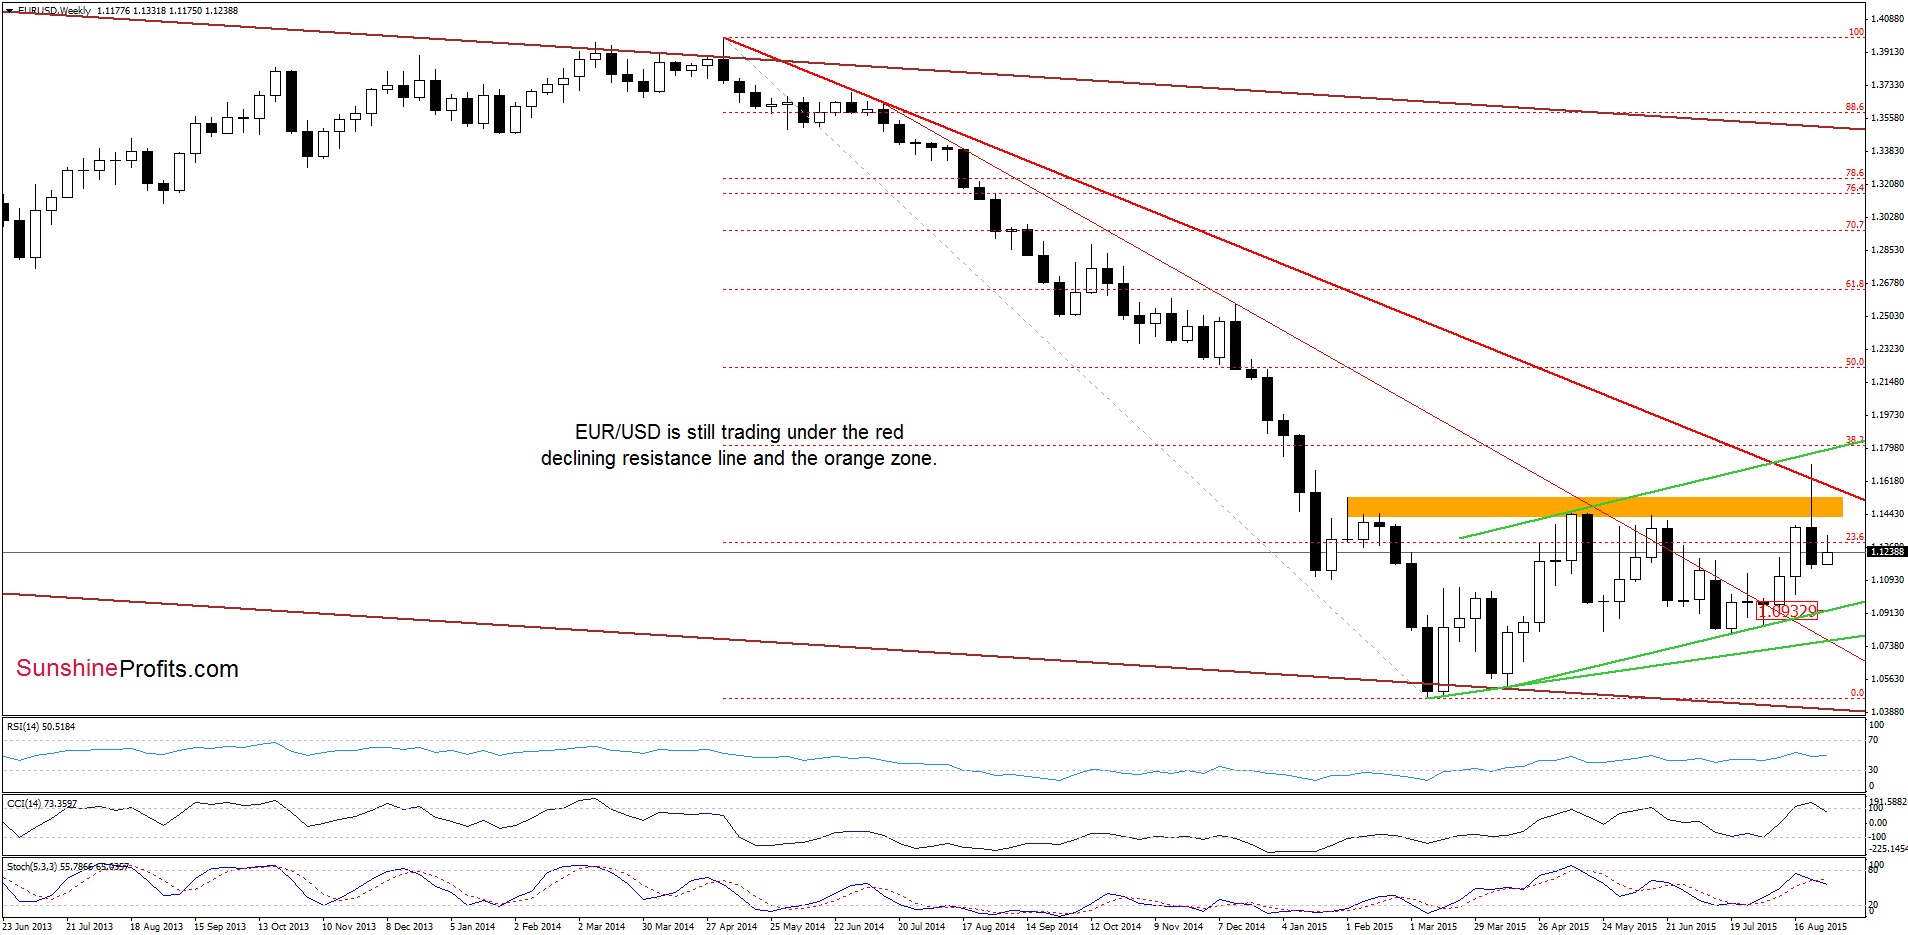
The situation in the medium-term hasn’t changed much as EUR/USD is still trading well below the long-term red line and the previously-broken orange resistance zone, which suggests lower values of the exchange rate in the coming week (especially when we factor in sell signals generated by the indicators).
Having said that, let’s focus on the very short-term picture.
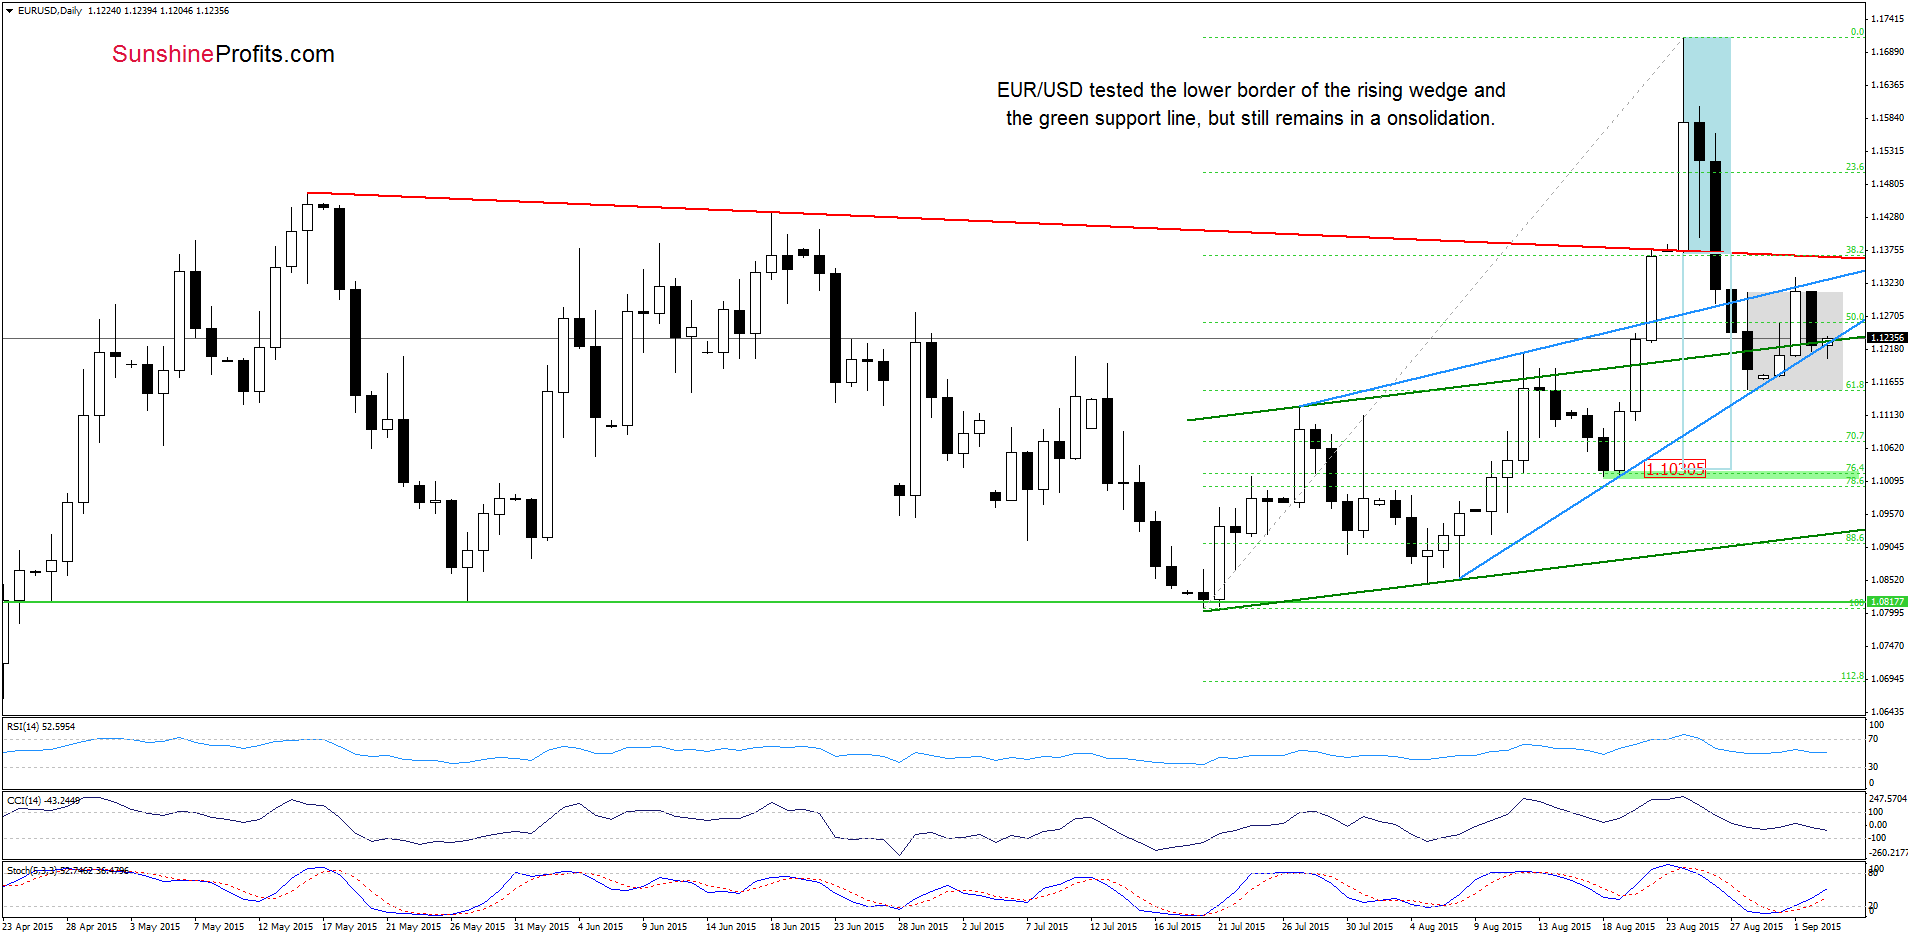
From this perspective, we see that the combination of the blue resistance line (the upper border of the rising wedge) and the upper line of the grey consolidation triggered a pullback, which took EUR/USD to the lower line of the rising wedge and the previously-broken upper border of the rising trend channel (marked with green). What’s next? Taking into account the medium-term picture and the breakdown below the lower line of the blue consolidation, we believe that lower values of the exchange rate are still ahead us. Therefore, what we wrote on Tuesday is still up-to-date:
(…) another attempt to move lower is more likely than not. In our opinion, if the pair drops under the lower line of the rising wedge (marked with blue), the next downside target would be around 1.1030, where the size of the downward move will correspond to the height of the blue consolidation and where the mid-Aug lows are.
Very short-term outlook: bearish
Short-term outlook: bearish
MT outlook: mixed with bearish bias
LT outlook: mixed
Trading position (short-term; our opinion): Short positions with a stop-loss order at 1.1445 are justified from the risk/reward perspective. The downside target around 1.0938. We will keep you informed should anything change, or should we see a confirmation/invalidation of the above.
GBP/USD
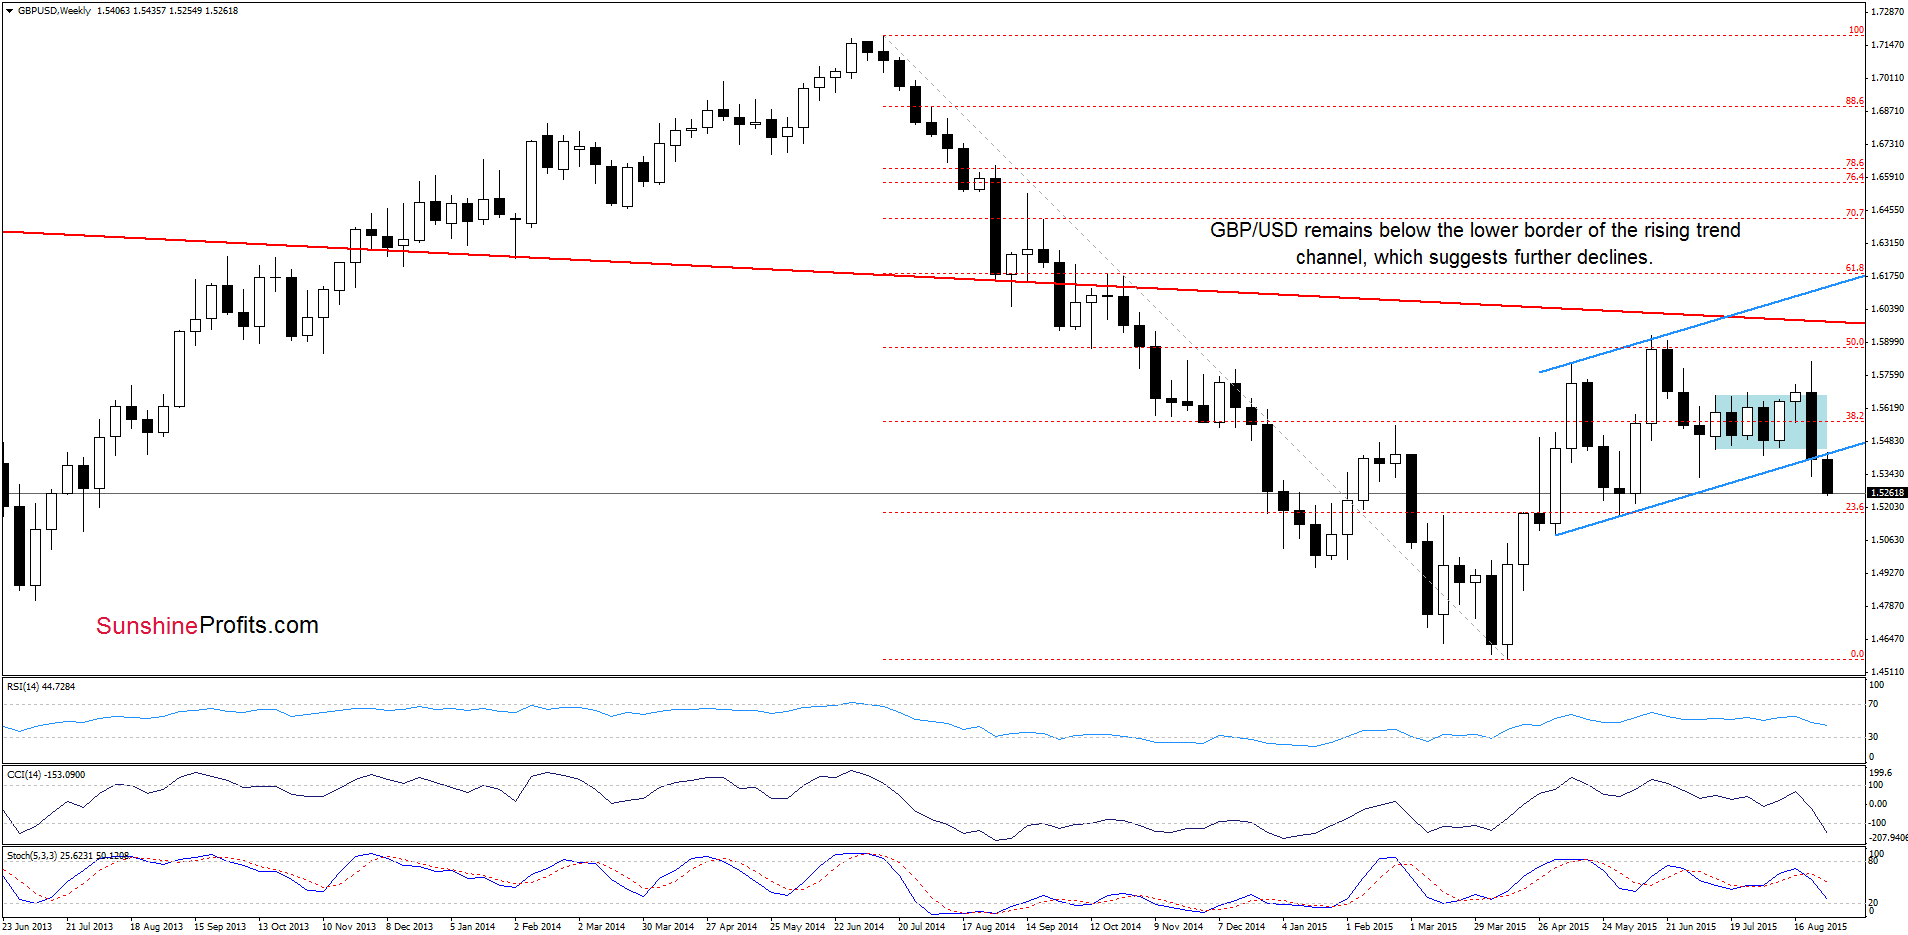
GBP/USD extended losses under the lower border of the rising trend channel, which is a negative signal that suggests further deterioration.
Will the daily char confirm the above bearish scenario? Let’s check.
Quoting our last commentary on this currency pair:
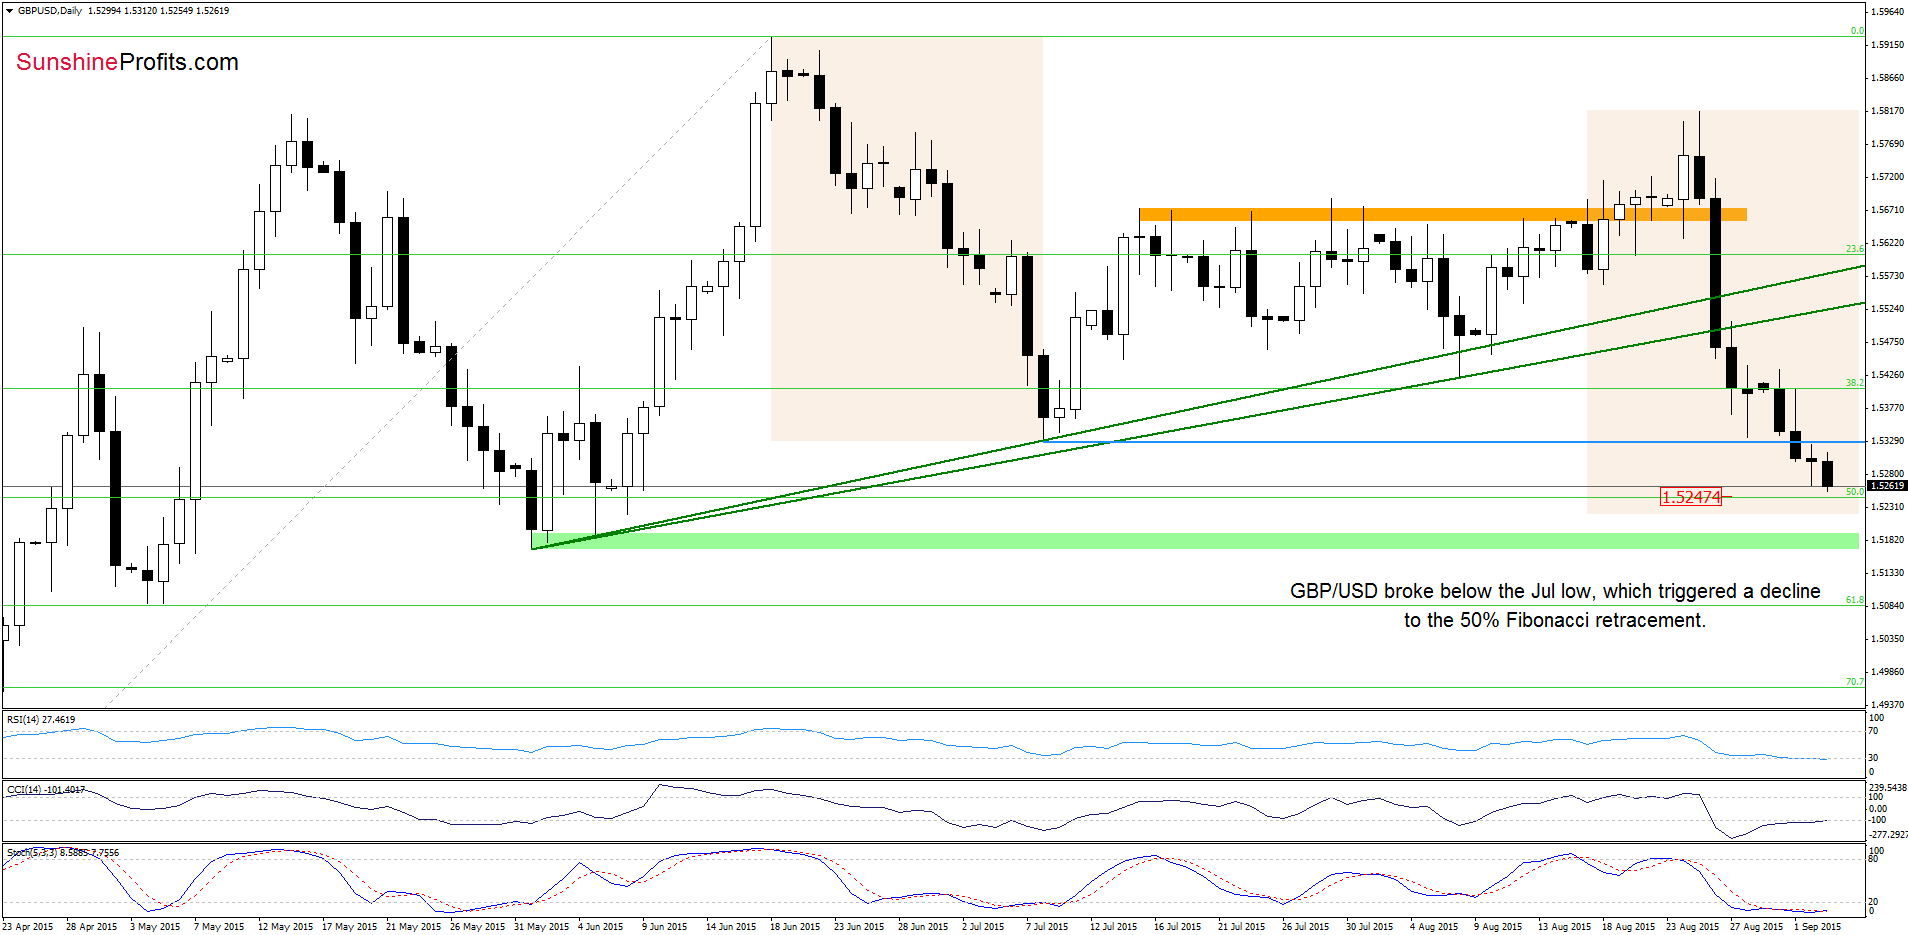
(…) taking into account the medium-term picture and the current position of the daily indicators, it seems that currency bears will try to push the pair lower in the coming days. If this is the case, and we see a breakdown, the next downside target would be around 1.5247, where the 50% Fibonacci retracement is.
Looking at the daily chart we see that the situation developed in line with the above scenario and GBP/USD reached our downside target earlier today. What’s interesting, in this area the size of the current downward move is almost the same as decline, which we saw from mid-Jun to the first decade of July, which increases the probability of reversal. On top of that, all indicators are oversold and very close to generating buy signals, which together could encourage currency bulls to act and result in a rebound in the coming days. Nevertheless, this scenario will be more reliable if we see an invalidation of the breakdown under the Jul 8 low of 1.5328.
Very short-term outlook: mixed with bullish bias
Short-term outlook: mixed
MT outlook: mixed
LT outlook: mixed
Trading position (short-term; our opinion): No positions are justified from the risk/reward perspective at the moment. We will keep you informed should anything change, or should we see a confirmation/invalidation of the above.
USD/JPY
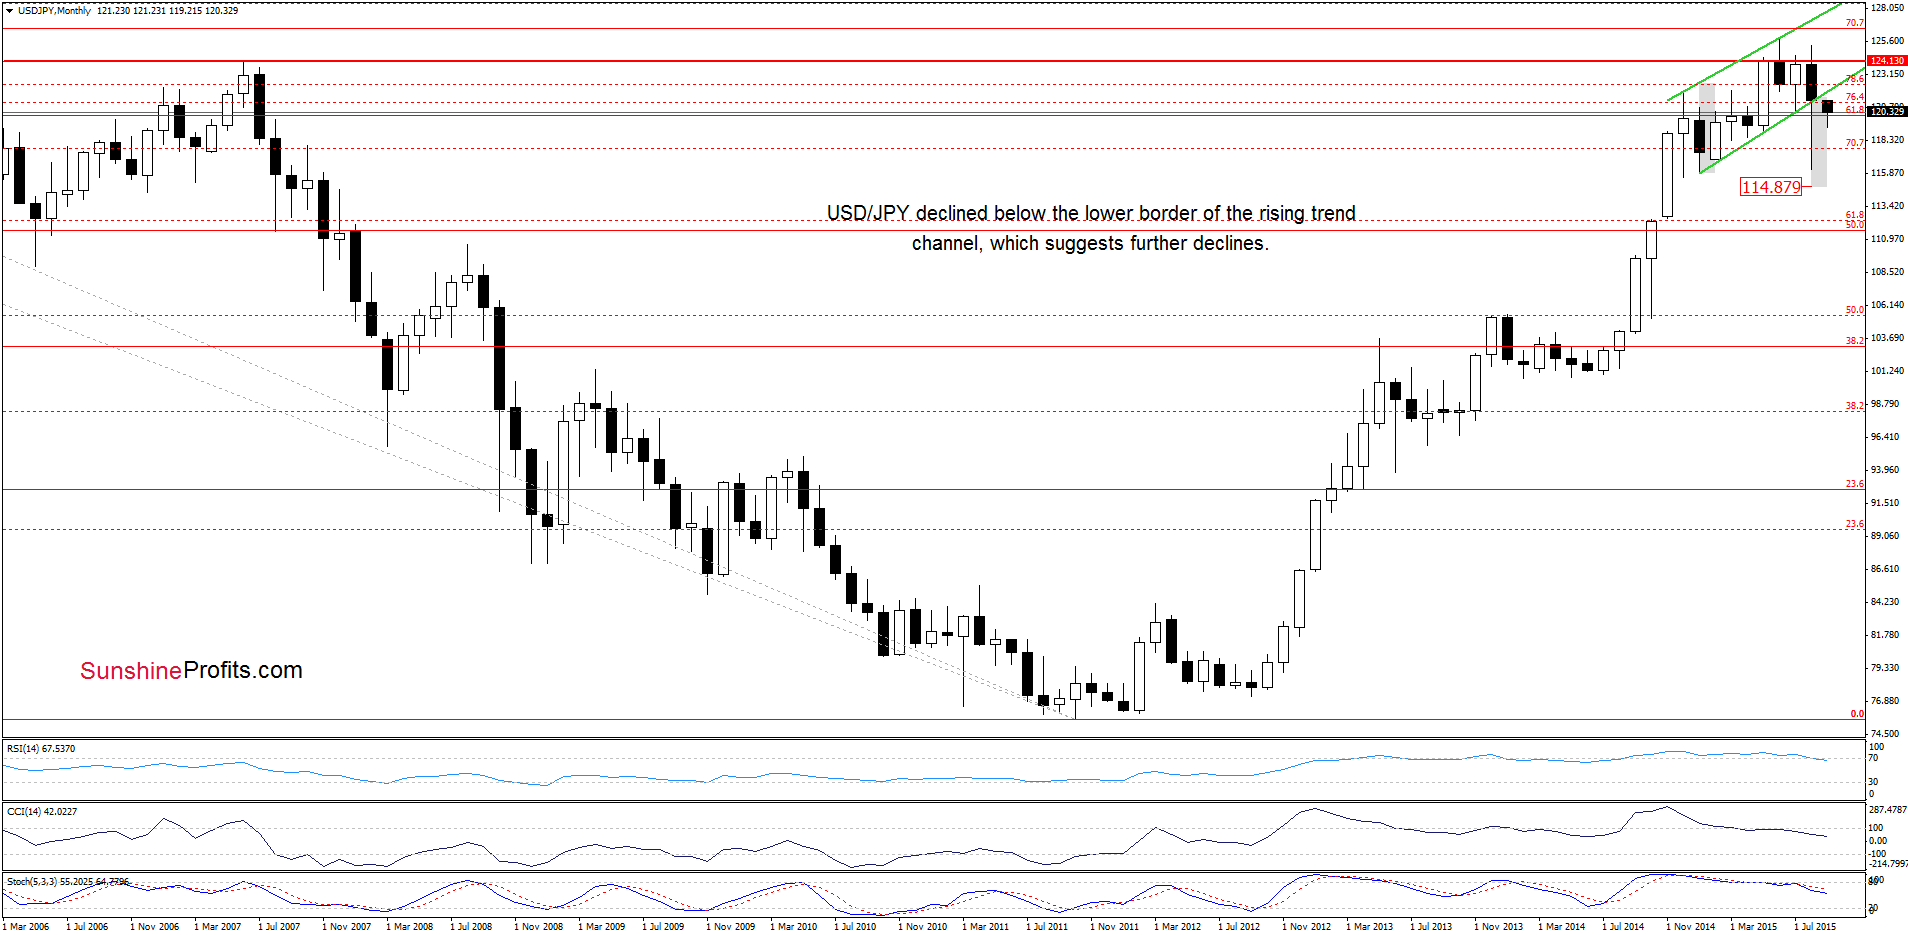
The situation in the medium-term hasn’t changed much as USD/JPY is still trading under the lower border of the rising trend channel, which suggests lower values of the exchange rate in near future.
What can we infer from the very short-term picture? Let’s find out.
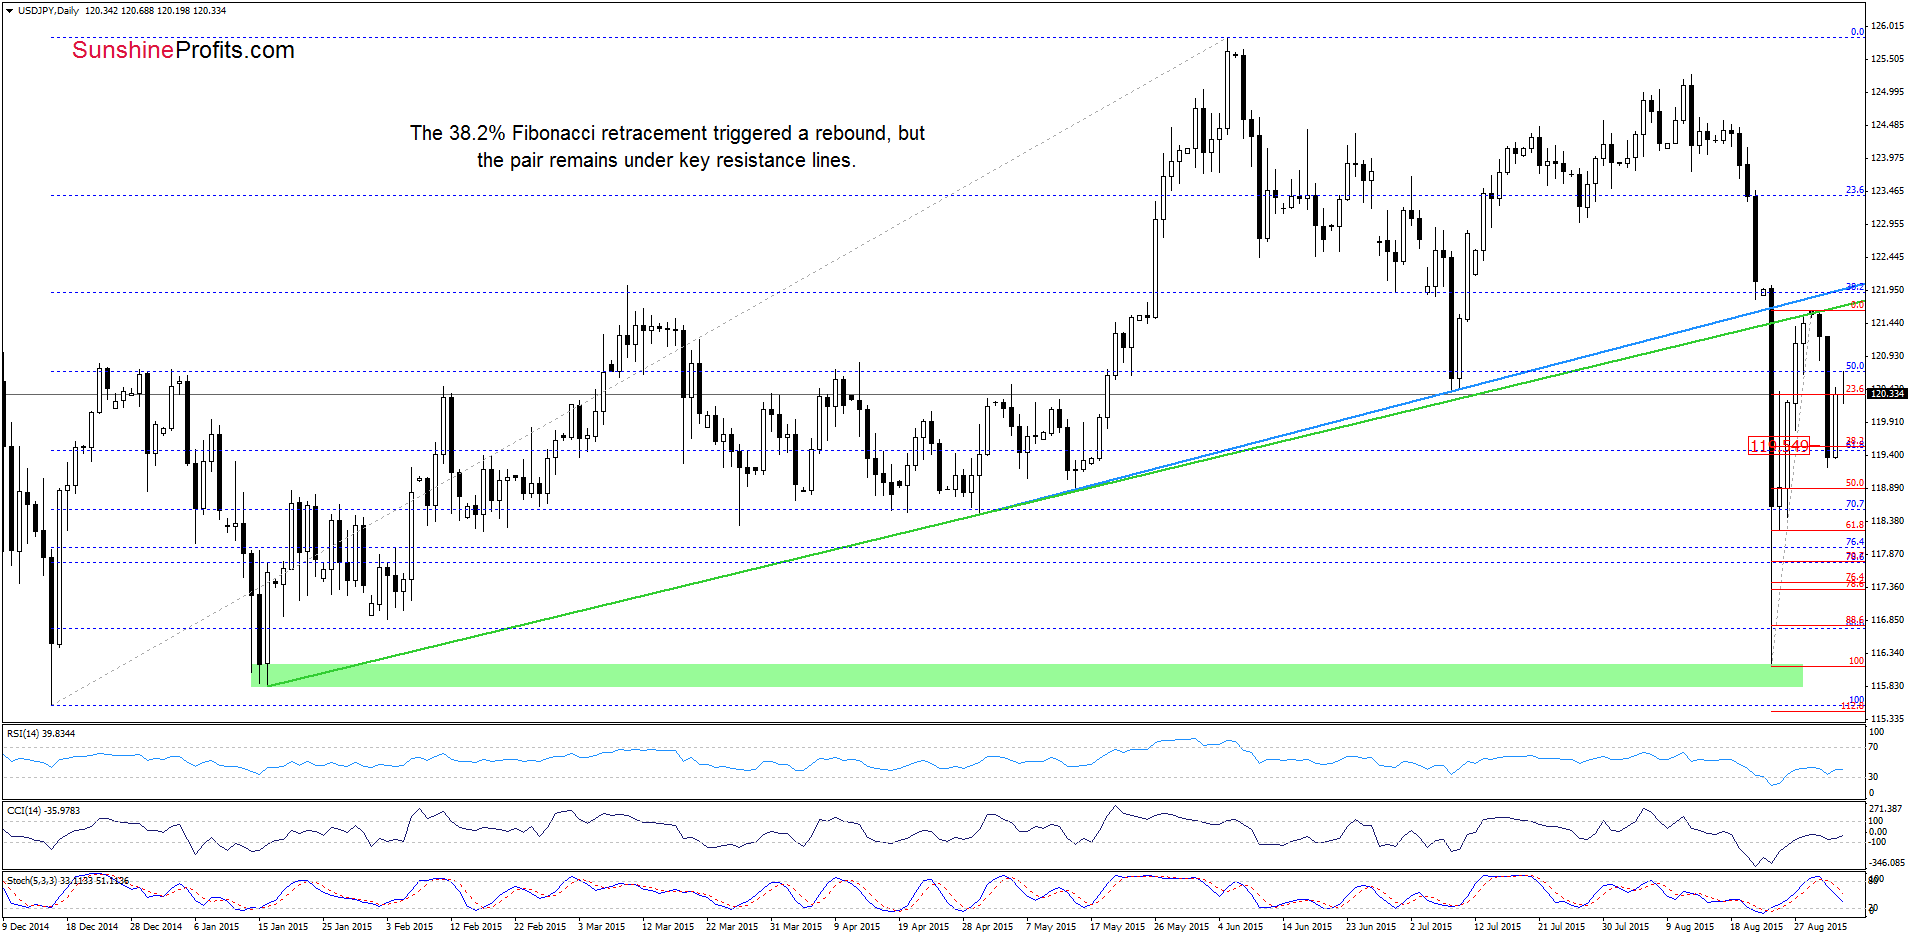
As you see on the daily chart USD/JPY slipped under the 38.2% Fibonacci retracement (based on the late Aug rally), but currency bulls didn’t give up and managed to invalidate this breakdown on the following day. This positive signal triggered further improvement and an increase to 120 earlier today. Despite this move, we think that as long as there is no invalidation of the breakdown below the blue and green support/resistance lines sizable upward move is not likely to be seen and another downswing can’t be ruled out.
Very short-term outlook: mixed
Short-term outlook: mixed
MT outlook: mixed
LT outlook: mixed
Trading position (short-term; our opinion): No positions are justified from the risk/reward perspective at the moment. We will keep you informed should anything change, or should we see a confirmation/invalidation of the above.
Thank you.
Nadia Simmons
Forex & Oil Trading Strategist
Przemyslaw Radomski, CFA
Founder, Editor-in-chief
Gold & Silver Trading Alerts
Forex Trading Alerts
Oil Investment Updates
Oil Trading Alerts
