

Forex Trading Alert originally sent to subscribers on August 27, 2015, 6:53 AM.
Earlier today, the Australian Bureau of Statistics reported that private capital expenditure declined by 4.0% in the second quarter, missing analysts’ expectations for a 2.5% drop. As a result, AUD/USD moved lower once again but did this move change anything in the short-term picture?
In our opinion the following forex trading positions are justified - summary:
- EUR/USD: short (a stop-loss order at 1.1445; the initial downside target around 1.0938)
- GBP/USD: none
- USD/JPY: none
- USD/CAD: none
- USD/CHF: none
- AUD/USD: none
EUR/USD
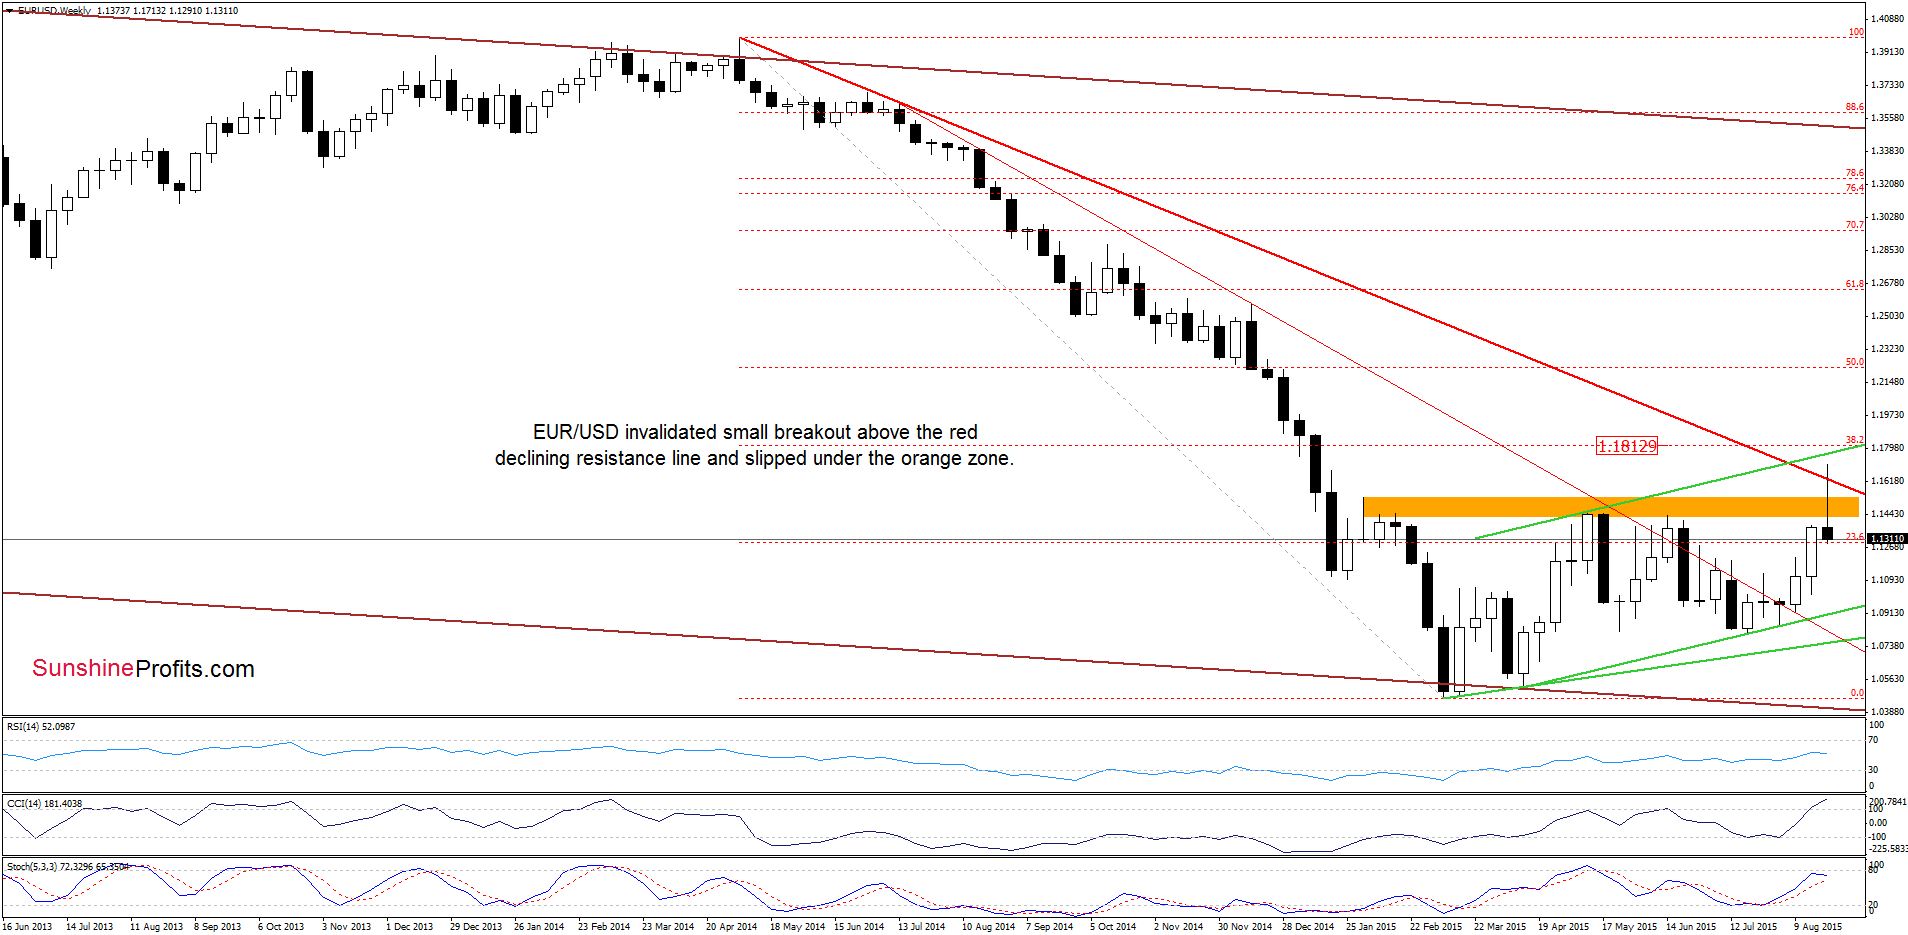
Looking at the weekly chart we see that EUR/USD is trading under the red line and the previously-broken orange resistance zone, which suggests lower values of the exchange rate in the coming days.
How low could the pair go? Let’s take a closer look at the daily chart and find out.
Quoting our previous commentary:
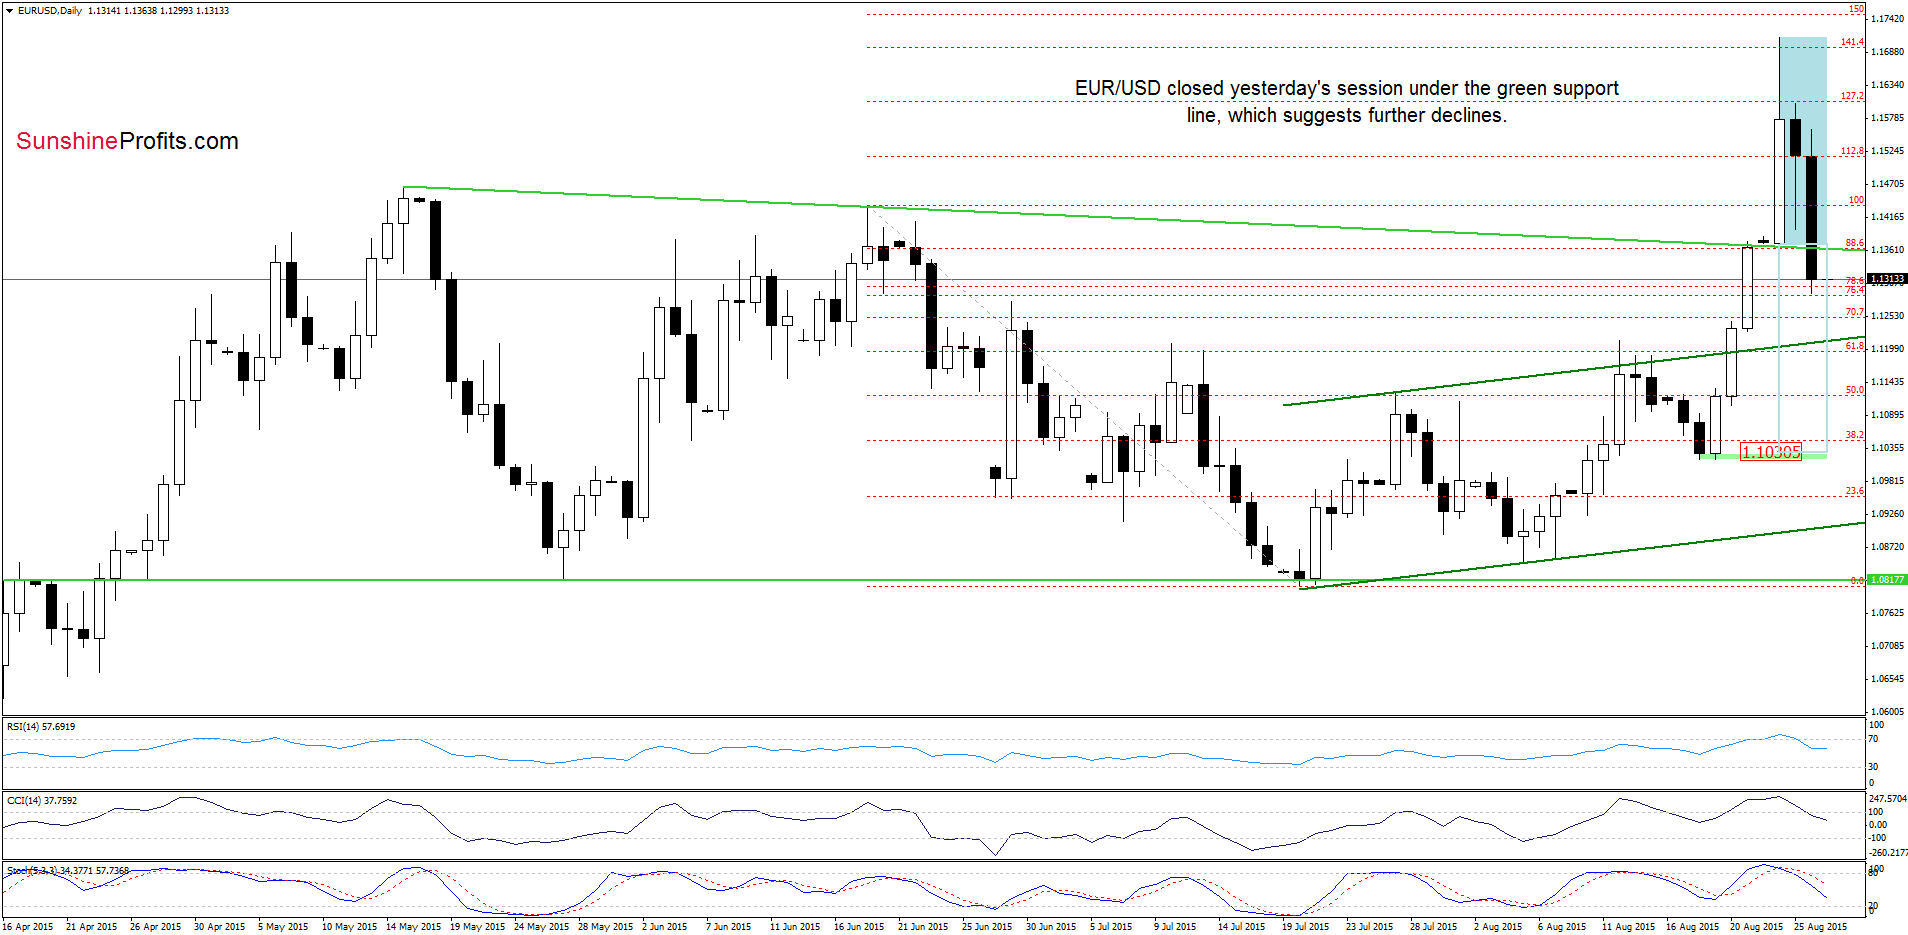
(…) taking into account the current position of the indicators (they all generated sell signals), we think that currency bears will try push the pair lower and close the day below the green support line based on the May and June highs (marked on the daily chart).
As you see on the daily chart the situation developed in line with the above scenario and EUR/USD closed yesterday’s session under the green support line based on the May and June highs, which means that what we wrote yesterday is up-to-date:
(…) If they succeed, the next downside target would be around 1.1206, (the previously-broken upper line of the rising trend channel) or we may see a decline even to around 1.1030, where the size of the downward move will correspond to the height of the formation and where the mid-Aug lows are.
Very short-term outlook: bearish
Short-term outlook: bearish
MT outlook: mixed with bearish bias
LT outlook: mixed
Trading position (short-term; our opinion): Short positions with a stop-loss order at 1.1445 are justified from the risk/reward perspective. The initial downside target around 1.0938. We will keep you informed should anything change, or should we see a confirmation/invalidation of the above.
USD/CAD
The medium-term picture hasn’t changed much as USD/CAD is trading above the 2008 high. Today, we’ll focus on the very short-term changes.
On Tuesday, we wrote the following:
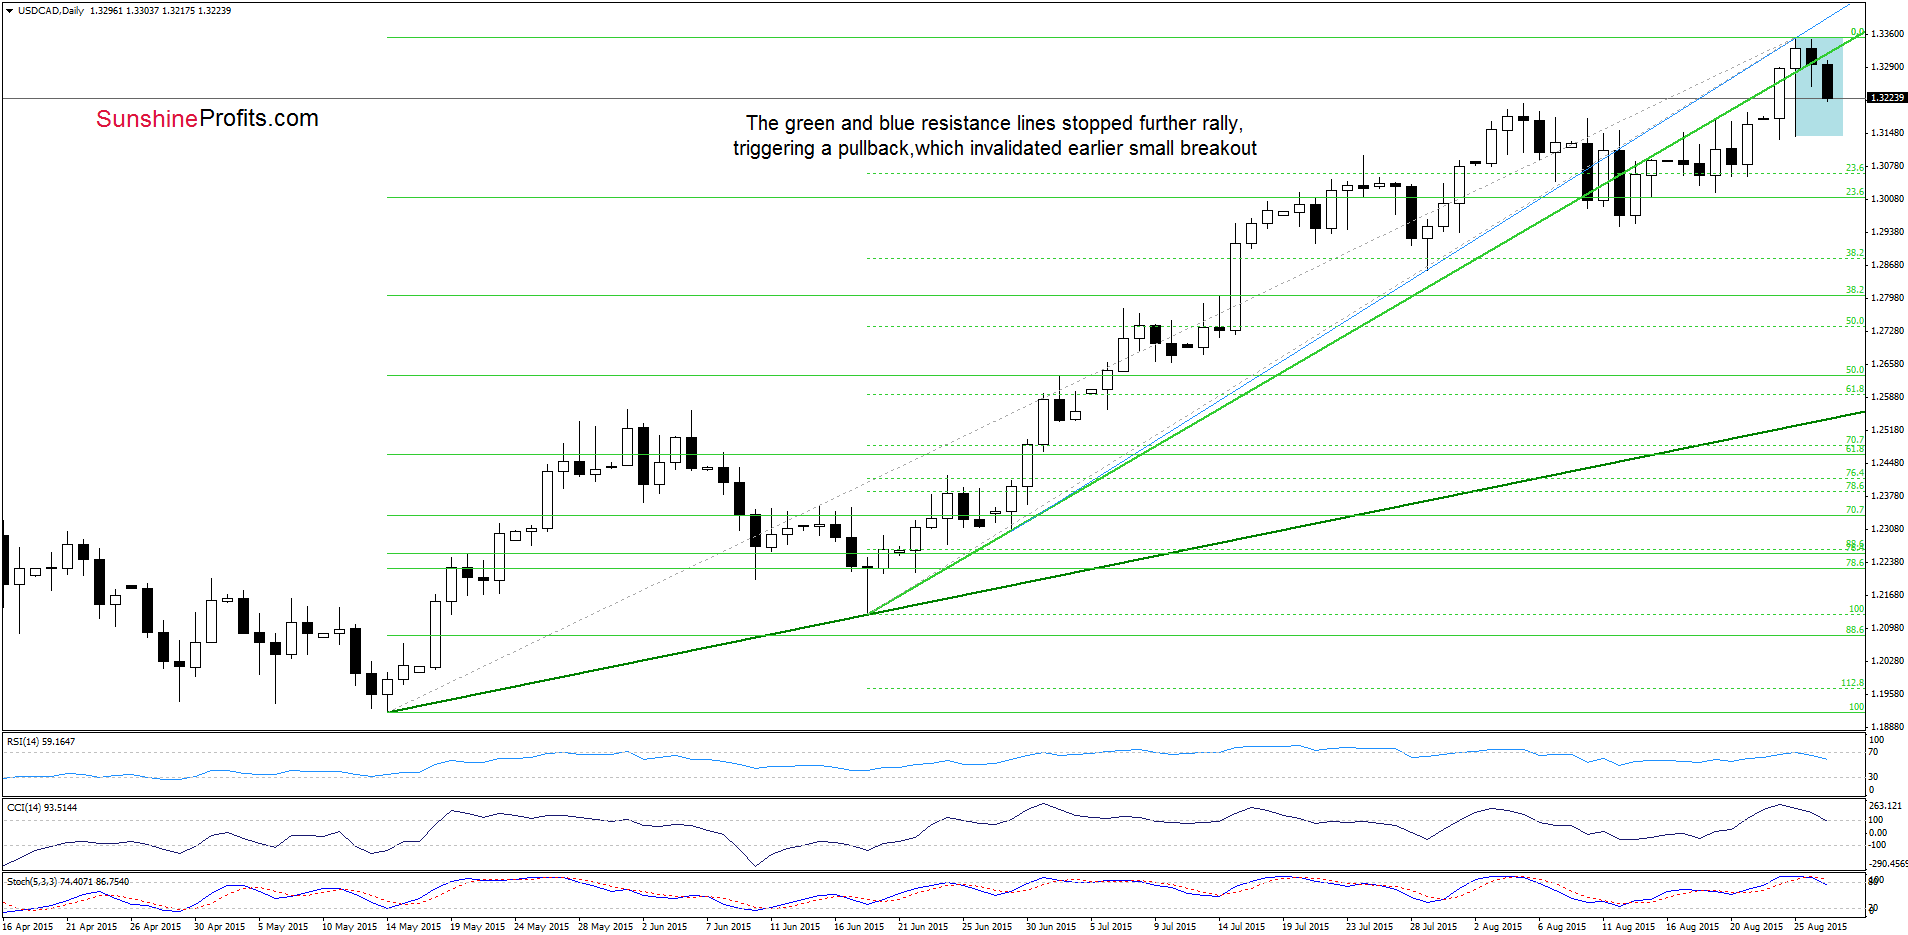
(…) we still believe that as long as there is no invalidation of the breakdown below this key resistance, further rally is questionable. Taking this fact into account and the current position of the indicators, it seems that currency bears will try to push the pair lower in the coming day(s).
Looking at the daily chart, we see that although USD/CAD extended gains and climbed above the green resistance line, the blue resistance line encouraged currency bears to act (as we had expected). As a result, the exchange rate reversed and invalidated earlier breakout above the green line. Taking this negative signal into account, and combining it with sell signals generated by the indicators, we think that further deterioration is just around the corner. If this is the case, and the pair moves lower from here, the initial downside target would be around 1.2950-1.3015, where the bottom of the previous pullback and the 23.6% Fibonacci retracement (based on the entire May-Aug rally) are. Nevertheless, this bearish scenario will be more likely if we see a daily closure under the lower border of the blue consolidation (below 1.3142).
Very short-term outlook: mixed with bearish bias
Short-term outlook: mixed
MT outlook: mixed
LT outlook: mixed
Trading position (short-term; our opinion): No positions are justified from the risk/reward perspective at the moment. We will keep you informed should anything change, or should we see a confirmation/invalidation of the above.
AUD/USD
The situation in the medium term hasn’t changed much as AUD/USD is trading in the green support zone (based on the 76.4% and 78.6% Fibonacci retracement levels). Today, we’ll focus on the daily chart.
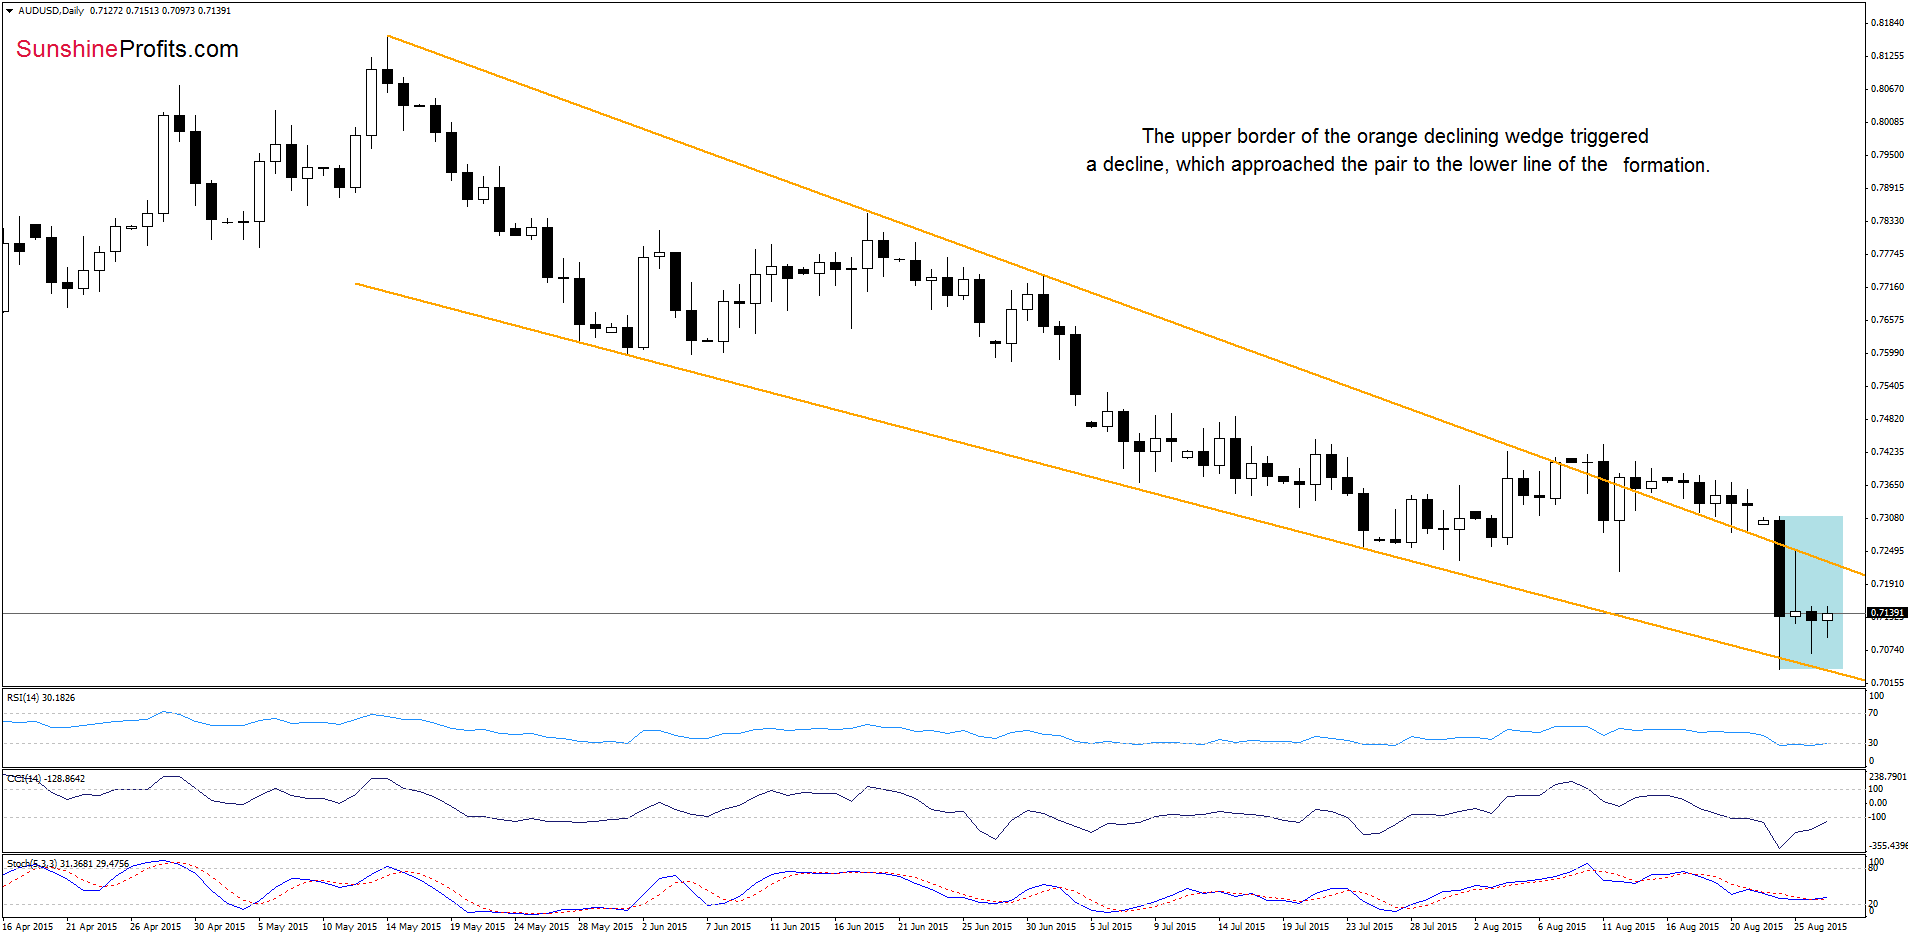
From today’s point of view we see that AUD/USD remains in the consolidation (marked with blue) between the upper and lower border of the declining wedge (marked with orange). Taking this fact into account, we think that as long as there is no daily closure above/below one of these lines a sizable upward/downward move is not likely to be seen. Nevertheless, the current position of the indicators suggests that we’ll likely see another test of the upper border of the formation in the coming days.
Very short-term outlook: mixed
Short-term outlook: mixed
MT outlook: mixed
LT outlook: mixed
Trading position (short-term; our opinion): No positions are justified from the risk/reward perspective at the moment. We will keep you informed should anything change, or should we see a confirmation/invalidation of the above.
Thank you.
Nadia Simmons
Forex & Oil Trading Strategist
Przemyslaw Radomski, CFA
Founder, Editor-in-chief
Gold & Silver Trading Alerts
Forex Trading Alerts
Oil Investment Updates
Oil Trading Alerts
