

Forex Trading Alert originally sent to subscribers on July 16, 2015, 7:28 AM.
The situation in EUR/USD has deteriorated after Greece’s parliament passed harsh austerity measures demanded by the country’s creditors in order to secure a third bailout package. As a result, the pair dropped to levels not seen since May. Time for double bottom or further declines?
In our opinion the following forex trading positions are justified - summary:
- EUR/USD: short (stop-loss order at 1.1058)
- GBP/USD: none
- USD/JPY: none
- USD/CAD: none
- USD/CHF: none
- AUD/USD: none
EUR/USD
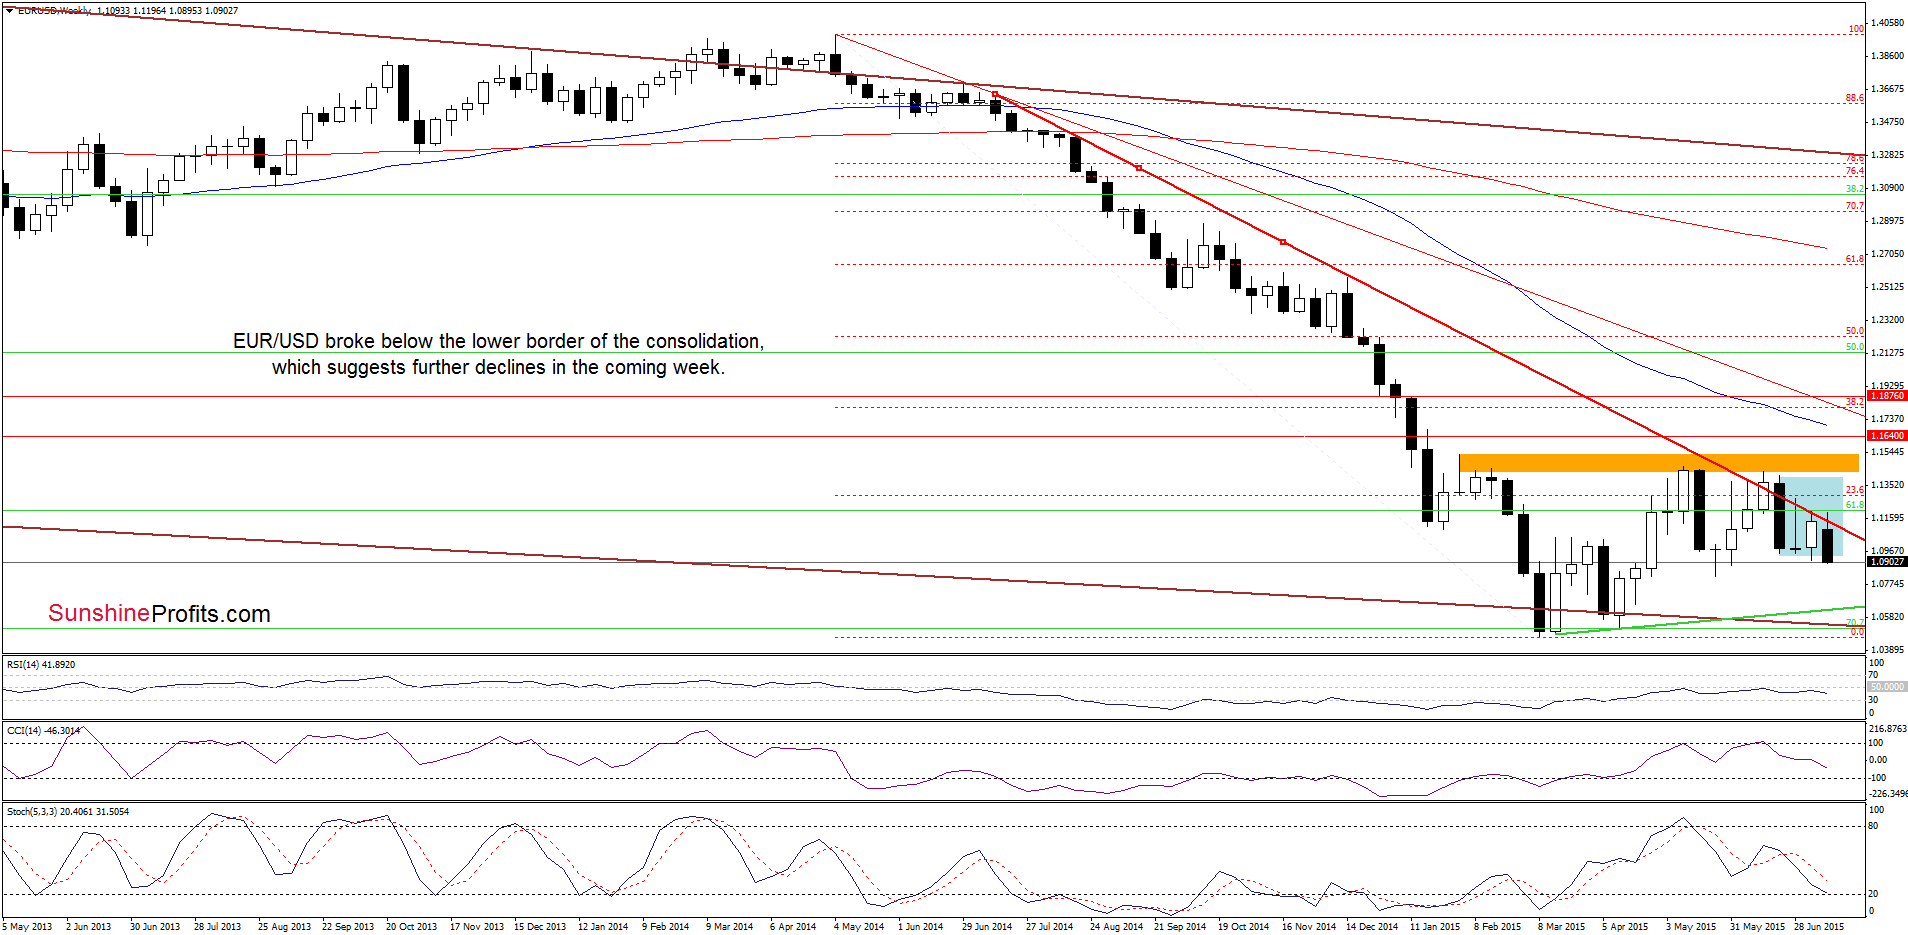
The first thing that catches the on the above chart is a breakdown below the lower border of the blue consolidation, which is a bearish signal that suggests further deterioration.
What impact did this drop have on the very short-term picture? Let’s check.
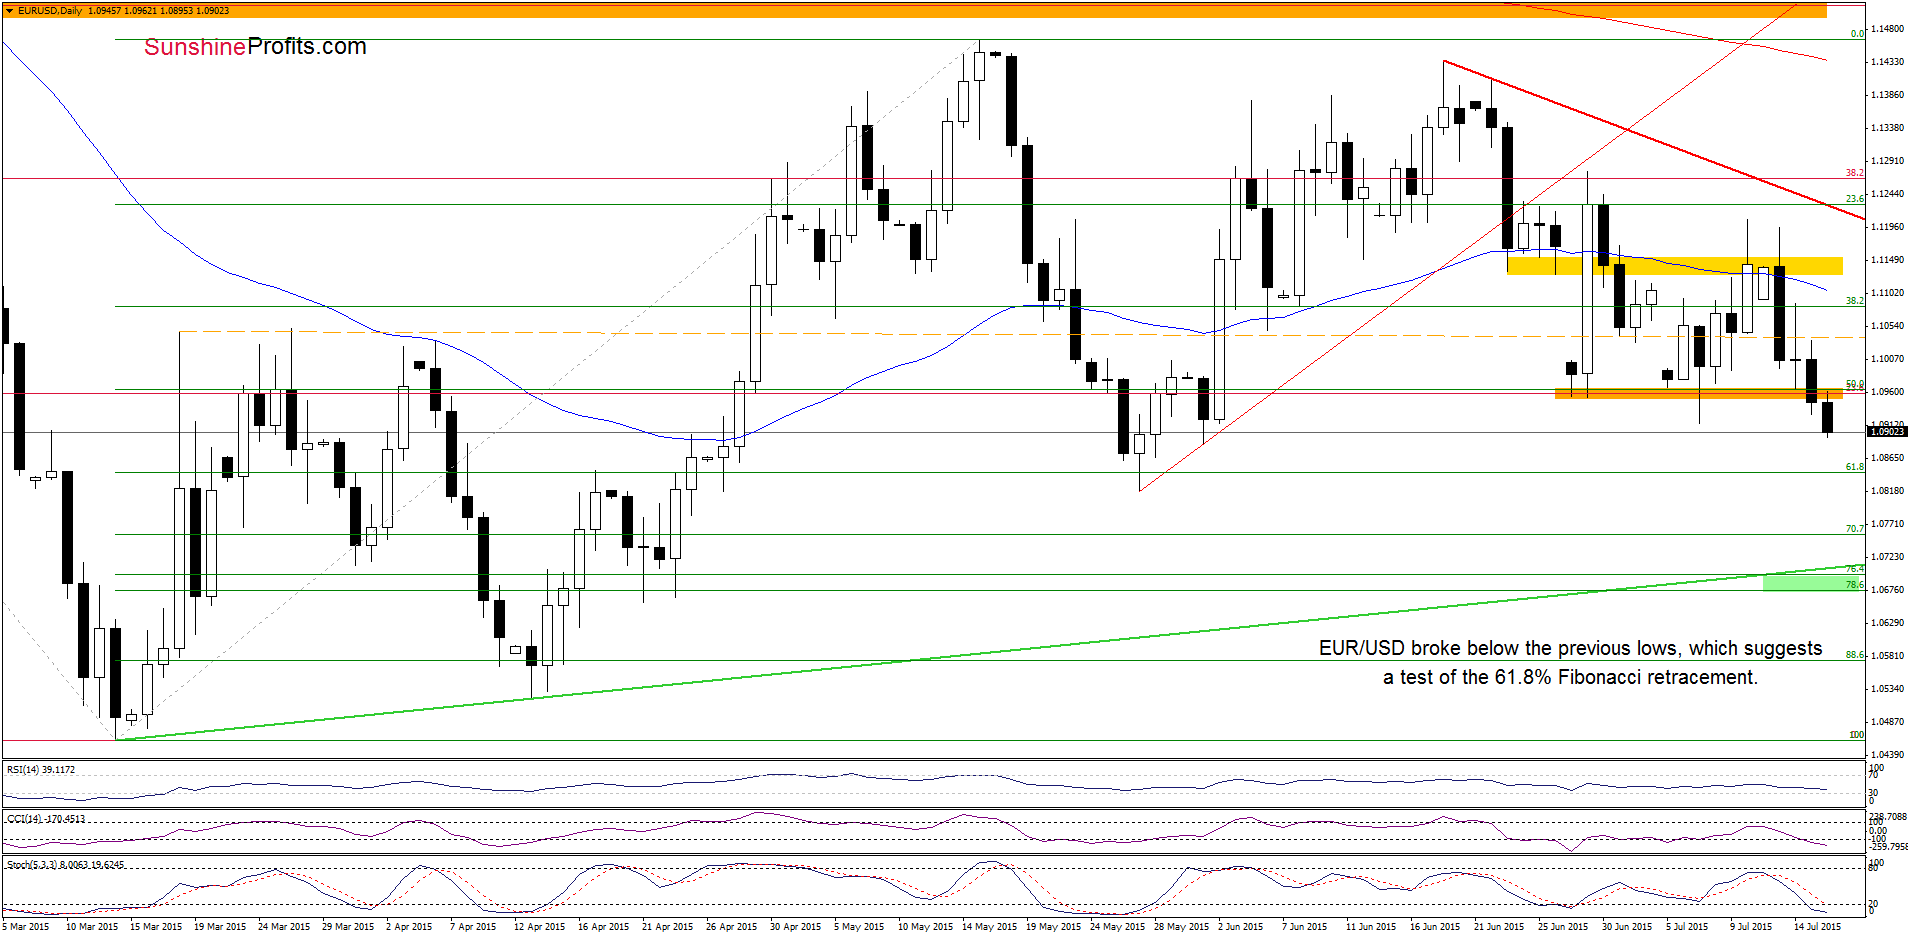
From this perspective, we see that EUR/USD broke below the orange zone based on the previous lows. In this way, the exchange rate invalidated a potential reverse head and shoulders formation, which Is a bearish signal that suggests further deterioration (especially when we factor in the current position of the indicators). How low could the exchange rate go in the coming days? In our opinion, the initial downside target for currency bears would be around 1.0818-1.0845, where the May low and the 61.8% Fibonacci retracement are. If this area is broken, e may see a decline to the medium-term green support line (currently around 1.0703) or even to 1.0676-1.0698, where the green support zone (created by the 76.4% and 78.6% Fibonacci retracement levels) is.
Very short-term outlook: bearish
Short-term outlook: mixed with bearish bias
MT outlook: mixed
LT outlook: mixed
Trading position (short-term; our opinion): Short positions (with a stop-loss order at 1.1058) are justified from the risk/reward perspective at the moment. We will keep you informed should anything change, or should we see a confirmation/invalidation of the above.
USD/CHF
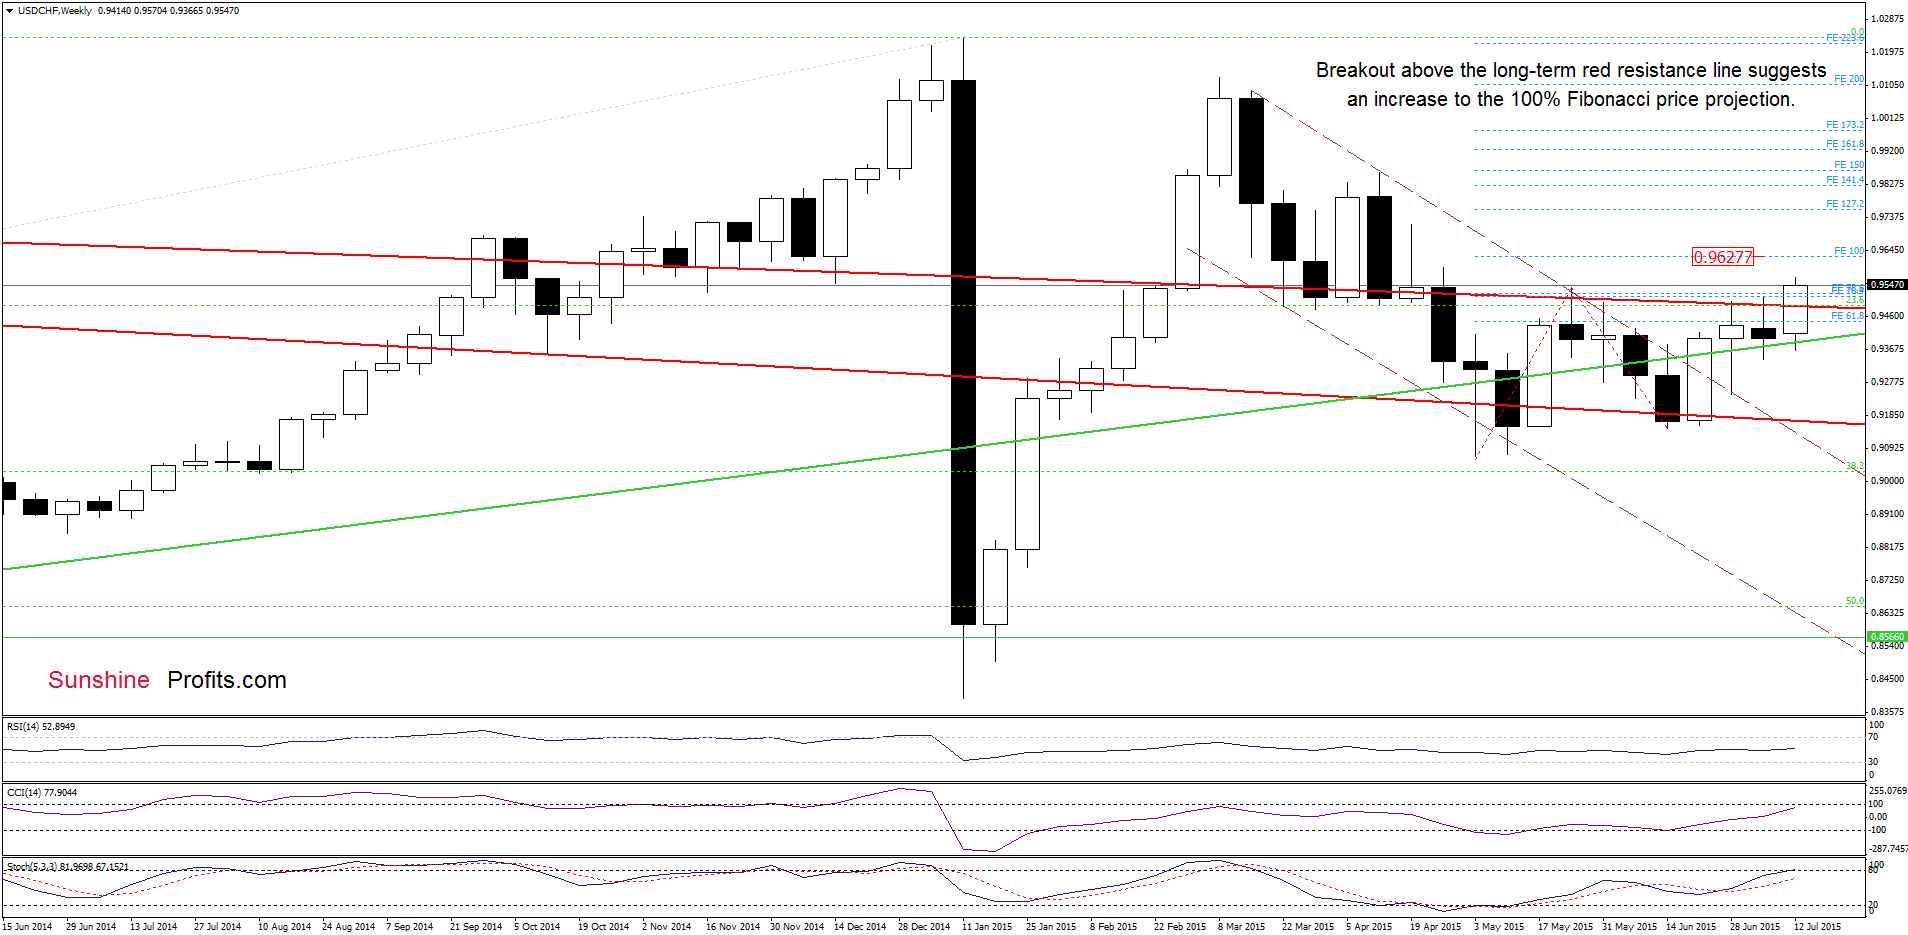
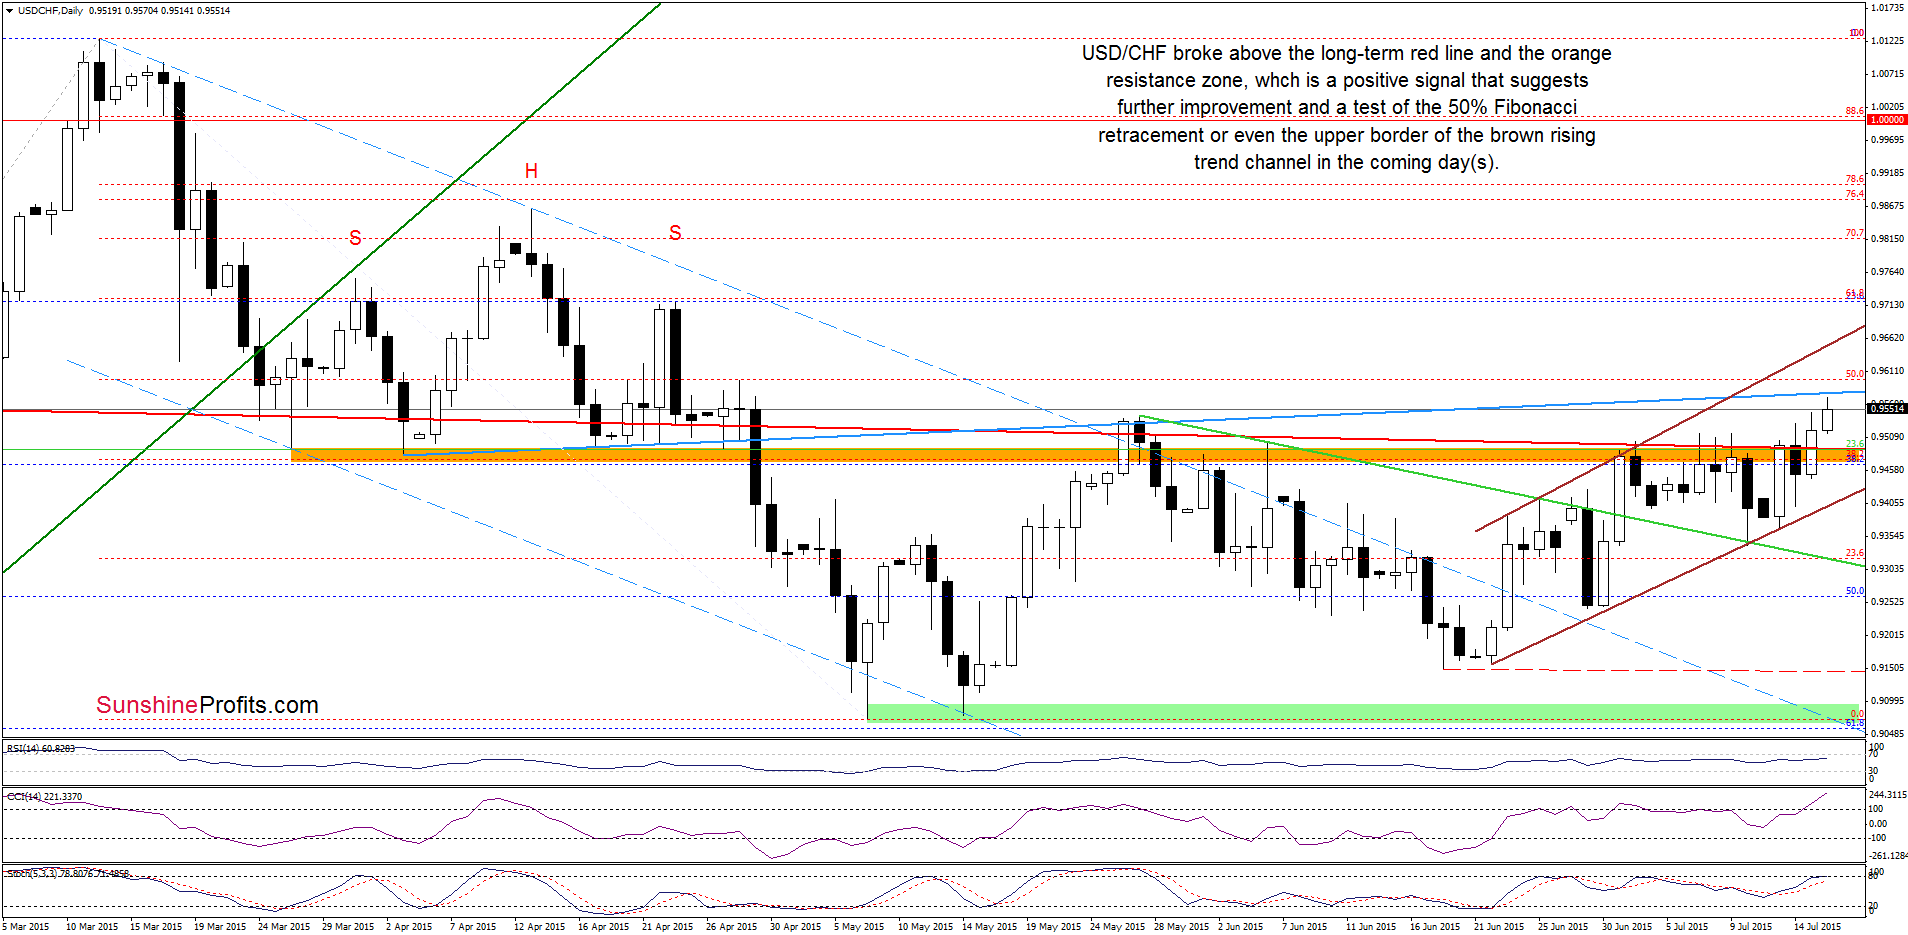
Looking at the daily chart we see that the most important improvement of recent days is a successful breakout above the long-term red line and the orange resistance zone. With the last upswing USD/CHF broke also above the May high, which means that the way to the 50% Fibonacci retracement is open. If it is broken, the next target would be around 0.9627 (the 100% Fibonacci price projection marked with blue on the weekly chart) or even the upper border of the rising trend channel (currently around 0.9648).
Very short-term outlook: bullish
Short-term outlook: mixed with bullish bias
MT outlook: mixed
LT outlook: mixed
Trading position (short-term; our opinion): No positions are justified from the risk/reward perspective at the moment. We will keep you informed should anything change, or should we see a confirmation/invalidation of the above.
AUD/USD
In our last commentary on this currency pair, we wrote the following:
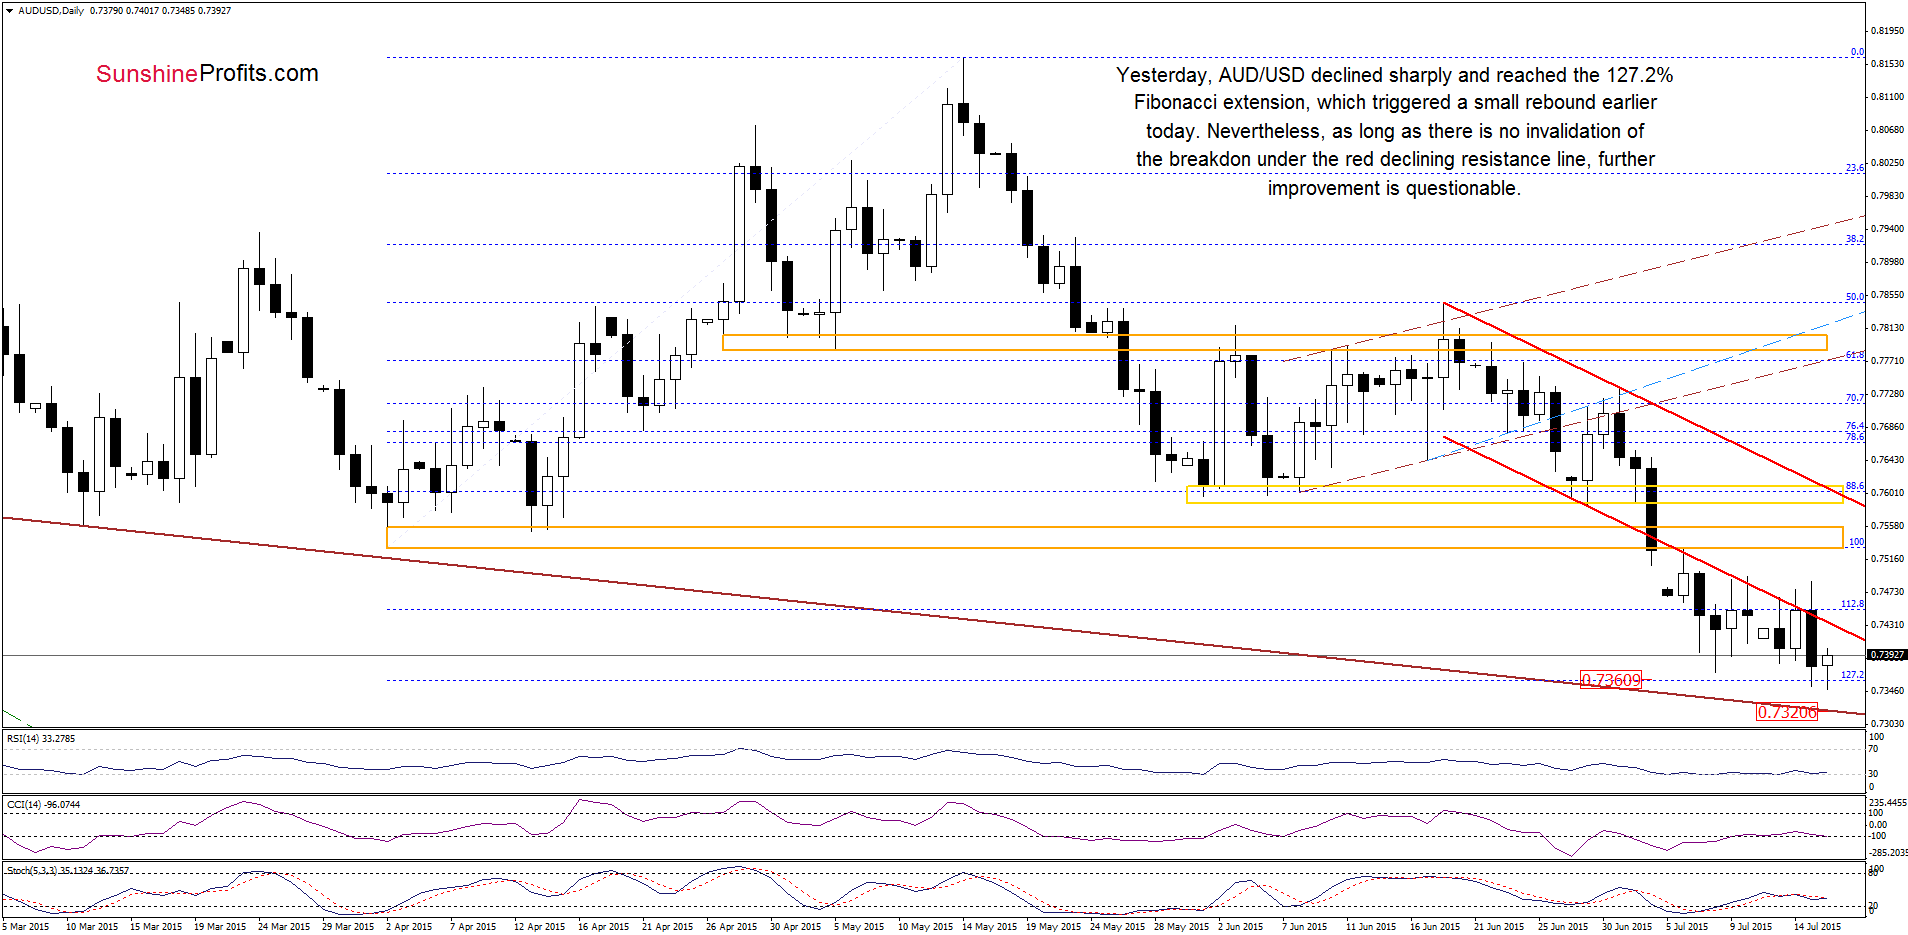
(…) the pair remains under the red declining resistance line (the lower border of the declining trend channel), which suggests that as long as there is no invalidation of the breakdown another pullback is likely. If this is the case, and the pair moves lower from here, it would be a bearish signal, which will likely result in a test of the recent low or even trigger a decline to the 127.2% extension in the coming day(s).
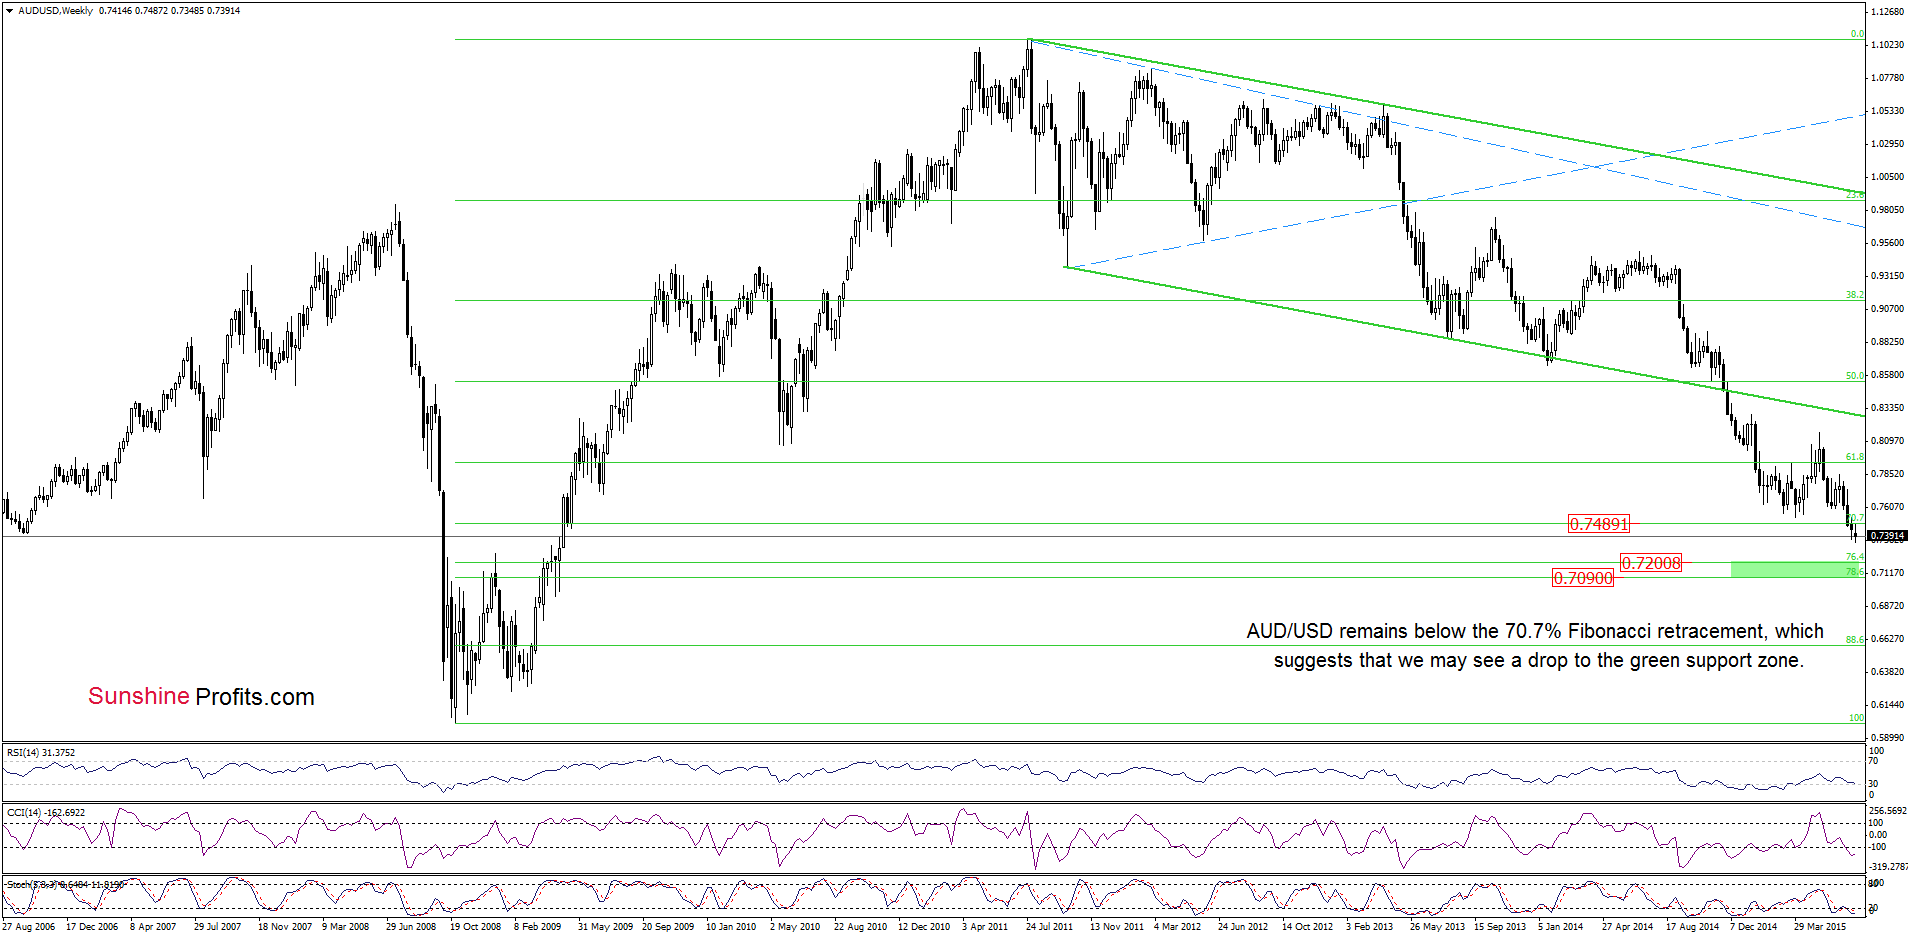
As you see on the daily chart, the situation developed in line with the above scenario and AUD/USD reached our downside target yesterday. Although this support level triggered a small rebound earlier today, we maintain our assumption that as long as there is no invalidation of the breakdown below the red declining resistance line another pullback is likely. How low could the pair go? If today’s low is broken, the next target would be around 0.7320 where the brown support line is. However if currency bears manage to push the exchange rate lower, we may see a decline even to (around 0.7097-0.7200, where the green support zone based on the 76.4% and 78.6% Fibonacci retracement levels (marked on the weekly chart) is.
Very short-term outlook: mixed with bearish bias
Short-term outlook: mixed
MT outlook: mixed
LT outlook: mixed
Trading position (short-term; our opinion): No positions are justified from the risk/reward perspective at the moment. We will keep you informed should anything change, or should we see a confirmation/invalidation of the above.
Thank you.
Nadia Simmons
Forex & Oil Trading Strategist
Przemyslaw Radomski, CFA
Founder, Editor-in-chief
Gold & Silver Trading Alerts
Forex Trading Alerts
Oil Investment Updates
Oil Trading Alerts
