

Forex Trading Alert originally sent to subscribers on July 7, 2015, 9:43 AM.
Although the new next finance minister (Euclid Tsakalotos) will represent Greece in an emergency meeting of euro zone finance ministers in Brussels today, the uncertainty over economic stability in Europe continues to weight on investors’ sentiment. In this environment, EUR/USD declined once again, hitting a fresh monthly low. How low could the exchange rate go in the coming days?
In our opinion the following forex trading positions are justified - summary:
EUR/USD
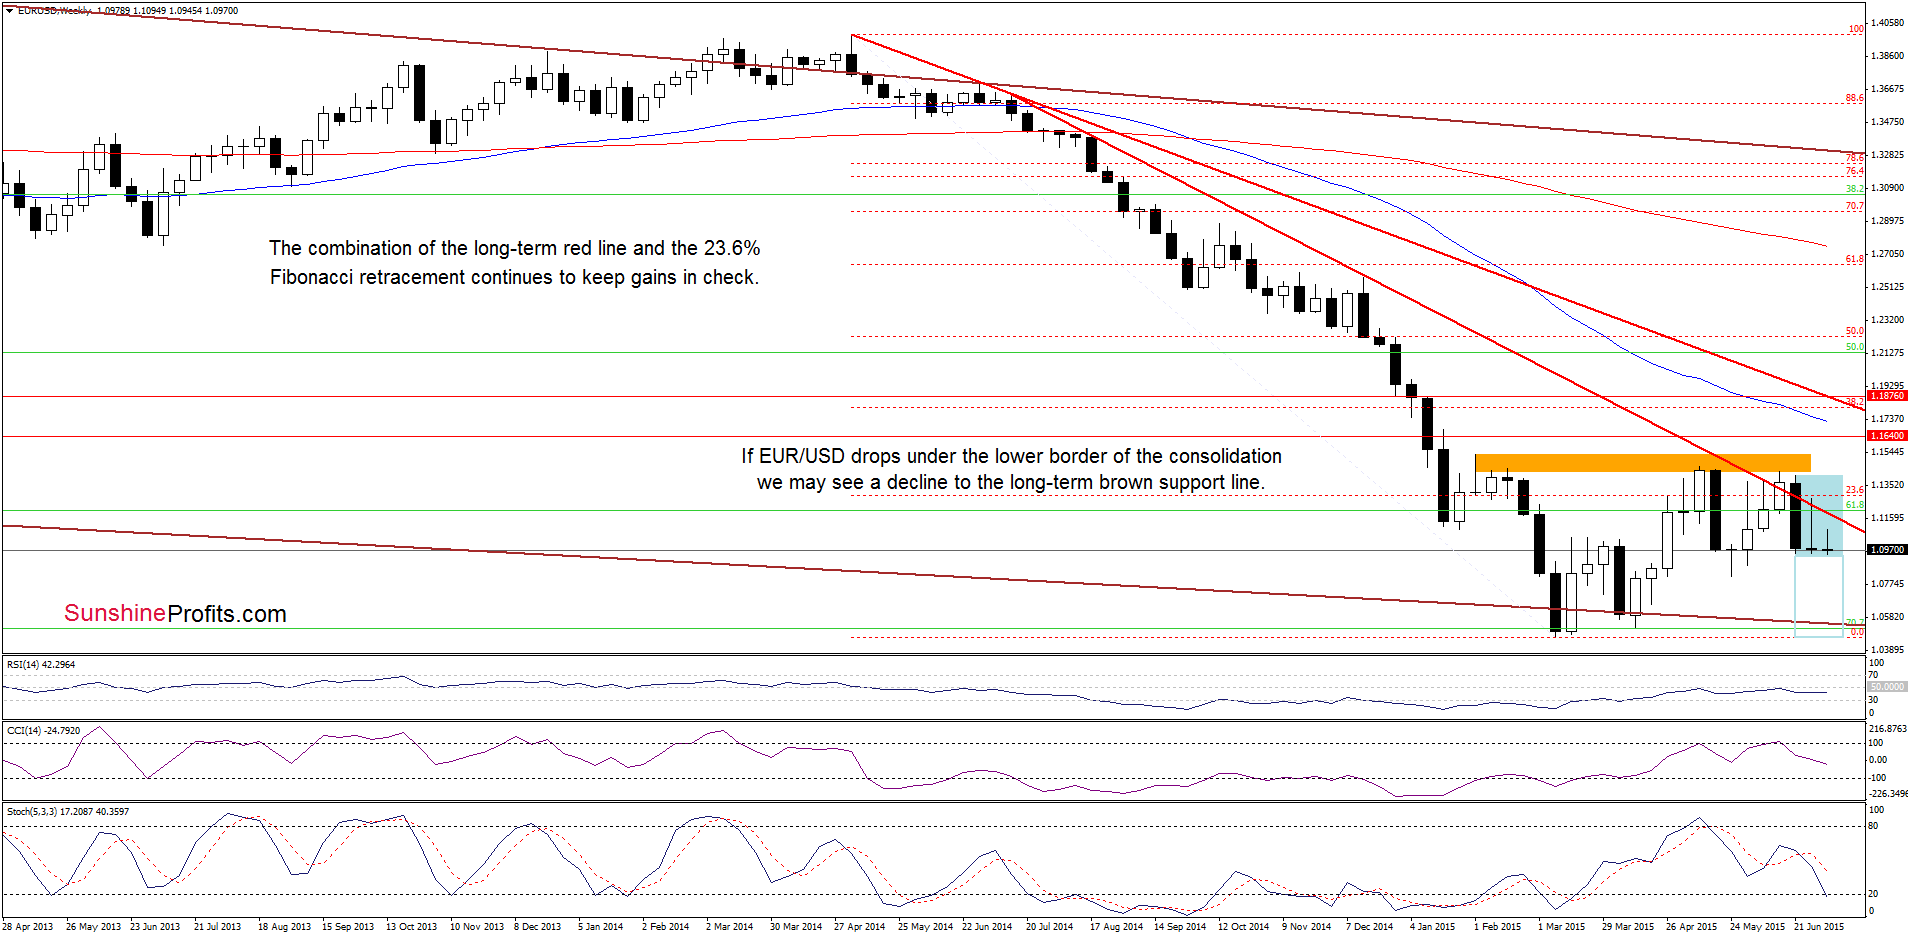
The situation in the medium term hasn’t changed much as EUR/USD remains in a consolidation (marked with blue) under the previously-broken long-term red declining line and the 23.6% Fibonacci retracement, which together continue to keep gains in check. If the pair breaks below the lower border of the formation, we may see a decline even to the long-term brown support line in the following days.
Having said that, let’s take a closer look at the daily chart.
Quoting our previous alert:
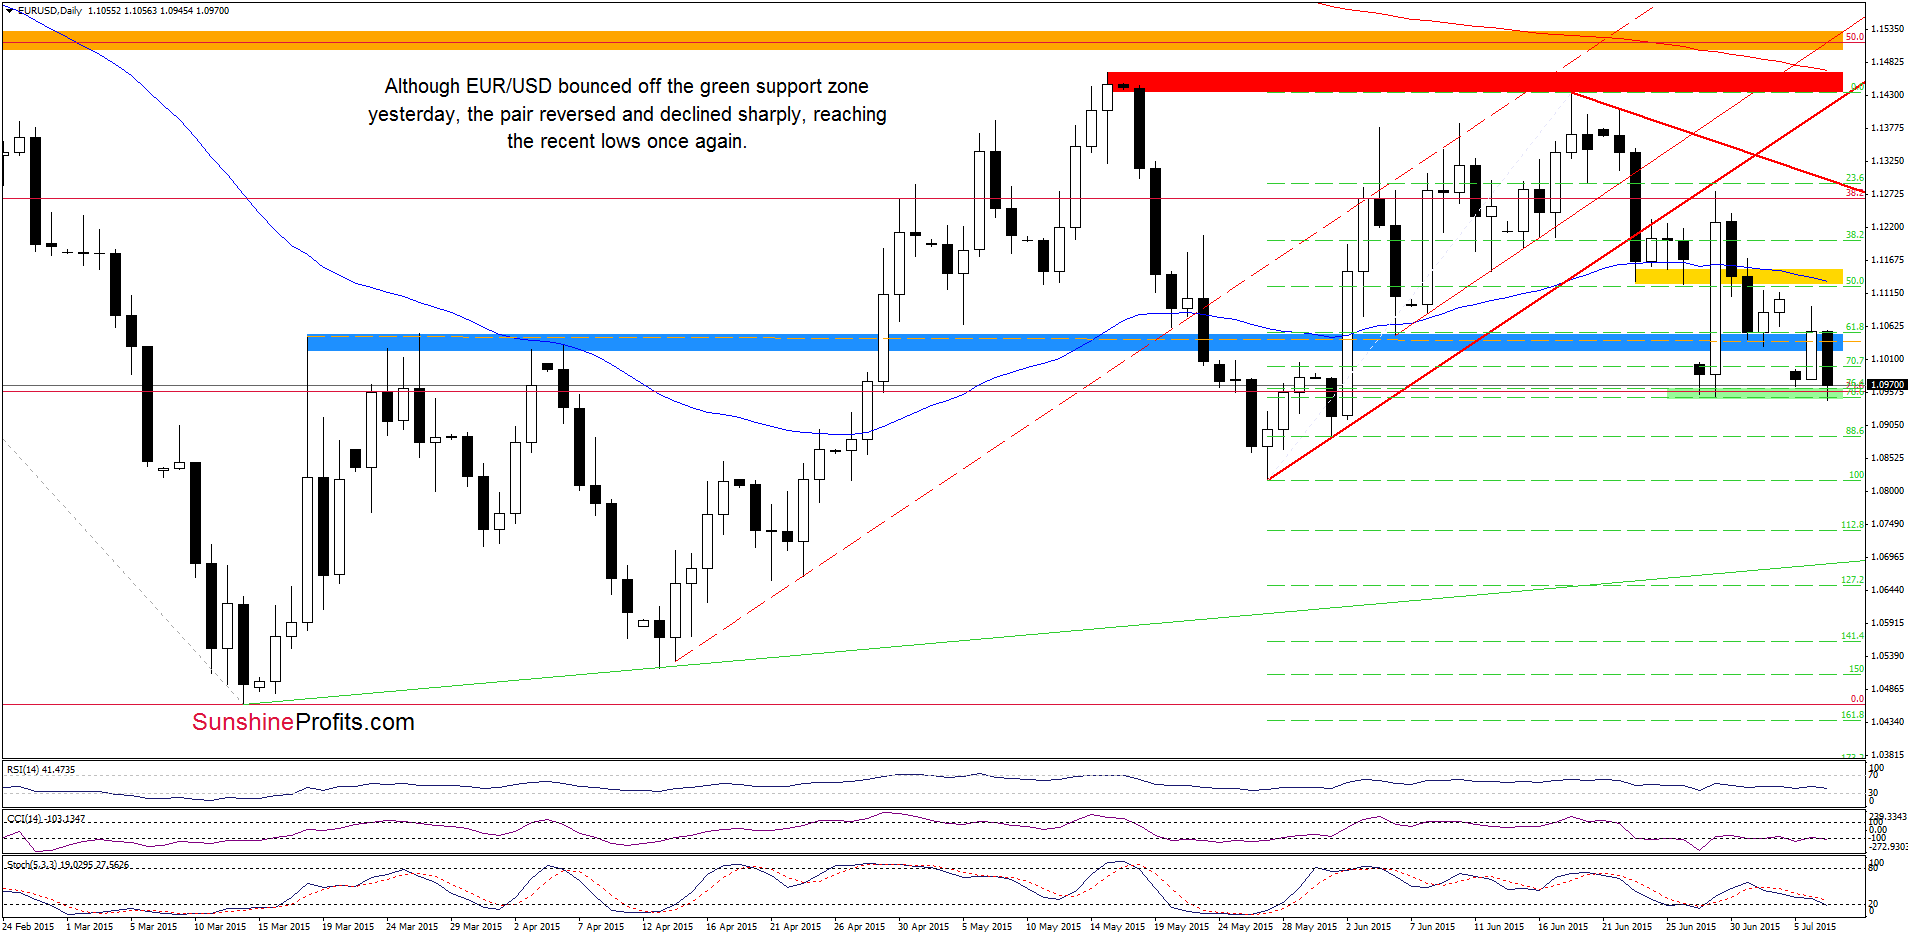
(…) Although the pair climbed above the blue support/resistance line, invalidating earlier breakdown, the proximity to the yellow resistance zone triggered a pullback, which erased most of today’s rally. Taking this fact into account, we think that another test of the green support zone is just around the corner.
As you see on the daily chart, currency bears pushed EUR/USD lower as we had expected. With today’s downswing, the exchange rate slipped under the last week’s low, which is a negative signal. Although the pair rebounded slightly, the current position of the indicators suggests that lower values of the exchange rate are likely (especially if we see a daily close under the green zone). If this is the case, and EUR/USD drops, the initial downside target for currency bears would be around 1.0890, where the 88.6% Fibonacci retracement is.
Very short-term outlook: mixed with bearish bias
Short-term outlook: mixed
MT outlook: mixed
LT outlook: mixed
Trading position (short-term; our opinion): No positions are justified from the risk/reward perspective at the moment. We will keep you informed should anything change, or should we see a confirmation/invalidation of the above.
GBP/USD
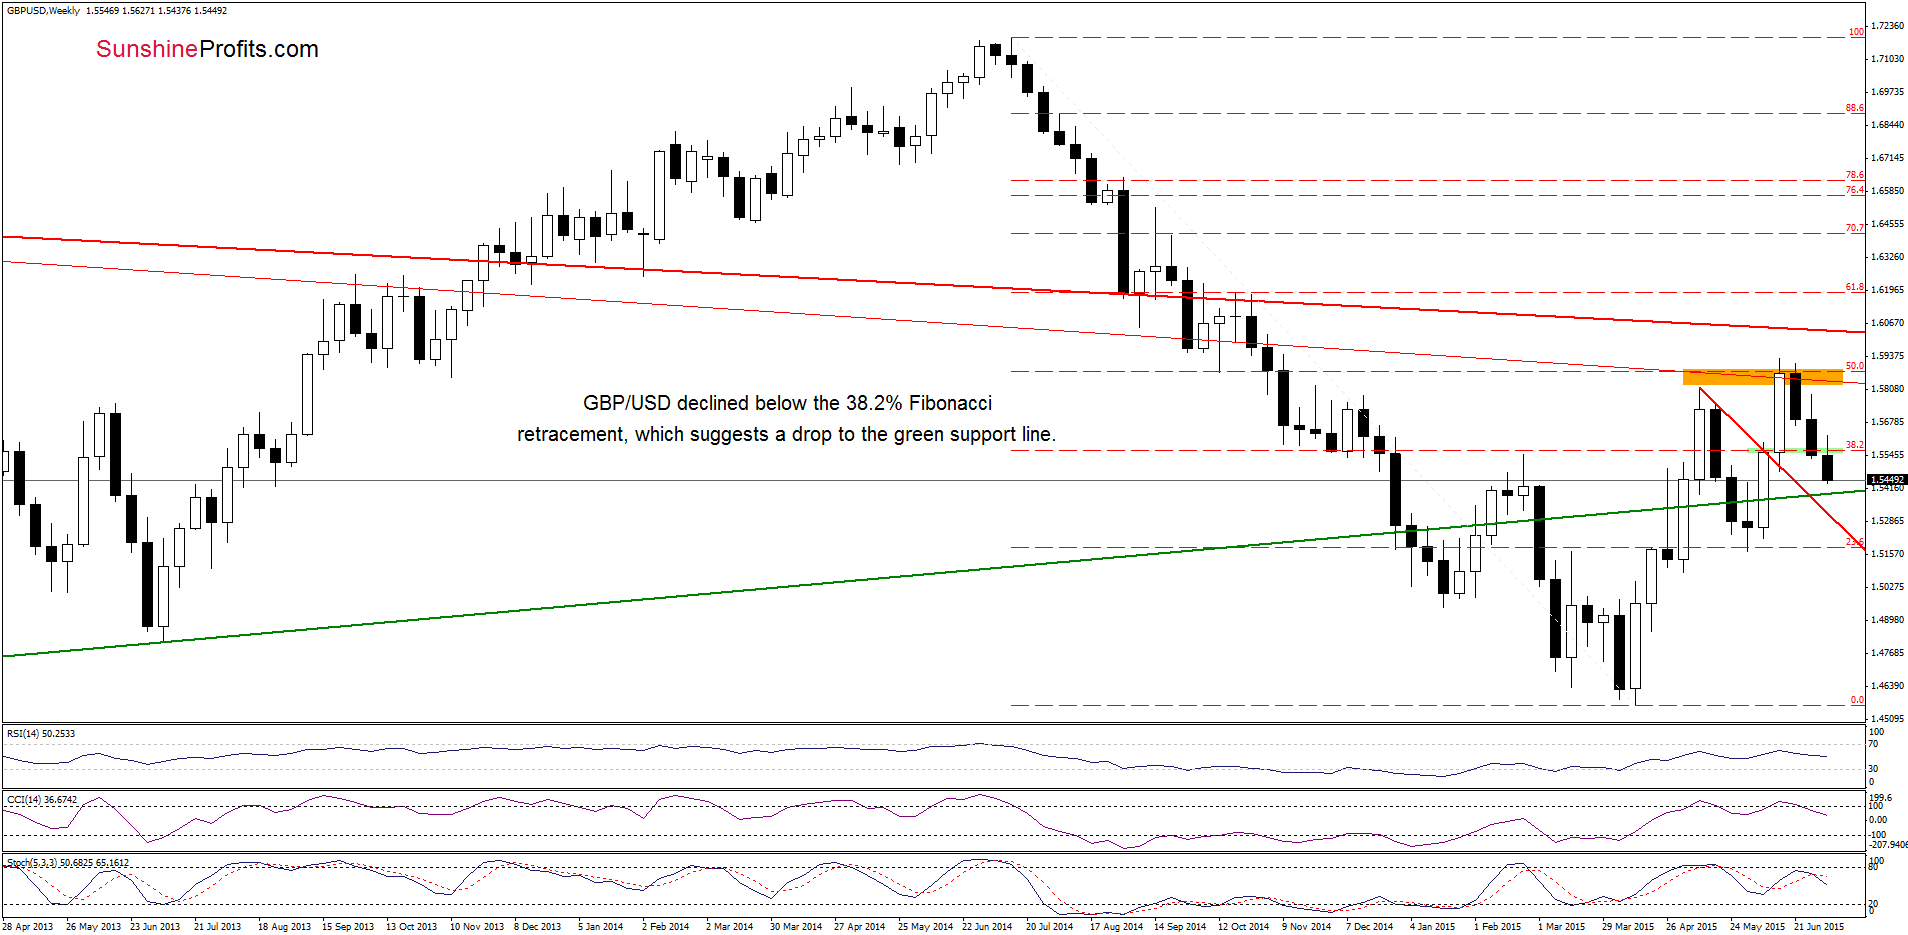
On the weekly chart, we see that GBP/USD extended losses and declined below the previously-broken 38.2% Fibonacci retracement, which triggered further deterioration.
How did this move affect the very short-term picture? Let’s take a closer look at the daily chart and find out.
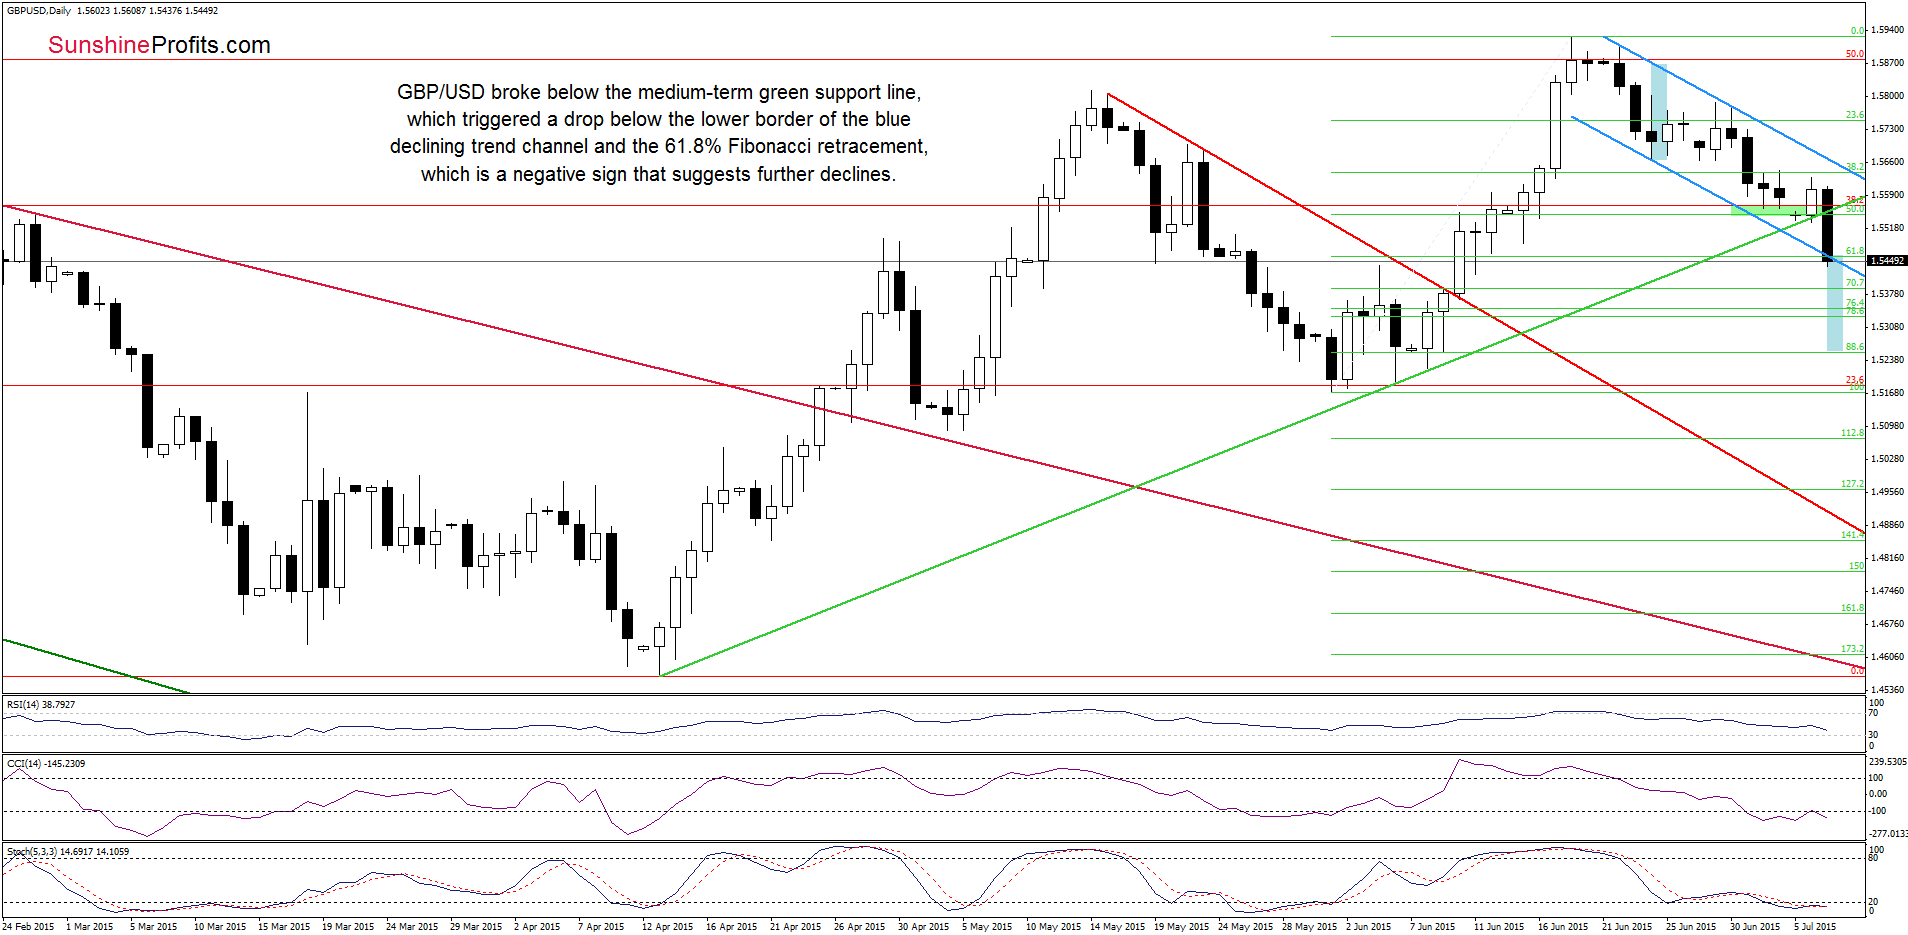
Looking at the daily chart we see that although GBP/USD rebounded slightly yesterday, the pair reversed and declined sharply, erasing all gains earlier today. With this downswing, the exchange rate broke below the medium-term green support line, which triggered a drop below the lower border of the blue declining trend channel and the 61.8% Fibonacci retracement (based on the June rally). Taking these negative signals into account, we think that further deterioration is more likely than not. Therefore, if the pair closes today’s session under the blue resistance line, we could see a decline even to around 1.5258, where the size of the downward move will correspond to the height of the channel and where the 88.6% Fibonacci retracement is.
Very short-term outlook: mixed with bearish bias
Short-term outlook: mixed
MT outlook: mixed
LT outlook: mixed
Trading position (short-term; our opinion): No positions are justified from the risk/reward perspective at the moment. We will keep you informed should anything change, or should we see a confirmation/invalidation of the above.
USD/CHF
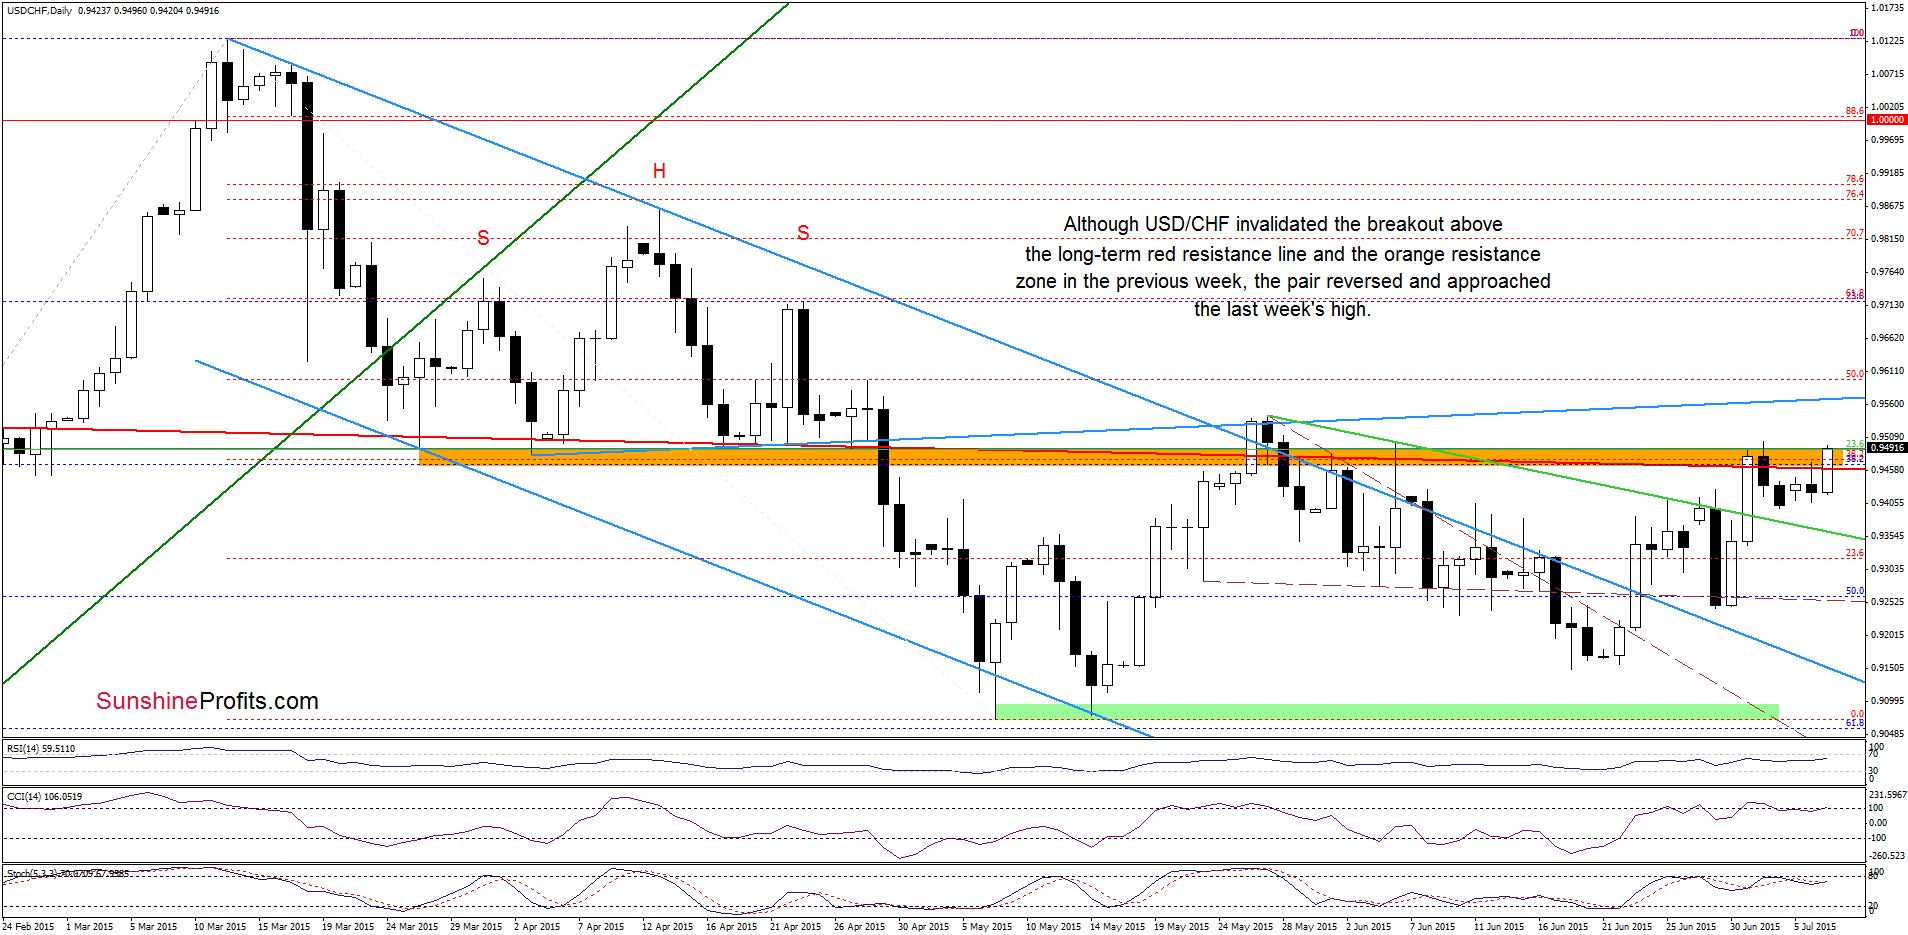
From today’s point of view we see that although USD/CHF invalidated the breakout above the orange resistance zone and the long term red line in the previous week, the exchange rate reversed and climbed above them once again. This is a positive signal, which suggests further improvement. However, in our opinion, this move will be more reliable if we see a daily close above this resistance area. If this is the case, and we see such price action, USD/CHF could increase to 0.9542 (the May high) or even to 0.9566, where the blue resistance line is.
Very short-term outlook: mixed with bullish bias
Short-term outlook: mixed
MT outlook: mixed
LT outlook: mixed
Trading position (short-term; our opinion): No positions are justified from the risk/reward perspective at the moment. We will keep you informed should anything change, or should we see a confirmation/invalidation of the above.
Thank you.
Nadia Simmons
Forex & Oil Trading Strategist
Forex Trading Alerts
Oil Investment Updates
Oil Trading Alerts
