

Forex Trading Alert originally sent to subscribers on July 2, 2015, 10:37 AM.
Earlier today, the Labor Department reported that the economy added 223,000 jobs in June, missing expectations for a growth of 230,000. Additionally, a separate report showed that the initial jobless claims in the week ending June 27 increased by 10,000, also missing analysts expectations for a 1,000 drop. Thanks to these disappointing numbers, USD/JPY bounced down the short-term resistance, erasing all today’s gains. What’s next?
In our opinion the following forex trading positions are justified - summary:
EUR/USD
The situation in the medium term hasn’t changed much as the combination of the previously-broken long-term red declining line and the 23.6% Fibonacci retracement continues to keep gains in check. Today, we’ll focus on the very short-term changes.
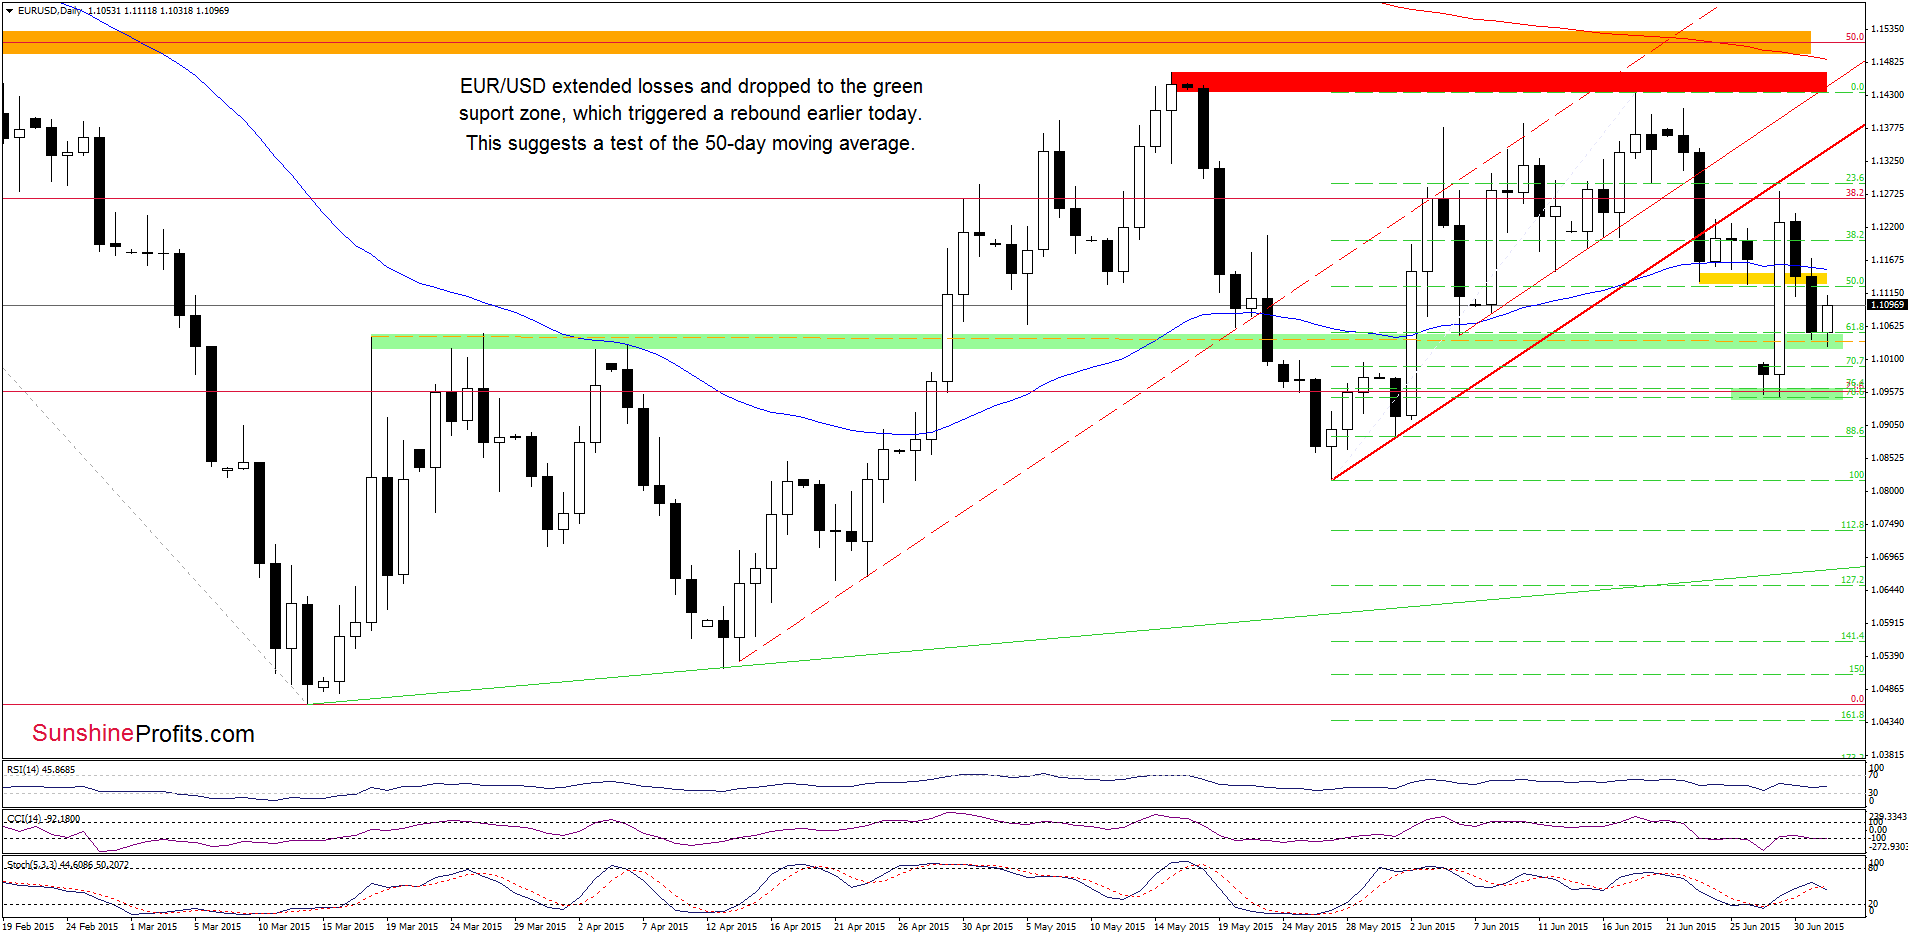
Yesterday, we wrote the following:
EUR/USD declined and closed the day under the 50-day moving average (…). Although currency bulls tried to push the pair above this resistance, they failed, which resulted in a drop under the yellow support zone earlier today. This is a negative signal, which suggests further deterioration and a test of the green support zone in the coming day(s).
Looking at the daily chart, we see that the situation developed in line with the above scenario and EUR/USD reached our downside target. As you see on the chart, the green support area encouraged currency bulls to act, which resulted in a rebound. This suggests a test of the previously-broken yellow resistance area (created by the 50-day moving average and the last week’s lows) in the coming day(s). If it withstands the buying pressure and the exchange rate declines from there, it would be a negative signal, which will suggest that today’s upswing is nothing more than a verification of the breakdown. In this case, we’ll see another pullback and the initial downside target would be today’s low and the green support zone.
Very short-term outlook: mixed with bearish bias
Short-term outlook: mixed
MT outlook: mixed
LT outlook: mixed
Trading position (short-term; our opinion): No positions are justified from the risk/reward perspective at the moment. We will keep you informed should anything change, or should we see a confirmation/invalidation of the above.
USD/JPY
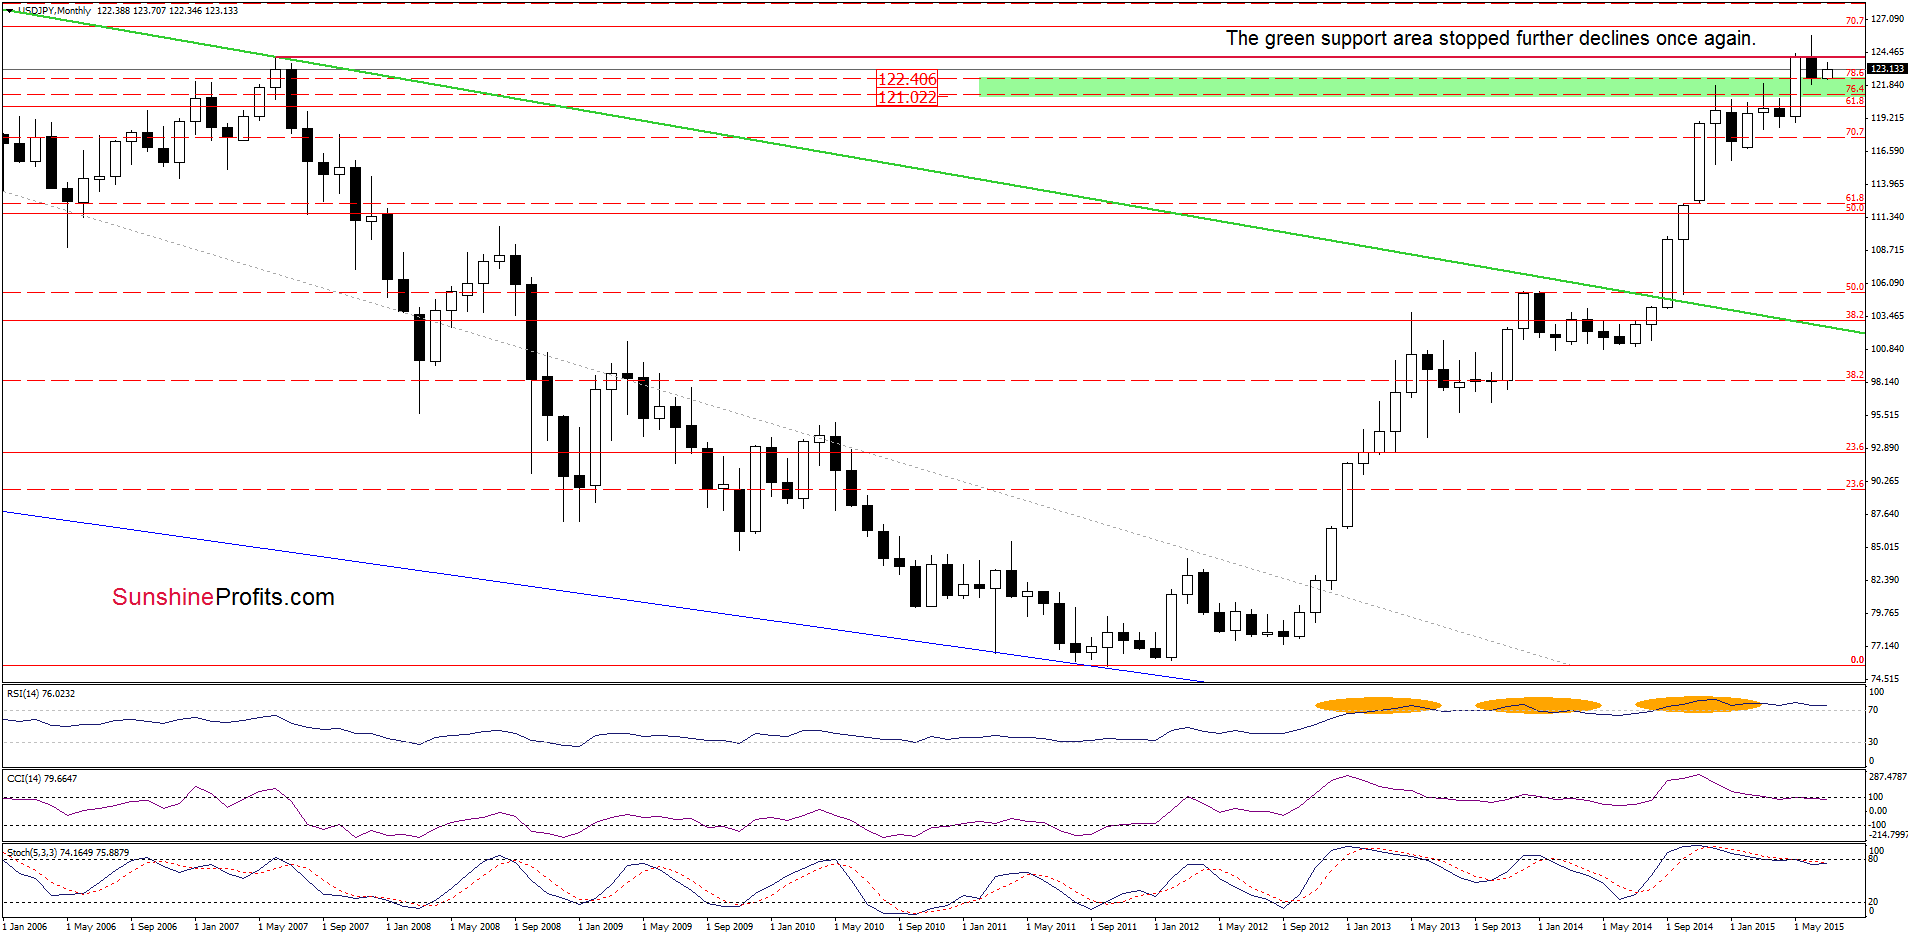
On the above chart, we see that the green support zone created by the previously-broken 76.4% and 78.6% Fibonacci retracement levels stopped further deterioration, triggering a rebound once again.
What impact did this move have on the very short-term picture? Let’s examine the daily chart and find out.
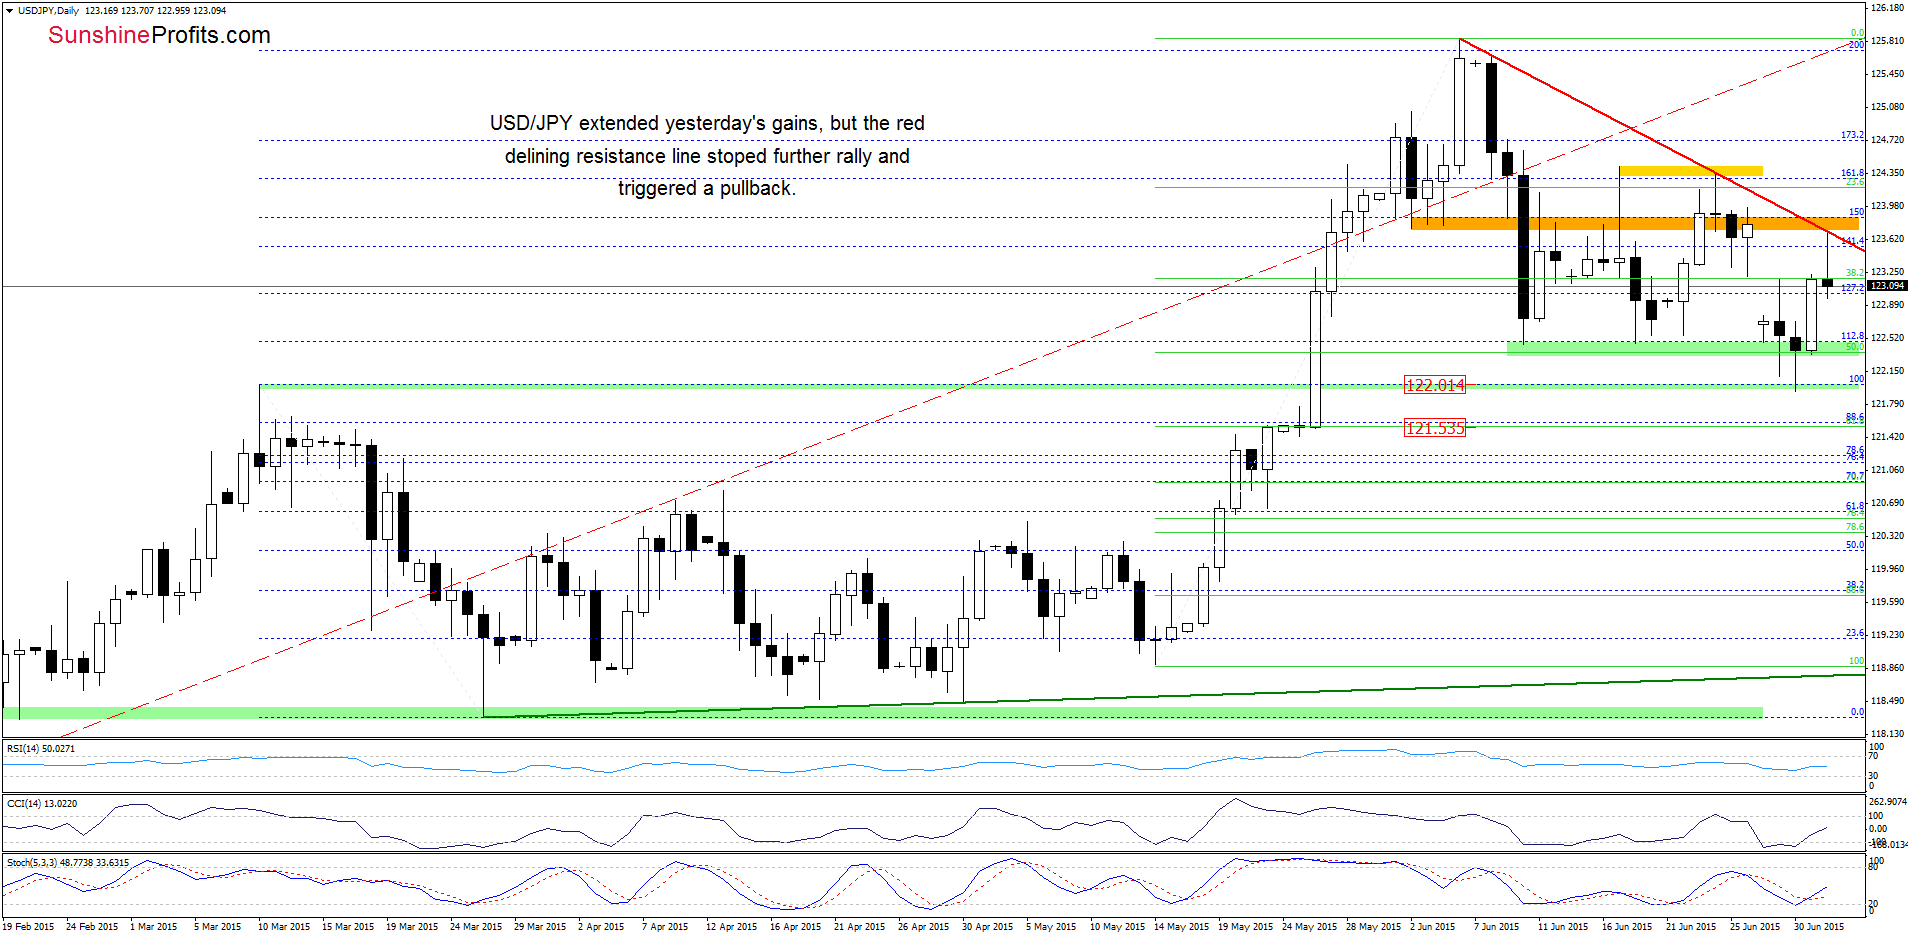
From today’s point of view, we see that USD/JPY opened this week well below Friday’s close, which triggered further deterioration in the following days. With the recent downward move, the exchange rate reached not only the green support zone created by the June lows, but also slipped to the support level based on the Mar high. Despite this deterioration, currency bulls managed to push the pair higher, which resulted in an increase to the red declining line (it was strong enough to stop further improvement and trigger a decline in the previous week) and the orange resistance zone. As you see on the chart, this area stopped further rally and the pair erased all today’s gains. This suggests that we could see a drop to around 122.82 (the 50% Fibonacci retracement based on this week’s rebound) or even to the support area created by the 76.4% and 78.6% retracements (around 122.35) in the coming day(s). Please keep in mind that that as long as there is no breakout above the orange area, further improvement is not likely to be seen.
Very short-term outlook: mixed with bearish bias
Short-term outlook: mixed
MT outlook: mixed
LT outlook: bullish
Trading position (short-term; our opinion): No positions are justified from the risk/reward perspective at the moment. We will keep you informed should anything change, or should we see a confirmation/invalidation of the above.
AUD/USD
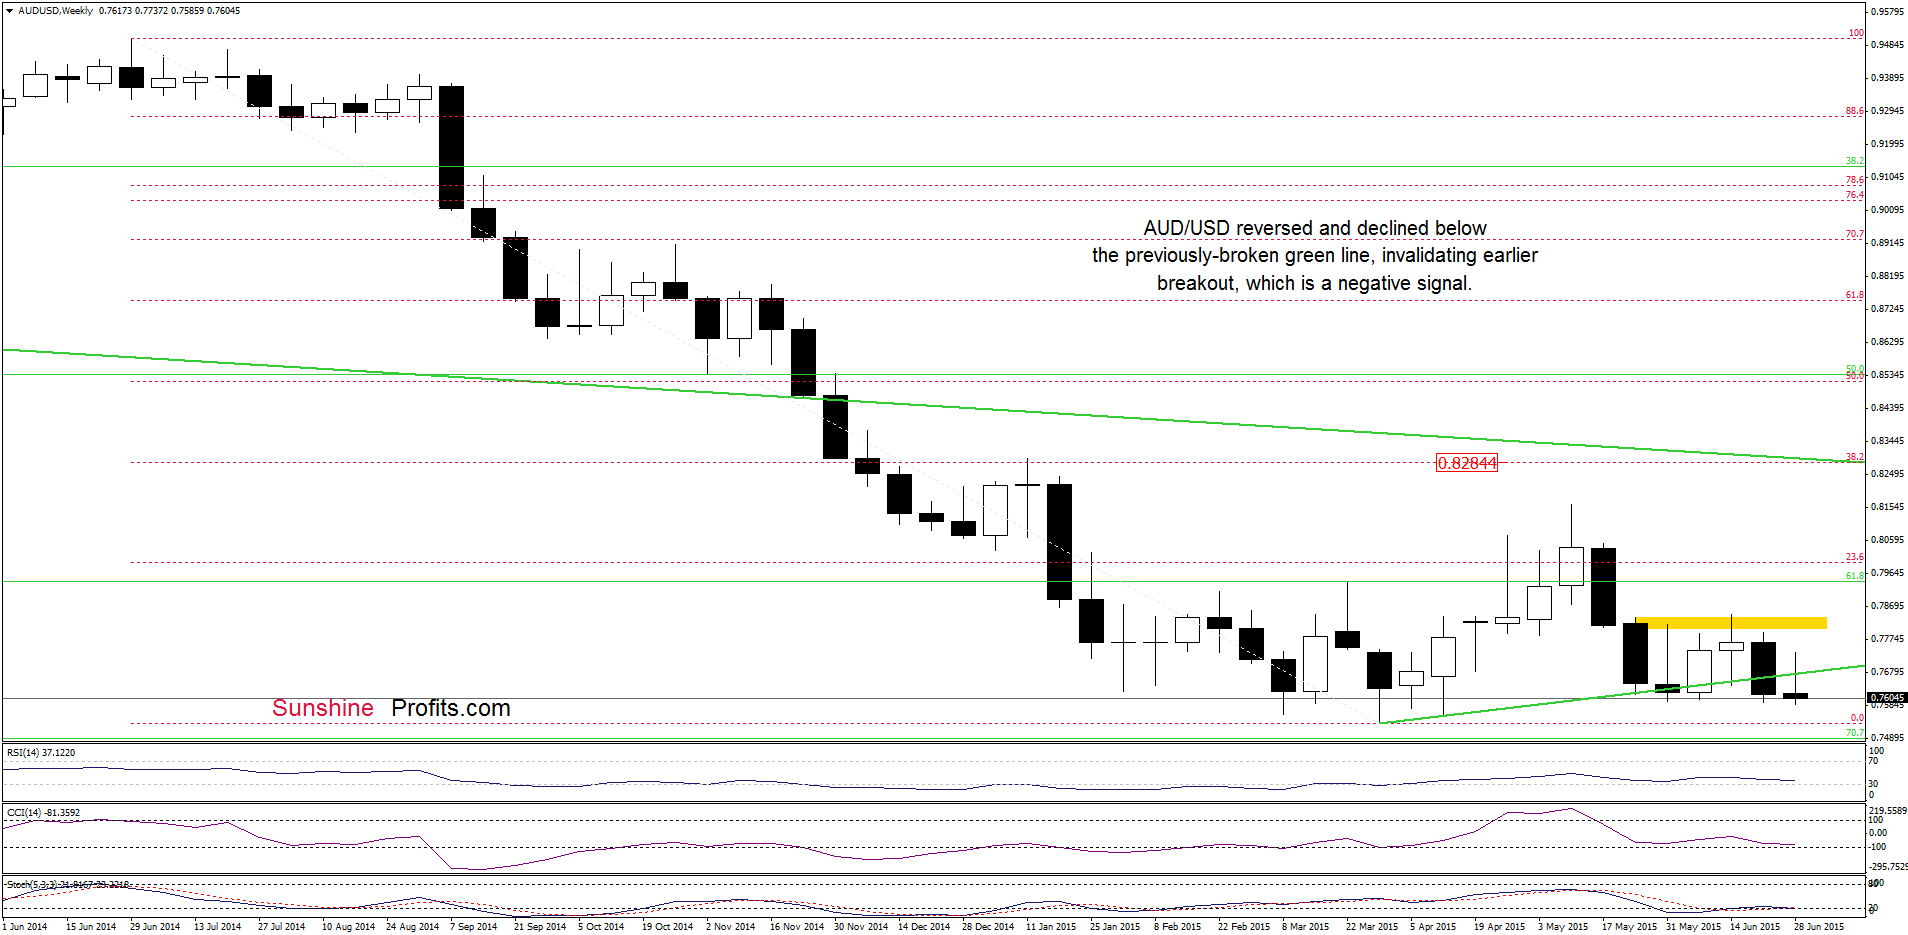
As you see on the weekly chart, AUD/USD reversed and declined below the previously-broken green support line, invalidating earlier breakout.
How did this drop affect the very short-term picture? Let’s check.
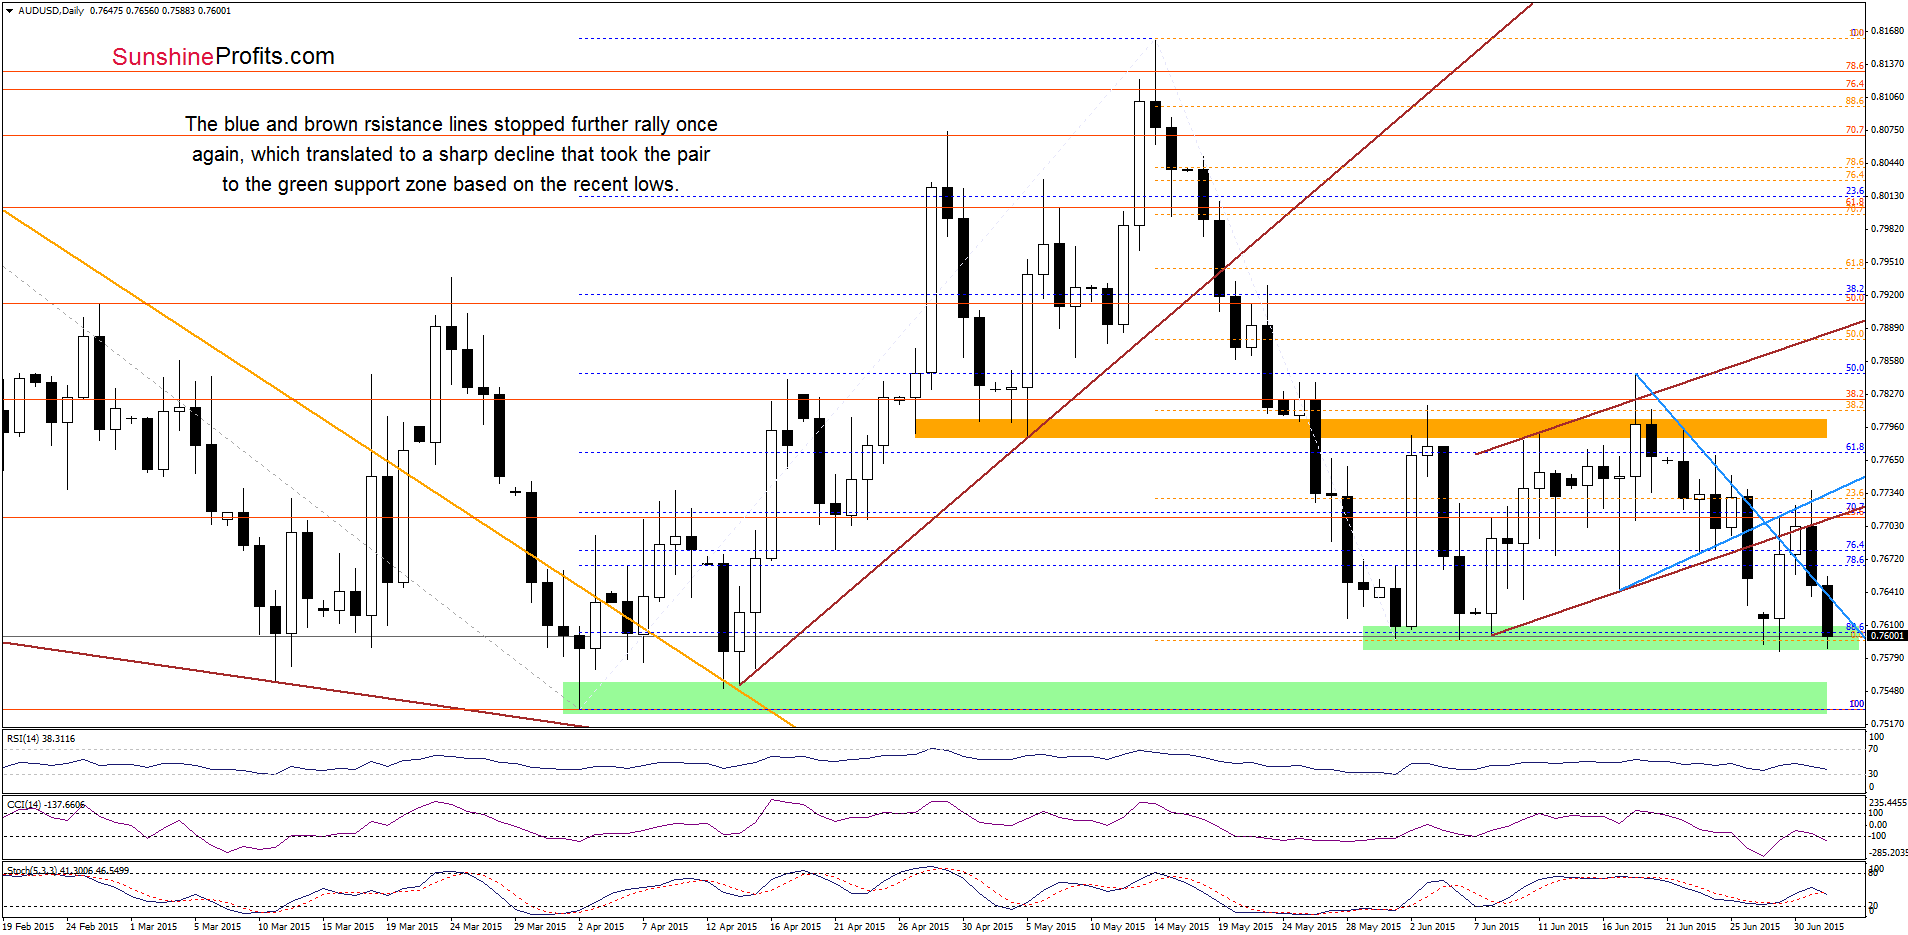
Looking at the daily chart, we see that the brown and blue resistance lines withstood the buying pressure and successfully stopped further rally earlier this week. As a result, AUD/USD declined sharply and reached the green support zone created by the June lows. In the previous week, this area encouraged currency bulls to act, which translated to a sharp rebound. Taking this fact into account, it seems that we could see similar price action later today. Nevertheless, before we see such price action, currency bulls will have to push AUD/USD above the blue declining resistance line. In this case, another upswing to the key resistance lines will be more likely. However, if they fail, and the pair drops under the support zone, we’ll likely see a decline to the Apr lows.
Very short-term outlook: mixed
Short-term outlook: mixed
MT outlook: mixed
LT outlook: mixed
Trading position (short-term; our opinion): No positions are justified from the risk/reward perspective at the moment. We will keep you informed should anything change, or should we see a confirmation/invalidation of the above.
Thank you.
Nadia Simmons
Forex & Oil Trading Strategist
Przemyslaw Radomski, CFA
Founder, Editor-in-chief
Gold & Silver Trading Alerts
Forex Trading Alerts
Oil Investment Updates
Oil Trading Alerts
