

Forex Trading Alert originally sent to subscribers on June 16, 2015, 7:57 AM.
Earlier today, EUR/USD reversed and declined under 1.1300 once again as ongoing worries over Greece’s future in the euro zone (after talks between Greece and its international creditors ended without an agreement) weighed on investors’ sentiment. Will we see the common currency below 1.1200 in the coming days?
In our opinion the following forex trading positions are justified - summary:
- EUR/USD: Short positions (stop-loss order at 1.1667)
- GBP/USD: Short positions (stop-loss order at 1.5913)
- USD/JPY: none
- USD/CAD: Long positions (stop-loss order at 1.1706)
- USD/CHF: none
- AUD/USD: Short positions (stop-loss order at 0.8194)
EUR/USD
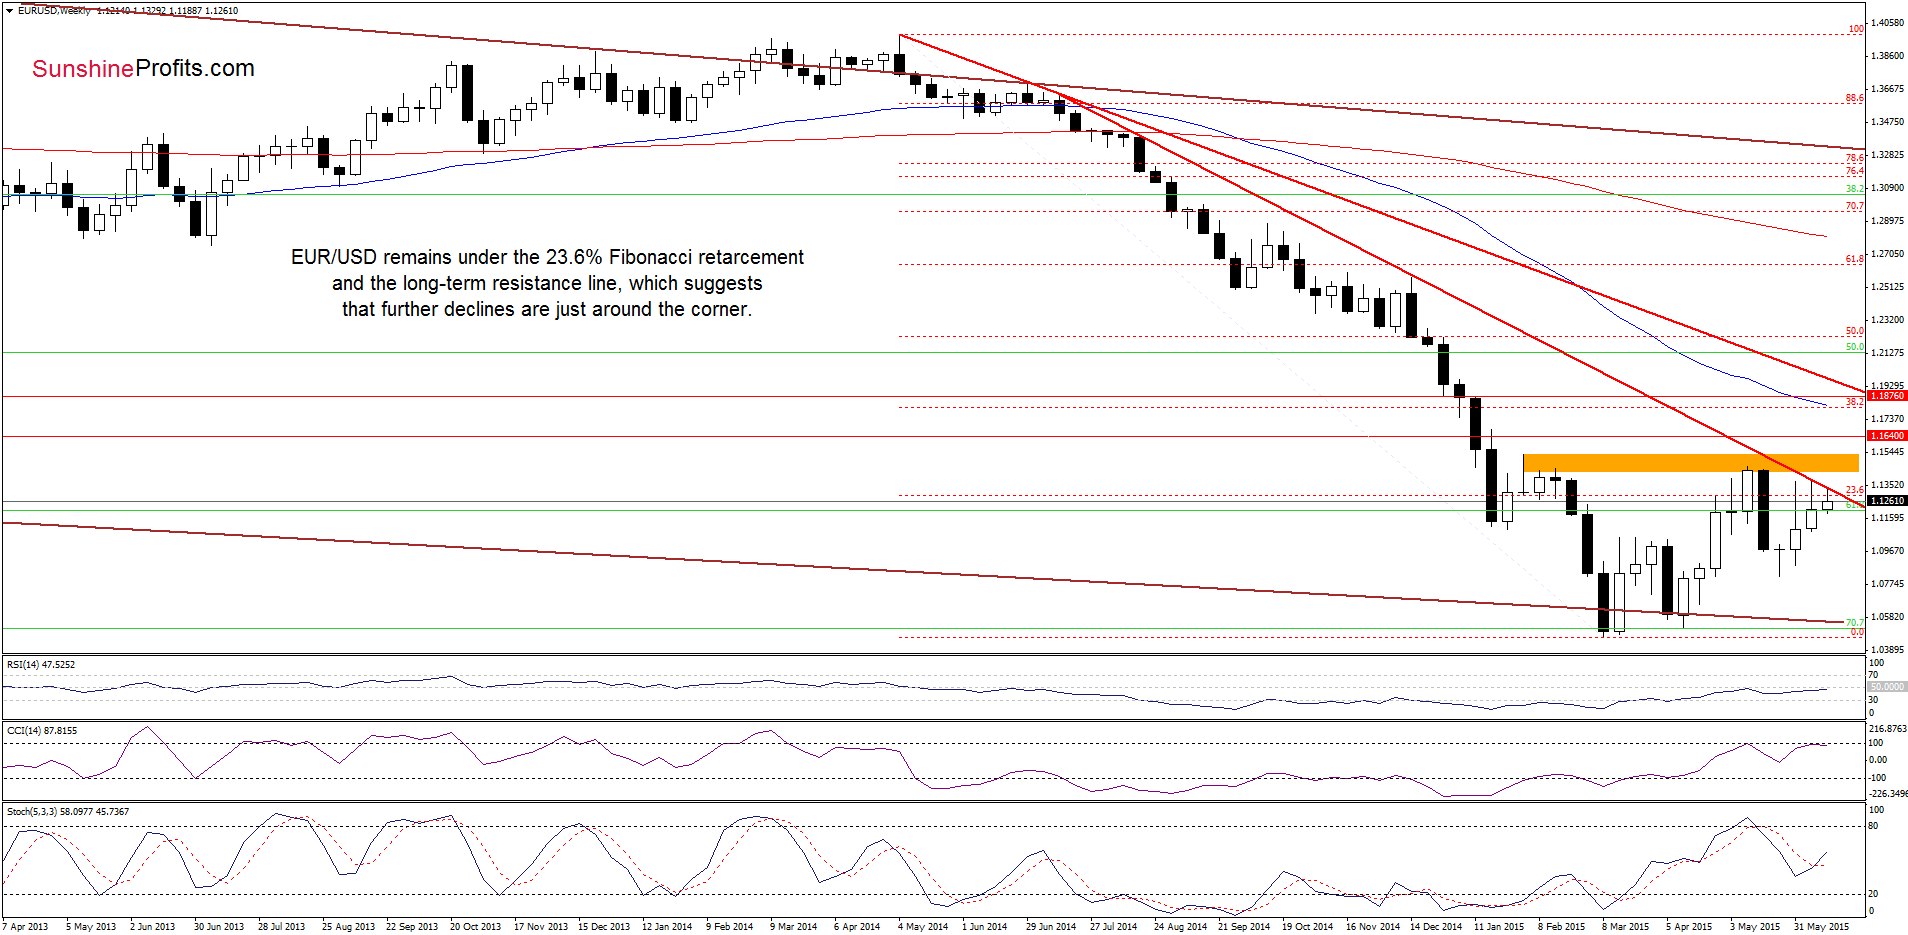
The medium-term picture hasn’t changed much as EUR/USD is trading below the long-term red declining line and the 23.6% Fibonacci retracement, which suggests that as long as there is no successful breakout above these levels further improvement is not likely to be seen and further declines should not surprise us.
Can we infer something more from the very short-term picture? Let’s examine the daily chart and find out.
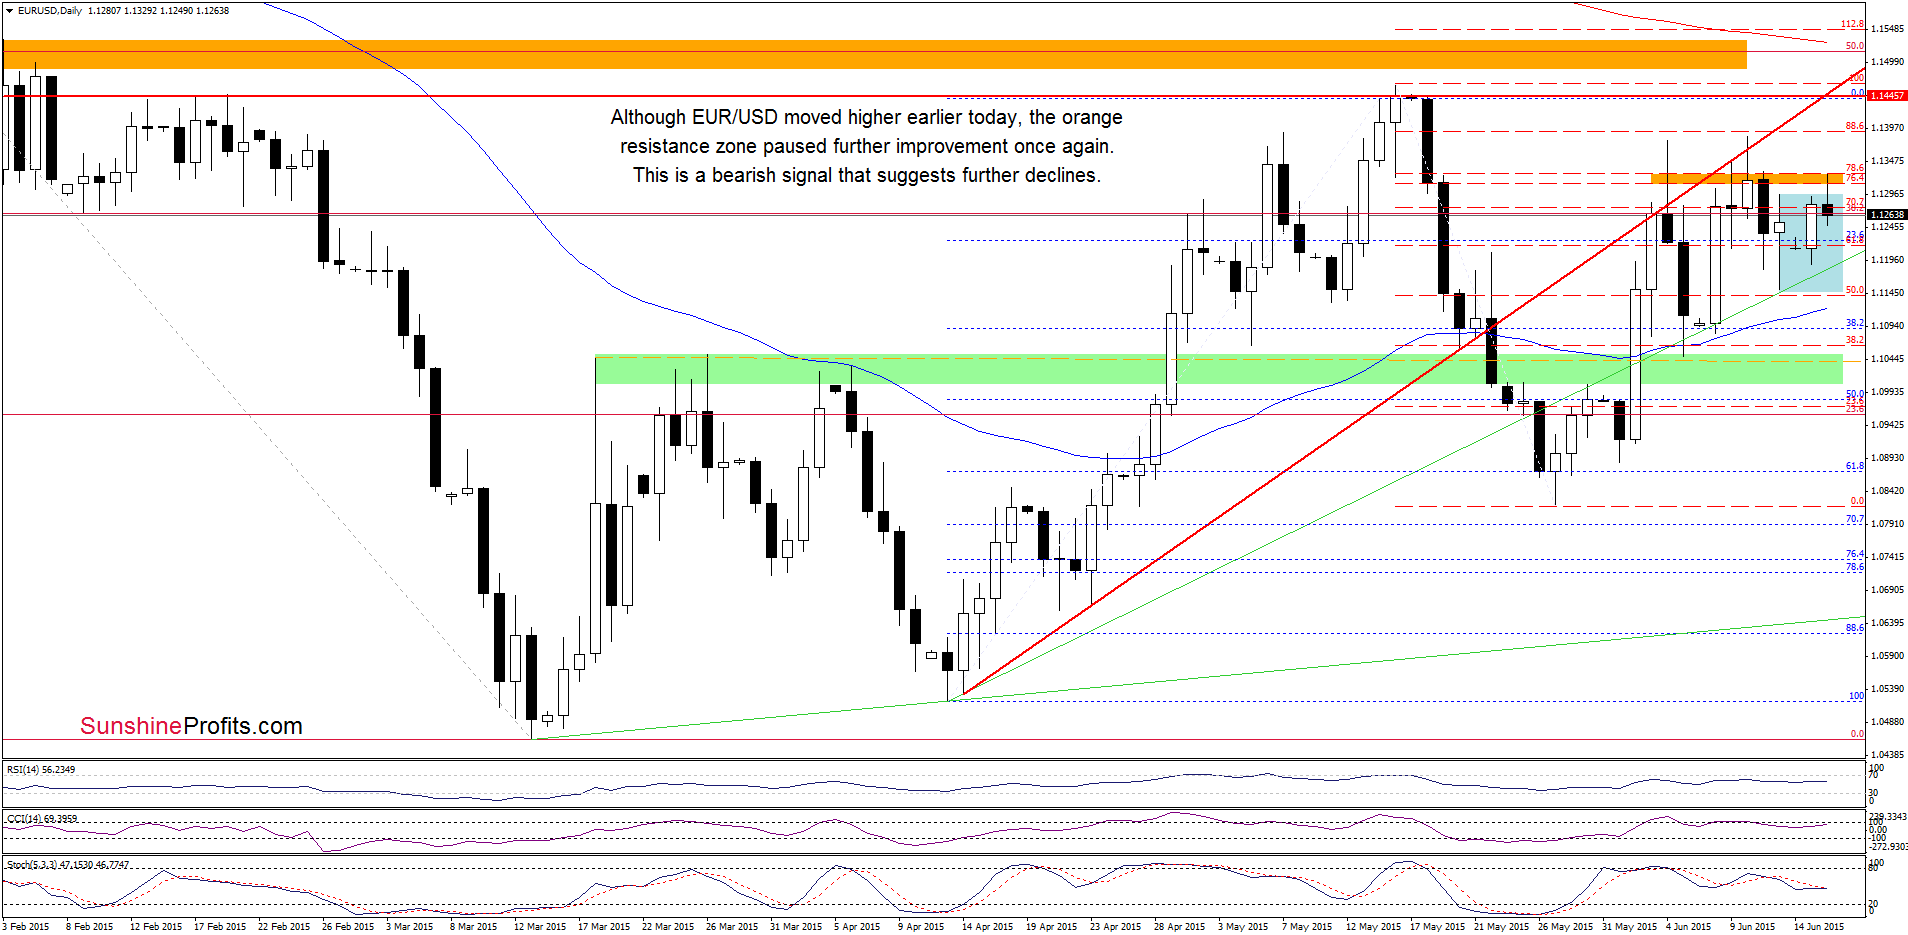
Earlier today, EUR/USD moved extended yesterday’s rally and broke above the upper line of the consolidation (marked with blue). Despite this improvement, the orange resistance zone stopped further improvement once again (similarly to what we saw in previous weeks). Taking this fact into account, and combining it with sell signals generated by the indicators, we believe that the next move will be to the downside. If the pair extends losses in the following hours, the initial downside target would be around 1.1180, where the green support line is.
Finishing today’s commentary on this currency pair, please keep in mind that EUR/USD is trading in a consolidation (marked with blue), therefore, a potential breakdown under the green line will trigger a drop to the lower border of the formation (at 1.1150). If it is broken, we’ll see a test of the 50-day moving average (currently at 1.1120) or even the green support zone (1.1000-1.1050) in the coming days.
Very short-term outlook: bearish
Short-term outlook: mixed with bearish bias
MT outlook: mixed
LT outlook: mixed
Trading position (short-term; our opinion): Short positions (which are profitable) with a stop-loss order at 1.1667 are justified from the risk/reward perspective at the moment. We will keep you informed should anything change, or should we see a confirmation/invalidation of the above.
USD/JPY
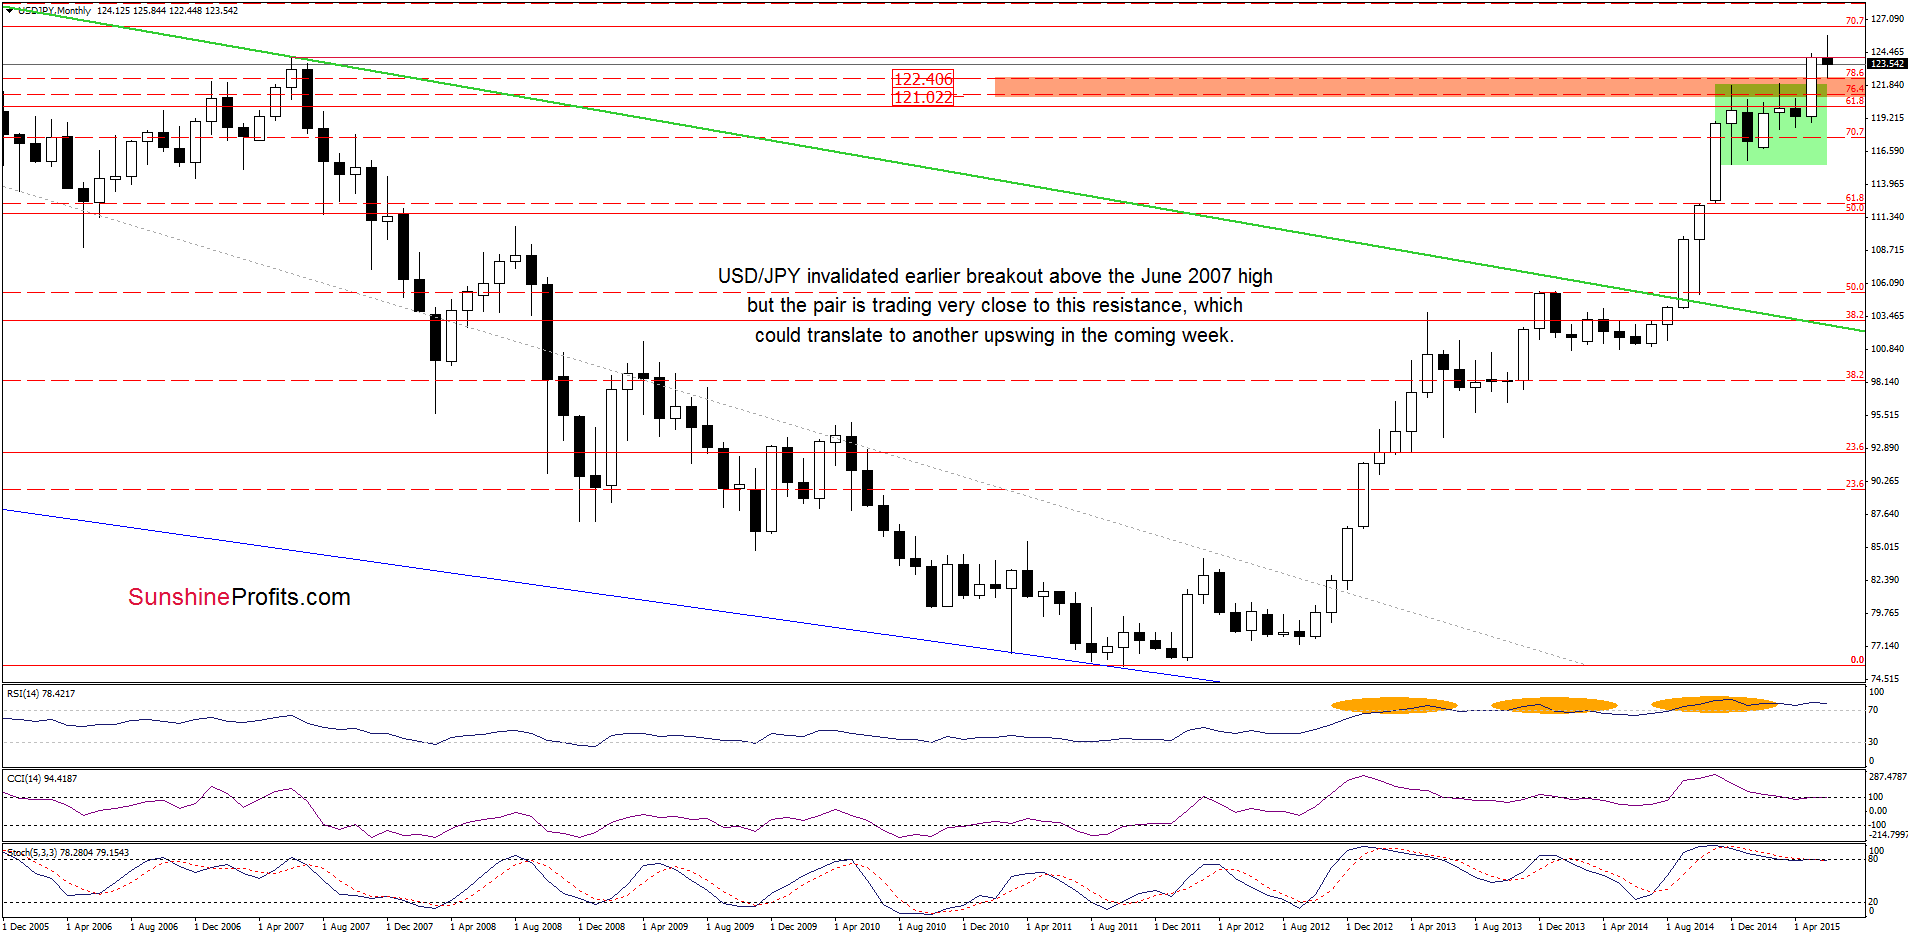
From this perspective we see that the situation in the medium term hasn’t changed much as USD/JPY is trading very close to the resistance level (the June 2007 high), which could translate to another upswing in the coming week.
Will we see such price action? Let’s focus on the daily chart and look for more clues about future moves.
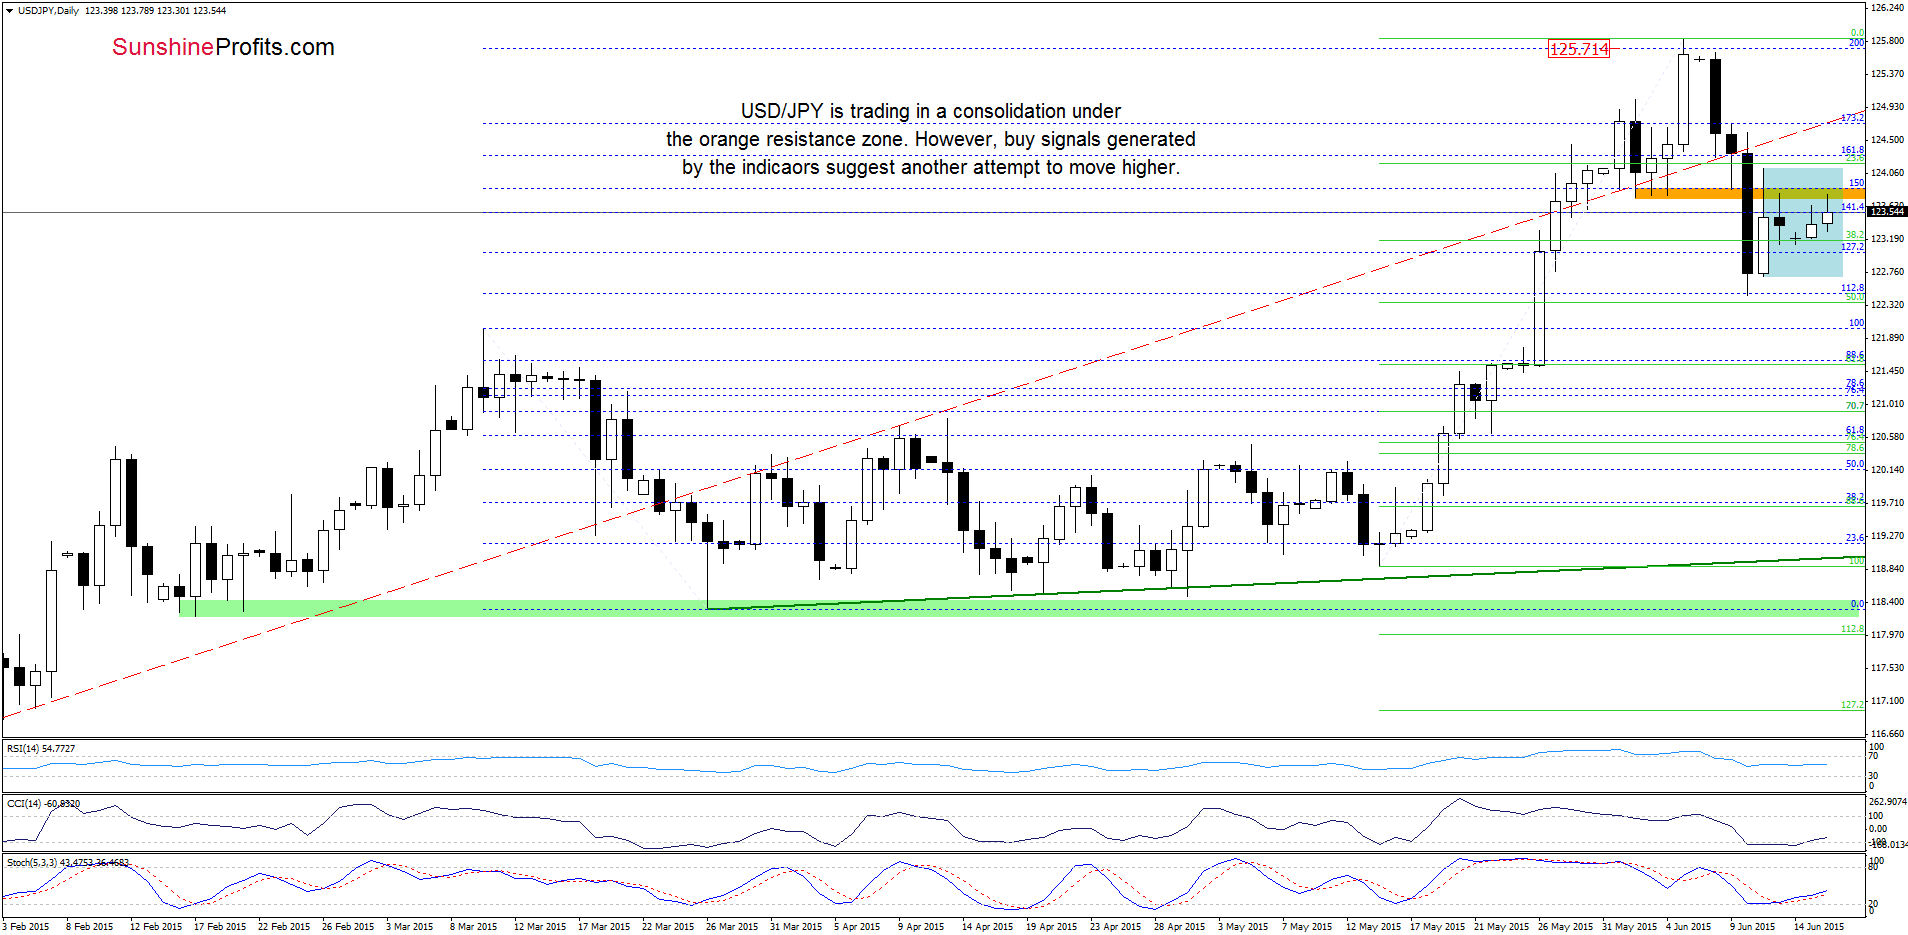
Looking at the daily chart, we see that USD/JPY is trading in a consolidation (marked with blue) under the orange resistance zone. Although there were several unsuccessful attempts to move higher, the current position of the indicators suggests that currency bulls will try to break above the resistance area in the coming days. Nevertheless, we should keep in mind that further improvement will be more reliable if we see a daily close above this zone. If we see such rice action, the next level to break will be the red dashed line, which serves now as resistance (around 124.70).
Very short-term outlook: mixed
Short-term outlook: mixed
MT outlook: mixed
LT outlook: bullish
Trading position (short-term; our opinion): No positions are justified from the risk/reward perspective at the moment. We will keep you informed should anything change, or should we see a confirmation/invalidation of the above.
USD/CAD
The situation in the medium term remains almost unchanged as USD/CAD is trading between last week’s high and low, but above the long-term green support line, which triggered a rebound in the previous week.
Where the exchange rate head next in the coming days? Let’s check the daily chart and find out what can we infer from it.
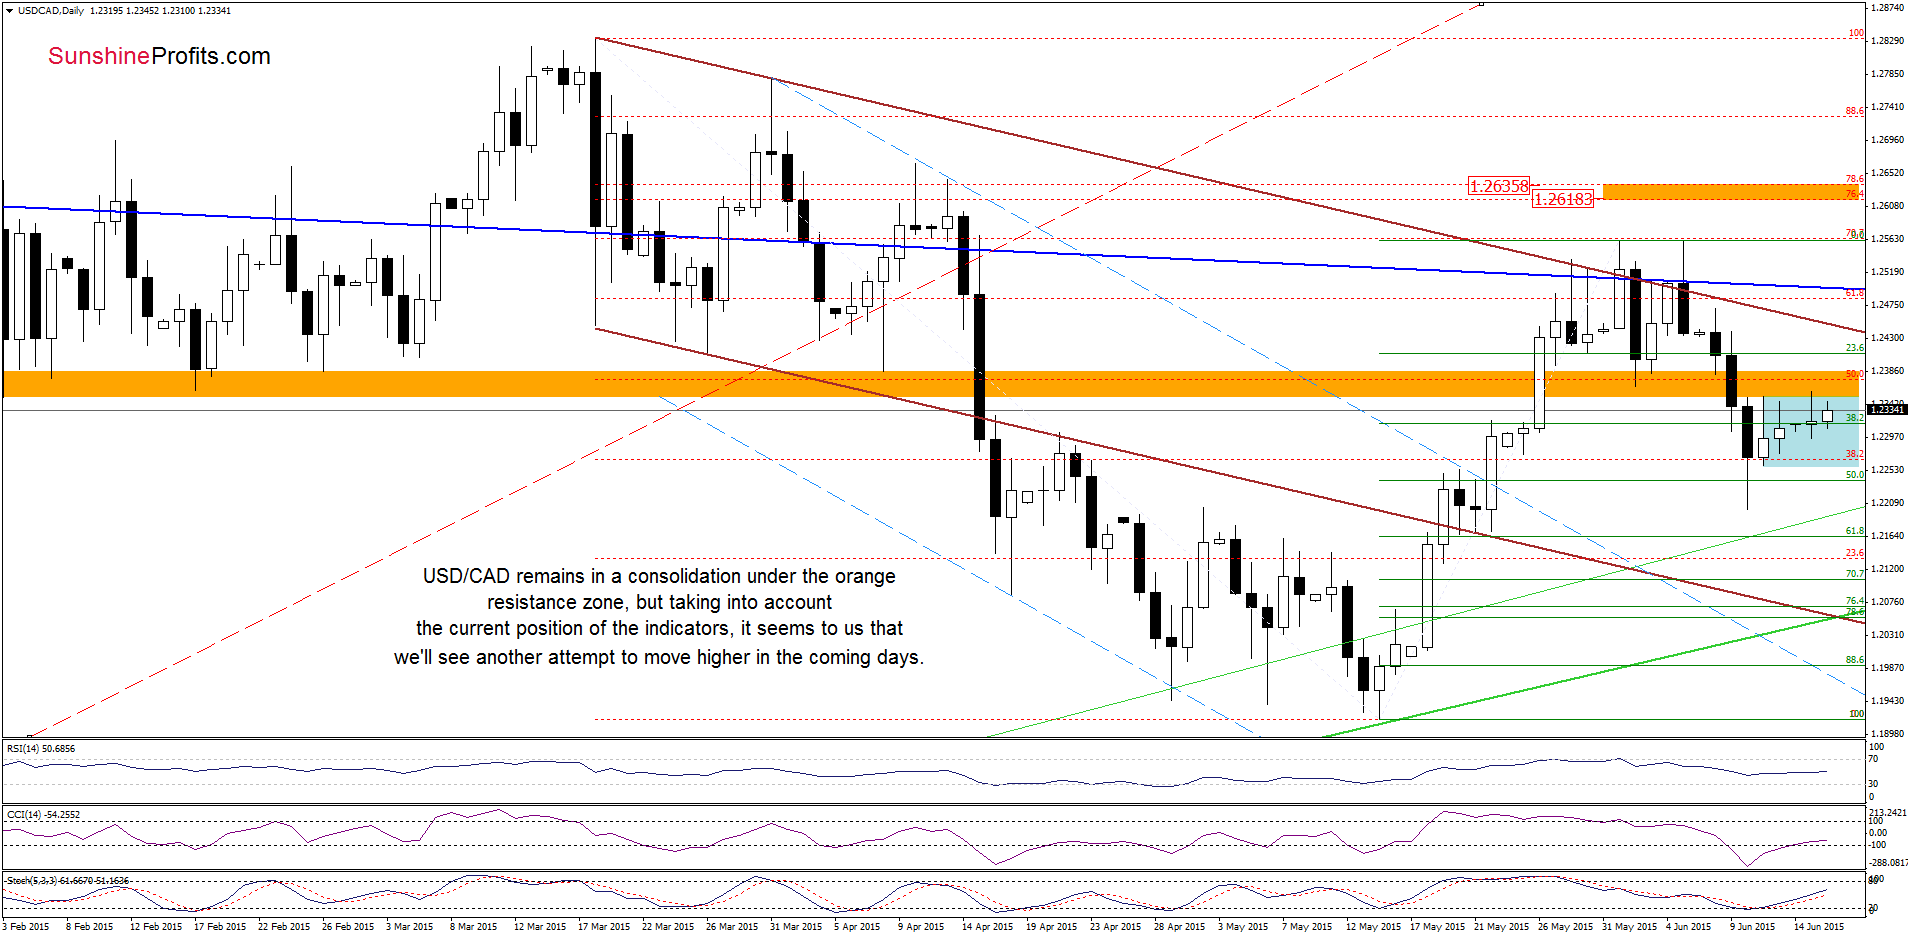
From this perspective, we see that USD/CAD is trading in the blue consolidation slightly below the orange resistance zone. As you see on the above chart, although currency bulls tried to push the pair higher in recent days, they didn’t manage to break above this important resistance area. Will we see higher values of USD/CAD in the coming days? Taking into account the current position of the indicators (the CCI and Stochastic Oscillator generated buy signals) it seems to us that further improvement is just around the corner. Nevertheless, further rally will be more likely if USD/CAD closes the day above the orange resistance area.
Very short-term outlook: bullish
Short-term outlook: mixed with bullish bias
MT outlook: mixed
LT outlook: mixed
Trading position (short-term; our opinion): Long positions (which are profitable) with a stop-loss order at 1.1706 are justified from the risk/reward perspective at the moment. We will keep you informed should anything change, or should we see a confirmation/invalidation of the above.
Thank you.
Nadia Simmons
Forex & Oil Trading Strategist
Przemyslaw Radomski, CFA
Founder, Editor-in-chief
Gold & Silver Trading Alerts
Forex Trading Alerts
Oil Investment Updates
Oil Trading Alerts
