

Forex Trading Alert originally sent to subscribers on June 4, 2015, 11:34 AM.
Earlier today, the U.S. Department of Labor reported that the number of initial jobless claims in the week ending May 30 declined by 8,000 to 276,000, beating analysts’ expectations for a 5,000 drop. Thanks to these positive numbers, EUR/USD declined and invalidated earlier breakouts. What impact could it have on future moves?
In our opinion the following forex trading positions are justified - summary:
- EUR/USD: Short positions (stop-loss order at 1.1667)
- GBP/USD: Short positions (stop-loss order at 1.5913)
- USD/JPY: none
- USD/CAD: Long positions (stop-loss order at 1.1706)
- USD/CHF: none
- AUD/USD: Short positions (stop-loss order at 0.8194)
EUR/USD
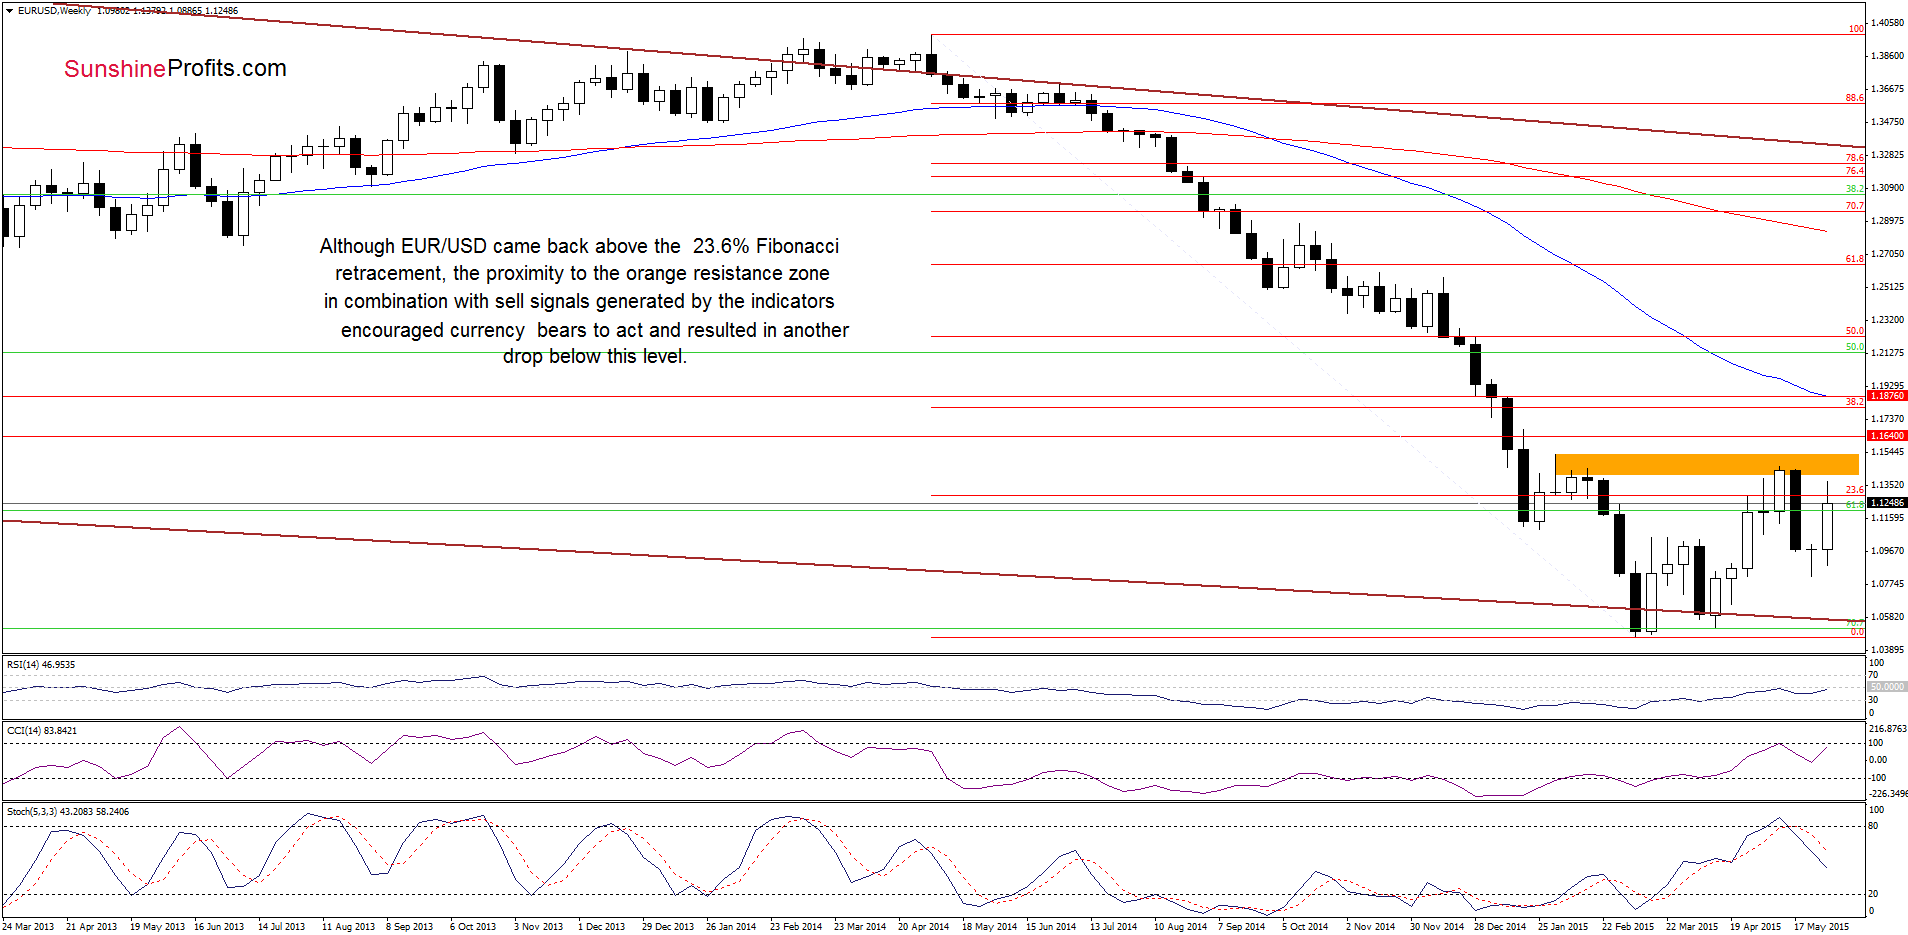
Looking at the weekly chart, we see that although EUR/USD oved higher earlier this week, climbing above the 23.6% Fibonacci retracement, the proximity to the orange resistance zone in combination with sell signals generated by the indicators encouraged currency bears to act, which resulted in a downswing and a comeback below this resistance level. This is a negative signal, which suggests further deterioration.
Where will the pair head next? Let’s examine the daily chart and find out.
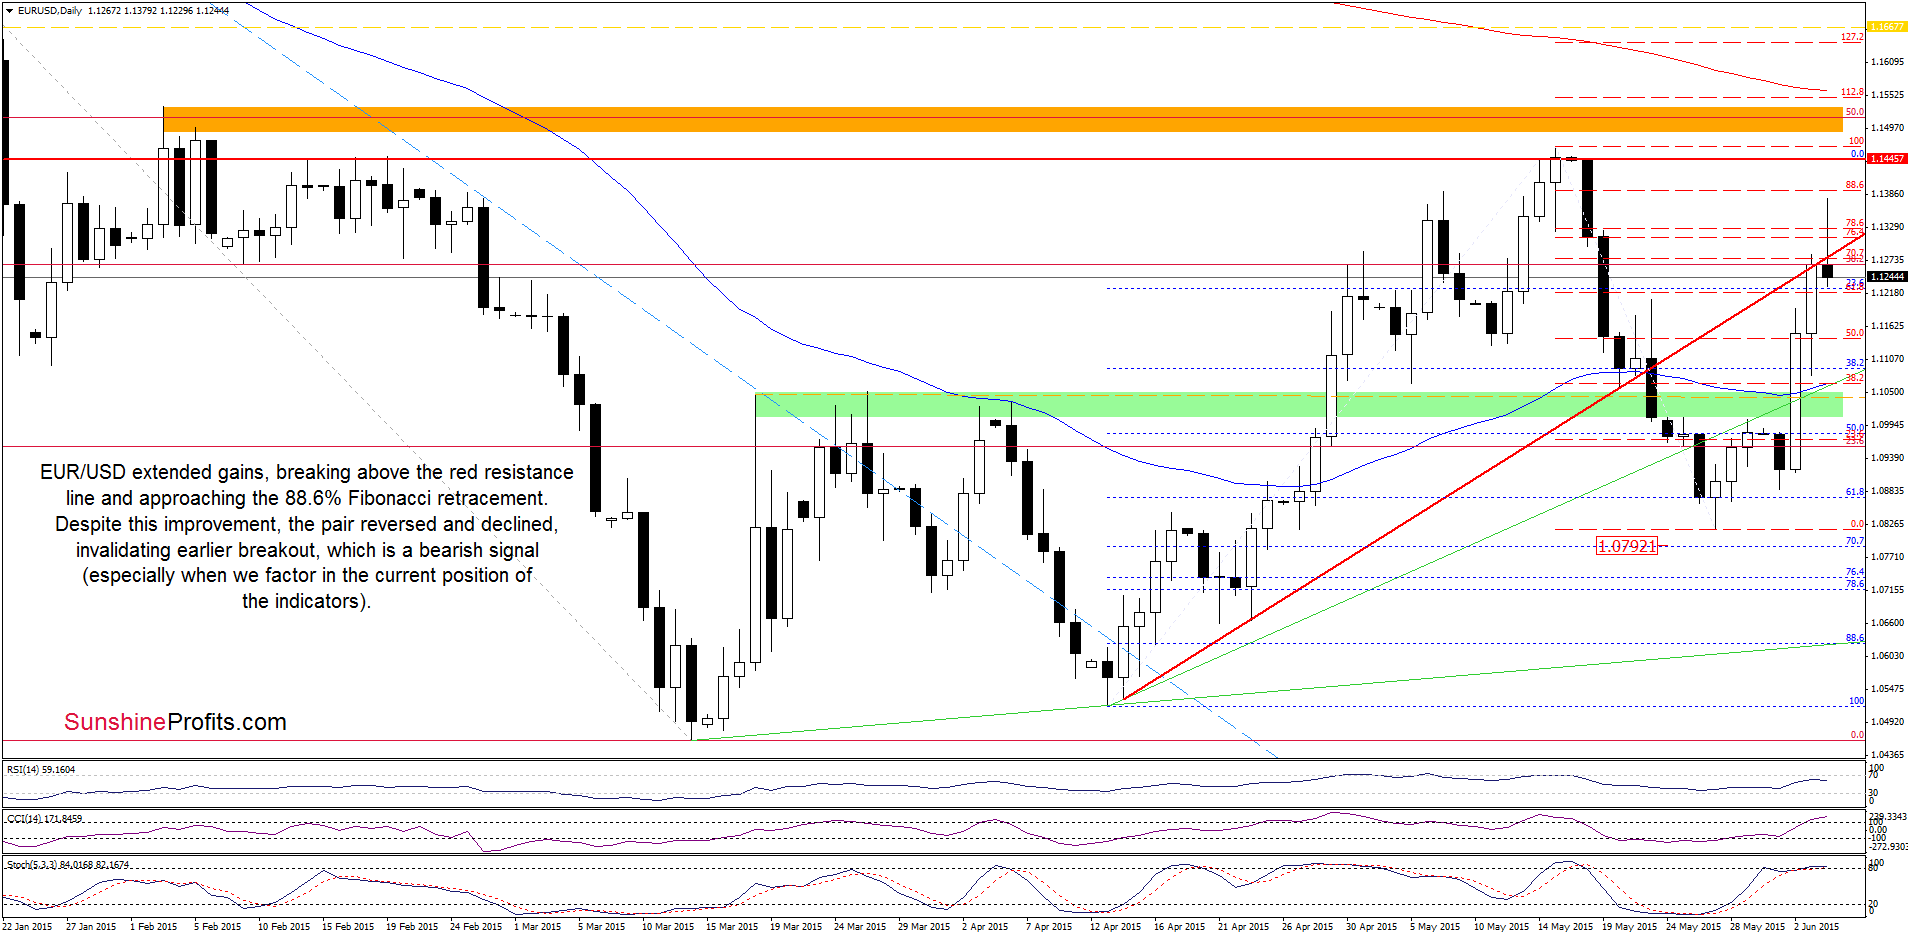
Yesterday, EUR/USD broke above the red resistance line, which triggered further rally earlier today. With today’s upswing, the exchange rate broke above the 76.4% and 78.6% Fibonacci retracements, approaching the 88.6% retracement. Despite this improvement, the pair reversed and declined, invalidating earlier breakouts, which is a bearish signal (which will be even more bearish if EUR/USD closes the day below the red line) that suggests further deterioration. If this is the case and the exchange rate declines lower from here, we’ll see a drop to around yesterday’s low of 1.1078 in the coming day(s). Please note that this scenario is reinforced by the current position of the indicators, which are overbought and very close to generate sell signals (in our opinion, declines will accelerate if we see them in the following days).
Very short-term outlook: bearish
Short-term outlook: mixed with bearish bias
MT outlook: mixed
LT outlook: mixed
Trading position (short-term; our opinion): Short positions (which are profitable) with a stop-loss order at 1.1667 are justified from the risk/reward perspective at the moment. We will keep you informed should anything change, or should we see a confirmation/invalidation of the above.
USD/JPY
On Tuesday, we wrote the following:
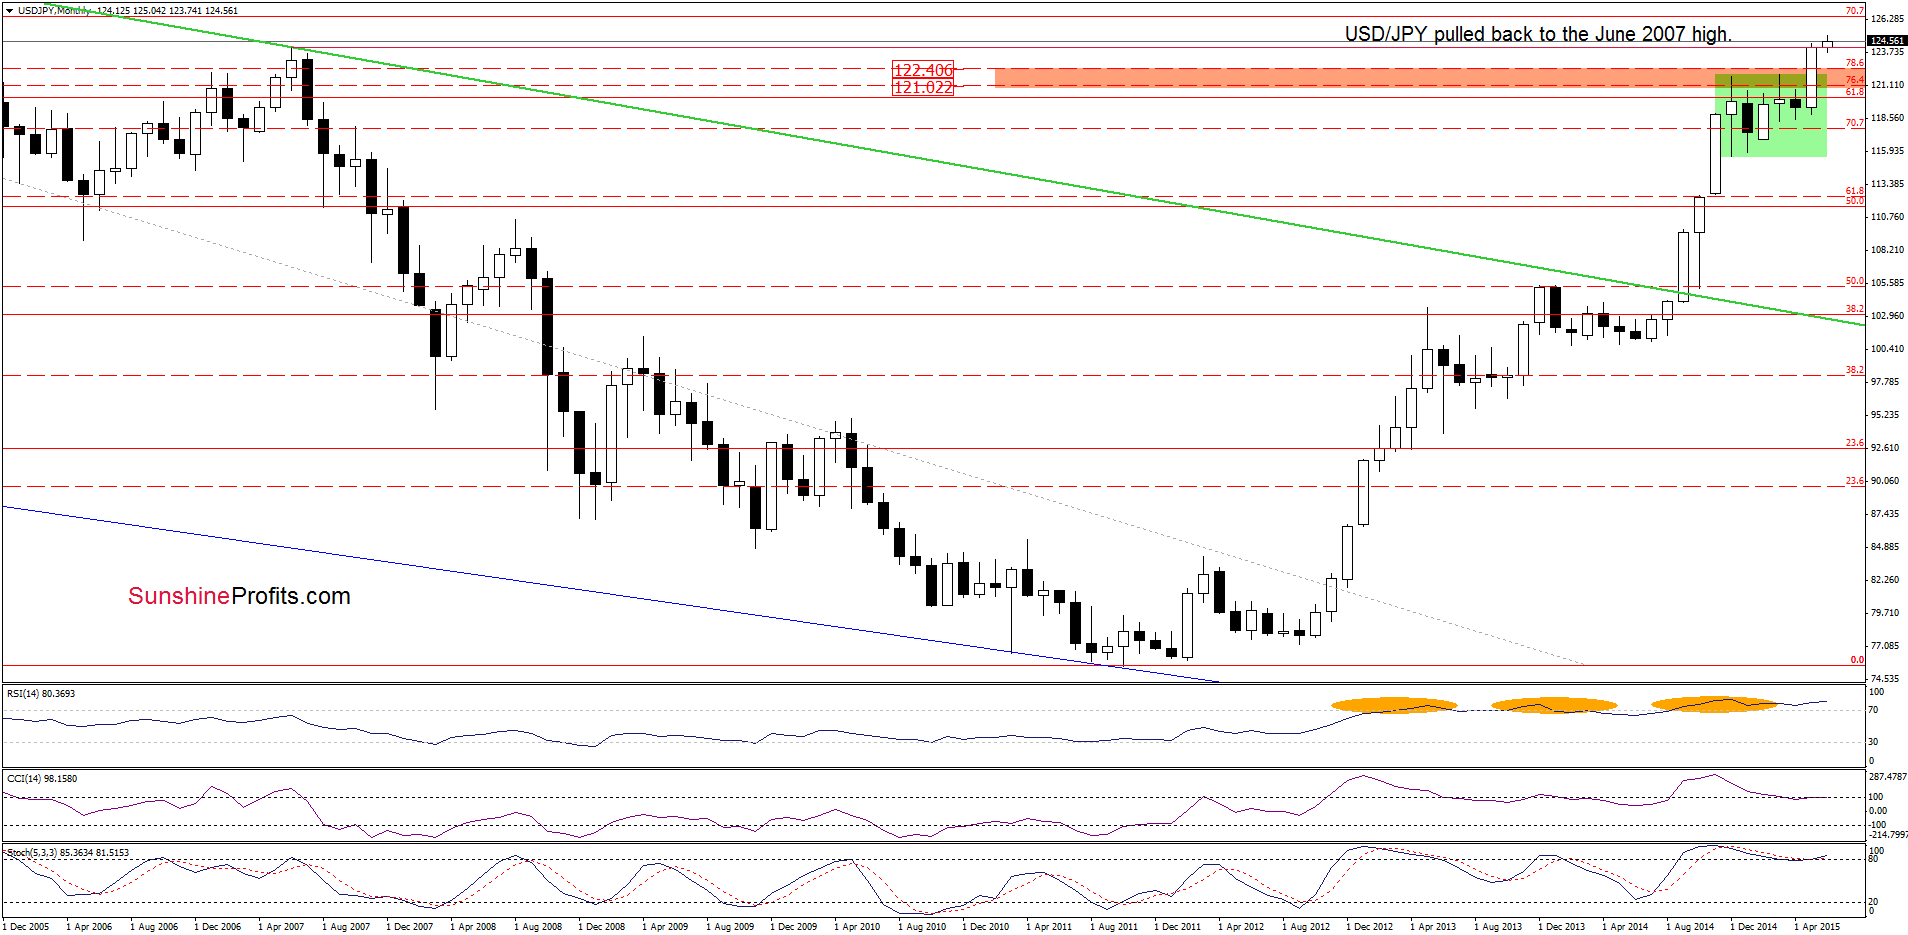
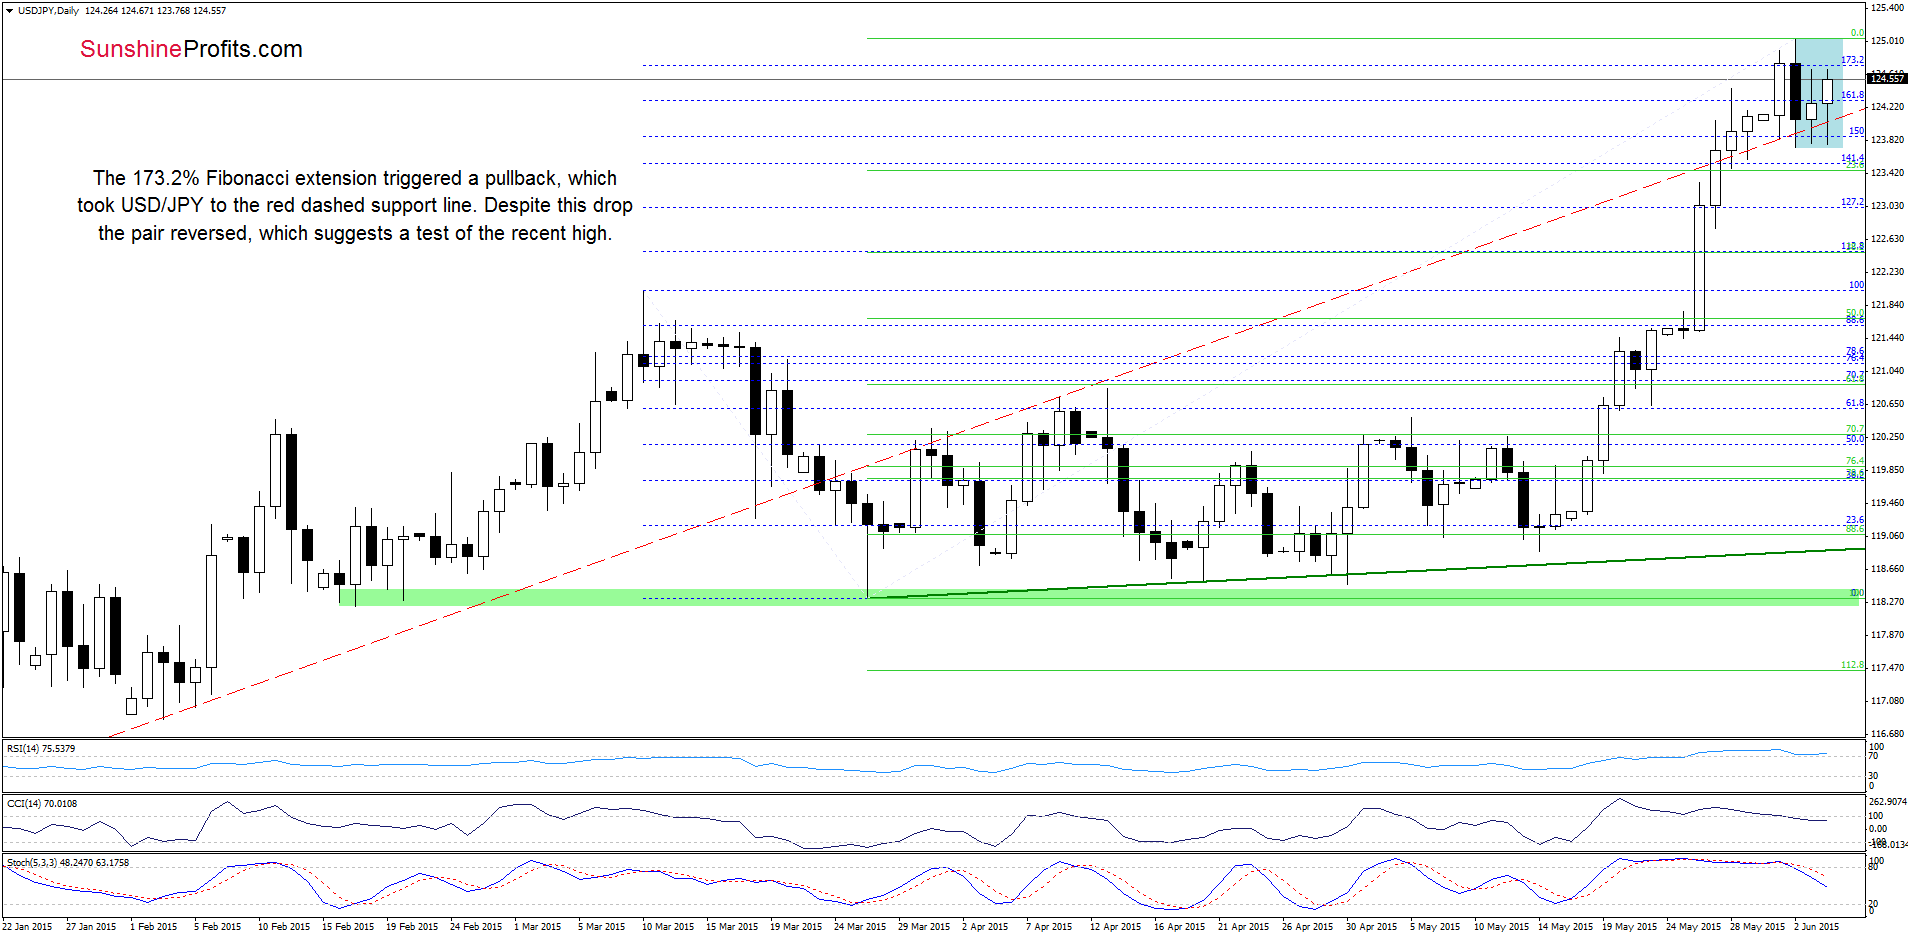
(…) the pair reached the 173.2% Fibonacci extension, which means that we could see a pullback from here in the coming day(s). If this is the case, the initial downside target would be yesterday’s low of 123.84. At this point, it is worth noting that this area is reinforced by the red dashed support line and the June 2007 high of 124.13, which could encourage currency bulls to act.
As you see on the charts, the situation developed in line with the above scenario and USD/JPY declined. With this downswing, the exchange rate re-tested the strength of the red dashed support line, but despite several attempts to move lower currency bears failed. As a result, the pair bounced off the lower border of the consolidation (marked with blue) and invalidated small breakdown under the red line. This is a positive signal, which suggests a test of the recent high in the coming day(s).
Very short-term outlook: mixed
Short-term outlook: mixed
MT outlook: mixed
LT outlook: bullish
Trading position (short-term; our opinion): No positions are justified from the risk/reward perspective at the moment. We will keep you informed should anything change, or should we see a confirmation/invalidation of the above.
USD/CAD
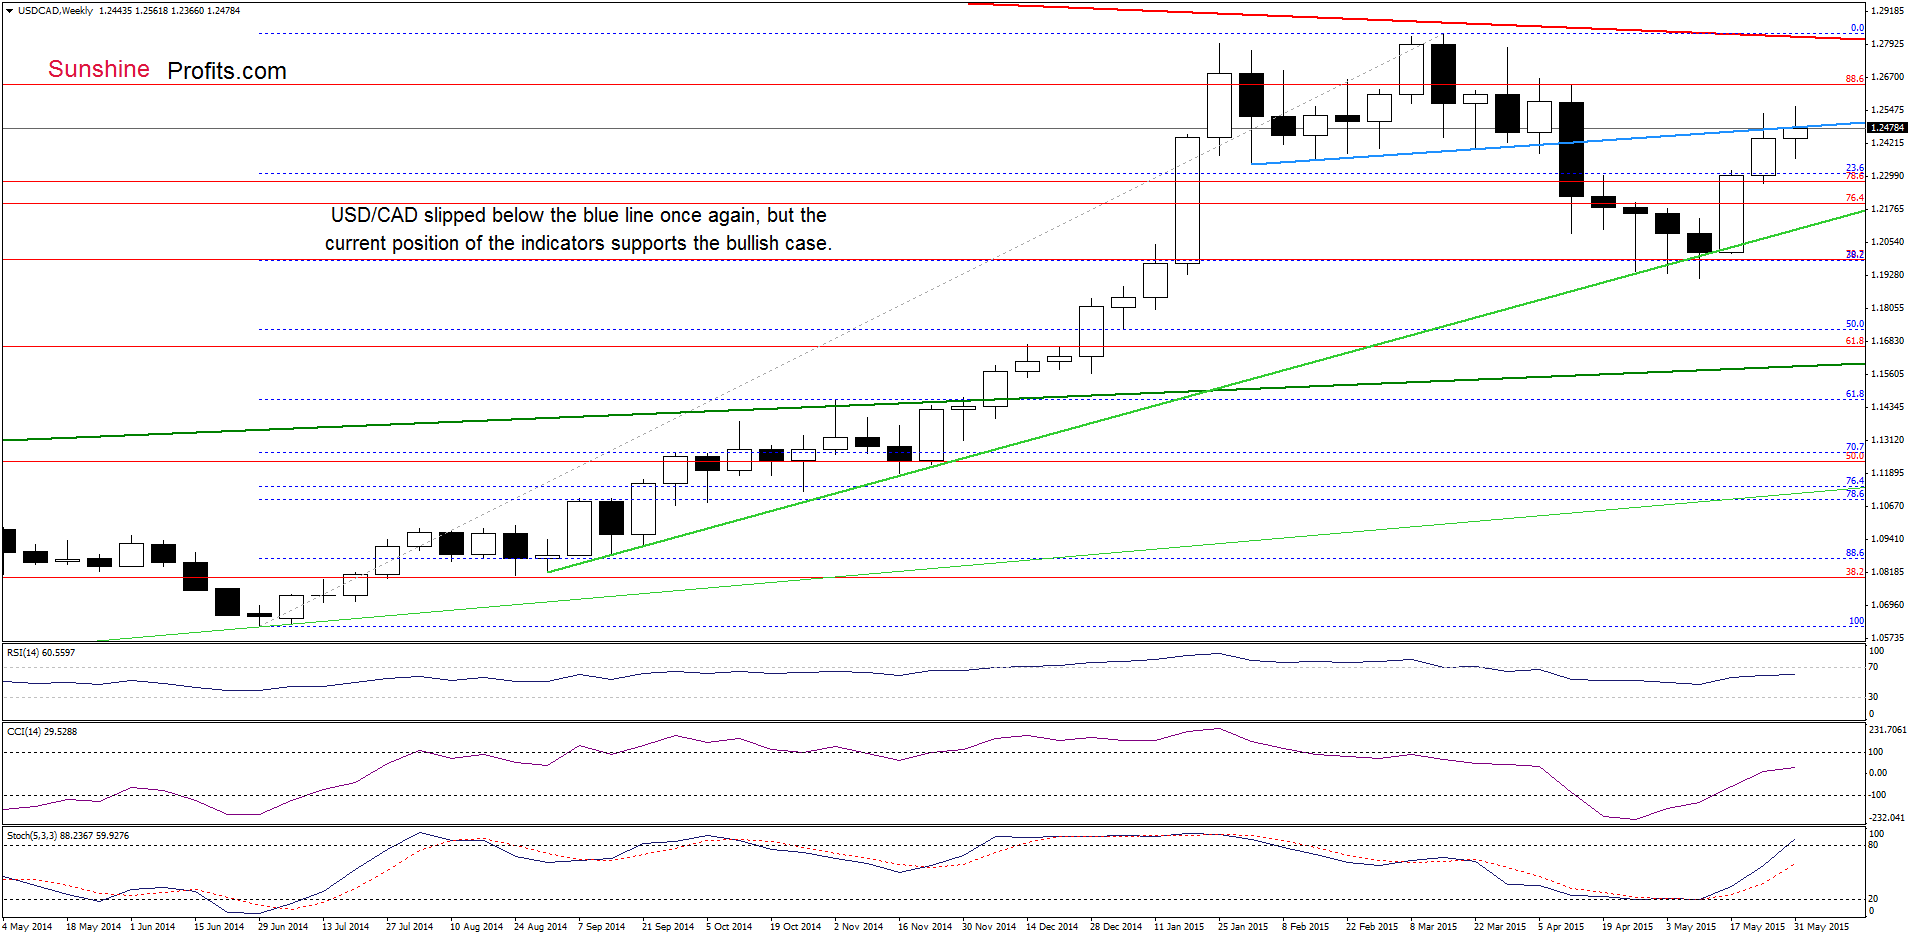
Looking at the weekly chart, we see that although USD/CAD pulled back once again, the exchange rate is trading very close the blue support/resistance line, which is a positive signal – especially when we factor in buy signals generated by the indicators, which supports further improvement.
Having said that, let’s focus on the very short-term changes.
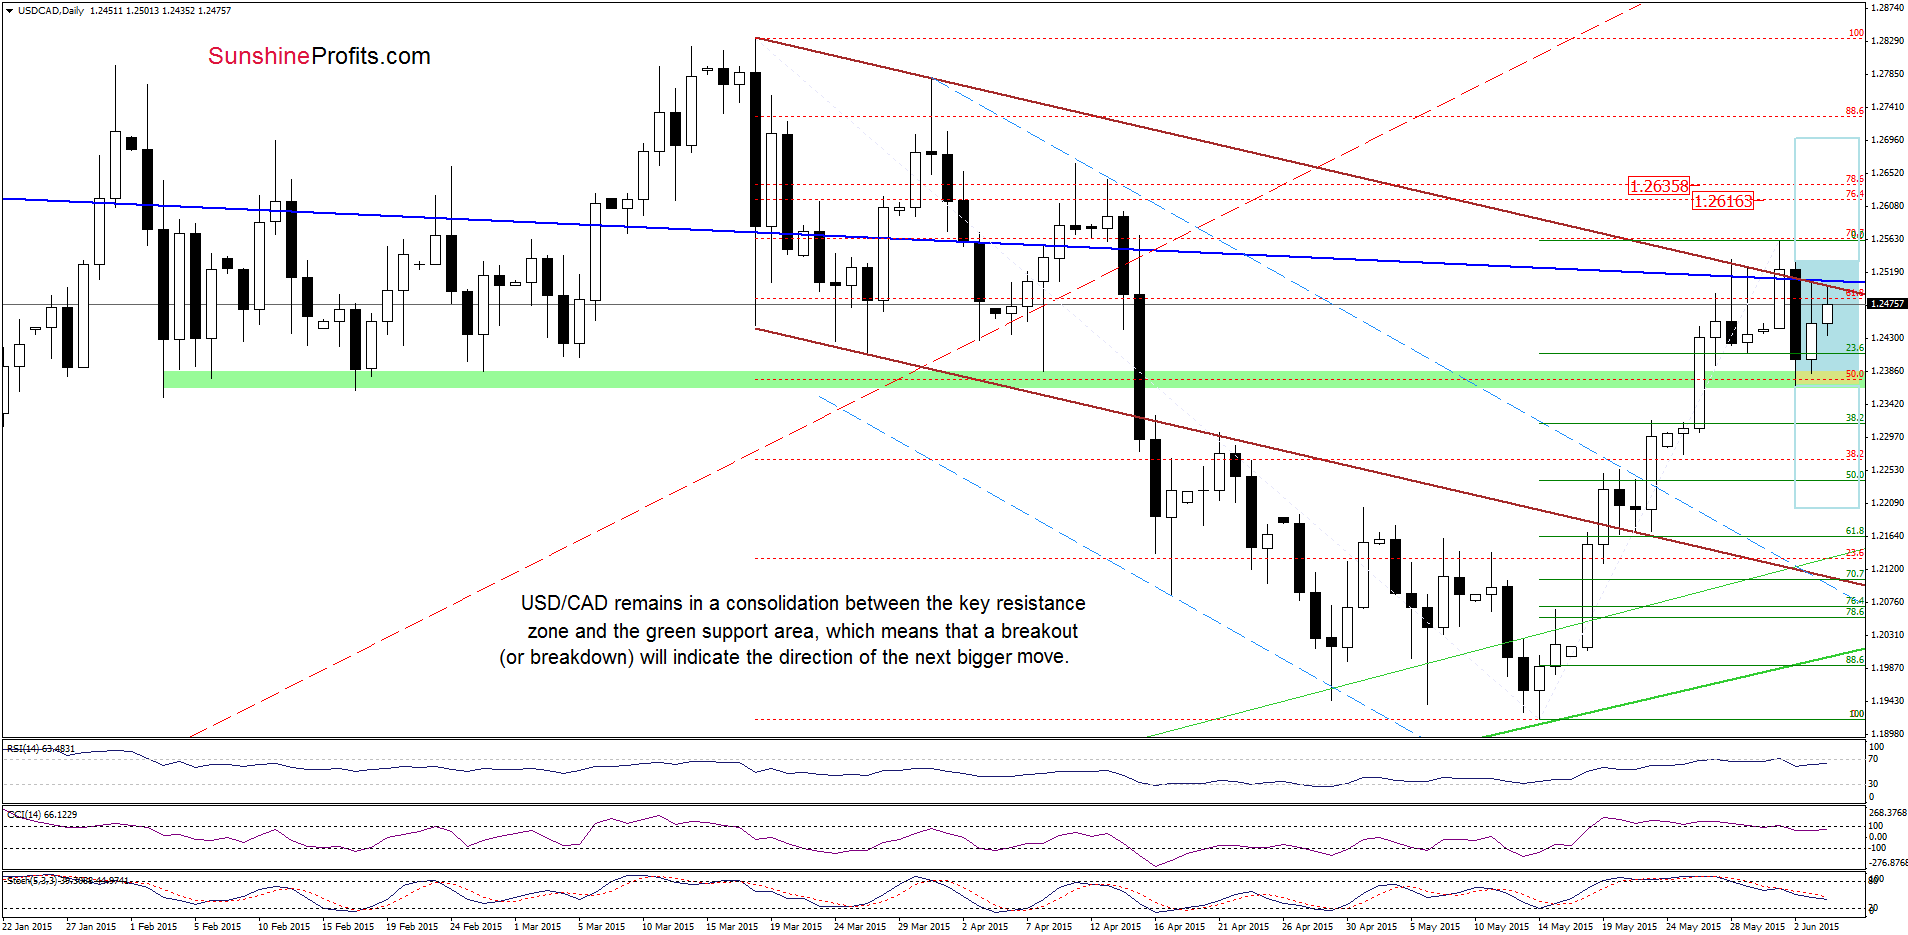
From today’s point of view we see that although USD/CAD declined sharply on Tuesday, the green support zone stopped further deterioration, triggering an upswing, which took the pair to the key resistance zone (created by the upper border of the brown declining trend channel and the long-term blue resistance line). Earlier today, we saw another attempt to move higher, but we think that as long as the exchange rate is trading in a consolidation (marked with blue) a sizable move is not likely to be seen. Therefore, a breakout above the upper line of the formation (or a breakdown below the lower border) will likely accelerate further improvement. Until this time, small moves in both directions should not surprise us.
Very short-term outlook: bullish
Short-term outlook: mixed with bullish bias
MT outlook: mixed
LT outlook: mixed
Trading position (short-term; our opinion): Long positions (which are profitable) with a stop-loss order at 1.1706 are justified from the risk/reward perspective at the moment. We will keep you informed should anything change, or should we see a confirmation/invalidation of the above.
Thank you.
Nadia Simmons
Forex & Oil Trading Strategist
Przemyslaw Radomski, CFA
Founder, Editor-in-chief
Gold & Silver Trading Alerts
Forex Trading Alerts
Oil Investment Updates
Oil Trading Alerts
